In continuation of my article on “How to Integrate Xcelsius 2008 with SAP NetWeaver BI without using Integration kit”, in this blog you will learn how to pass variables values to SAP BI Query from your dashboard using Web Service Connection.
Create a Query:
Create a simple query with a User input Variable.
For example:
Infoprovider name (Cube): ZSDN_DEMO
Query: ZSDN_DEMO_Q001
Variable: ZDM_CMON (Calendar Year/Month - Mandatory)
Testing Web Service Connection:
Refer to WEB API commands (Slide No 42) Web Services within SAP NetWeaver 2004s BI

Creating Web Service Connection in Xcelsius:
- Click Data Manager
- Add Web Service Connection.
- Pass the WSDL URL and click IMPORT
- In the Usage tab of the connection check the box Refresh on Load
Input Values
- Add 3 Items by clicking “+” (GetQueryViewData --> Parameter --> Item)

- In Excel sheet (Xcelsius) the provider name, query name and Variable name are maintained.

- Infoprovider (Select the cell with Infoprovider details by clicking 😞 ZSDN_DEMO
- Select Name (under 1st Item) and select the “VAR_NAME_1”
Value: Select the cell by clicking (ZDM_CMON)
Value: Select the cell by clicking (EQ)
- Select Name (under 3st Item) and select the “VAR_VALUE_EXT_1”
Value: Select the cell by clicking (200810)
- Similarly select Query and select the cell with Query Name by clicking 😞 ZSDN_DEMO_Q001
Output Values
Follow steps....as described in Article (for Output Values).
Developing dashboard:
Three components are used: - Input Text: Check the “Insert data on load” box and map the cell that has the Variable value (i.e. Cell B6), so when the user inputs value on dashboard and clicks on refresh, this value will be passed to the query.
- Spreadsheet Table
Display Data: Sheet1!$E$3:$H$18 (as shown below)
- Refresh Connection button
Properties: Check the connection box (General tab)


- Click preview/Export the visualization to the required format.
- Enter BI login credentials.

Dashboard
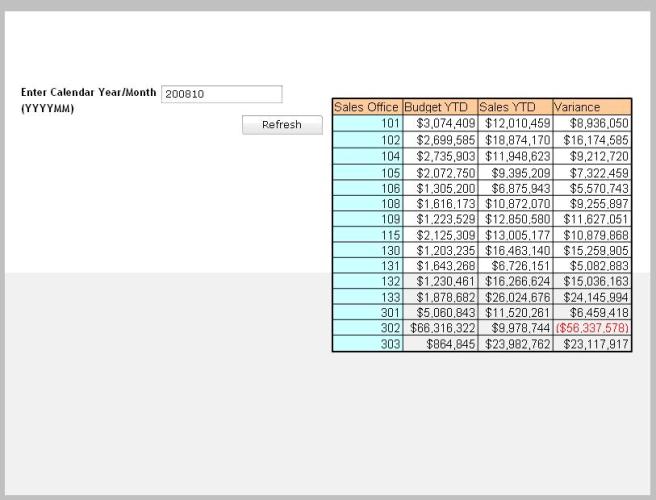
Notice that the aesthetics of the dashboard were not given lot of attention. In this example, more time was spent building the interface and troubleshooting the errors than visual presentation.
To check if the dashboard is getting real time data, enter different calendar year and click on “Refresh”.
