Especially when setting up a new Duet or an Alloy installation, it may happen that one or the other ESA WebService returns an error. In many cases the return table and/or the J2EE Default Trace provide enough information about the error that occurred. But in cases where this information is not sufficient, you may want to take a deeper look into what went wrong. E.g. catching the WebService call in the ABAP stack via an external breakpoint can enable you to troubleshoot the WebService call in more detail.
In this blog we will use the getLeaveInfo WebService from the Leave Management Facade in Duet or Alloy as an easy example. The assumption is that the getLeaveInfo WebService call is failing for a certain user. We simulate a missing Backend HR customizing entry that is causing the getLeaveInfo WebService to fail. Due to the failing WebService the Metadata download to the client is not successful, and therefore the Leave Management scenario on the client will not work.
For external (http) debugging on the ABAP stack please remember that the user for which you want to set an external breakpoint (e.g. the employee for which Leave Management is not functioning) needs to have debugging rights on the backend system!
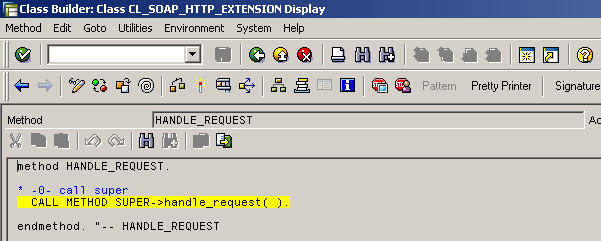
Whenever you want to go for external debugging on the ABAP stack the important question is where to put the breakpoint(s). One option would be to halt at a very early stage in order to not miss anything. For that you could simply put a breakpoint in class CL_SOAP_HTTP_EXTENSION in method HANDLE_REQUEST. This would break at quite an early stage with the disadvantage that you need to dig quite deep until you reach the interesting part.
Another option would be to put the breakpoint inside the respective ESA business logic. But for that we need to know which class / function module is processing the request. You can check the J2EE Default Trace to maybe find the error itself, or to find the name of the Service Definition.
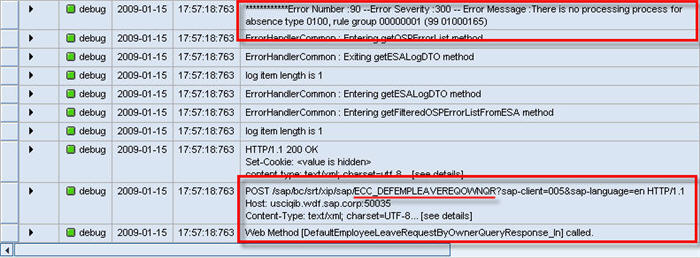
In the below screenshot the error message already indicates that something was not found. A few lines below the Service Definition ECC_DefEmpLeaveReqOwnQR is mentioned:
You can use this name to query for the Service Definition in the Repository Info System (Tx SE84). This gives you the Referenced Object II_TIM_DEFEMPLEVREQ_OWNQR:

By Double-Clicking on the referenced Object you see the Provider Class CL_TIM_DEFEMPLEVREQ_OWNQR that is processing the request:

By Double-Clicking on the Provider Class, and navigating into the method BUSINESS_LOGIC you can put an external breakpoint to debug what is going on:

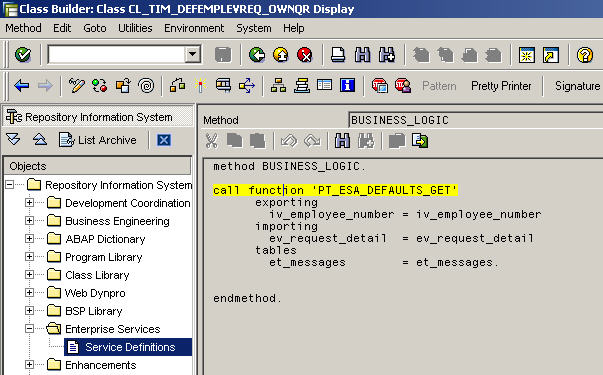
This of course still does not necessarily point you right away to the problem, but allows you to debug further into the business logic and e.g. check some return-tables (in this case et_messages) if there is more information about the problem.
In the given example, where we know that some customizing entry is missing (according to the error message in the J2EE Default Trace) you might want to put a breakpoint at the statement "SELECT" to maybe find out which database access is failing.
Btw: When enabling the logging for the J2EE Default Trace you may want to put the log-level for com.sap.xapps.osp and com.sap.engine.services.webservices.server.runtime to "All".
See How to troubleshoot Duet ESA WebServices - Part 2 of this blog where we use the SOA-Manager to trace ESA WebService calls.
