
- SAP Community
- Products and Technology
- Additional Blogs by Members
- The Transaction In The Lake (Part 1)
Additional Blogs by Members
Turn on suggestions
Auto-suggest helps you quickly narrow down your search results by suggesting possible matches as you type.
Showing results for
JimSpath
Active Contributor
Options
- Subscribe to RSS Feed
- Mark as New
- Mark as Read
- Bookmark
- Subscribe
- Printer Friendly Page
- Report Inappropriate Content
11-26-2008
4:37 AM
Detective's Log, Sunday Nov. 23, 2008
I got a page that a set of transactions needed skip tracing. It was late in the day, and I was working on a difficult hardware problem. So, I filed the task mentally to pick up in the morning.
Previous Related Cases
- Sometimes the case is open and shut
- Stuck in the update: Parts jim.spath/blog/2008/09/05/stuck-in-the-update-part-1 2 3 and 4
- Poor performance: detective story for this week
- Our ST10 (table buffer) performance incident (how we found it; how we fixed it)
Detective's Log, Monday Nov. 24, 2008 9:00 AM
I started digging into the facts of the case known at the time. We established a number of business critical metrics, for manufacturing, commercial, etc., several years ago. When we set these up, we chose several SAP transactions to monitor on a daily or weekly basis. Each functional area had a "market basket", or bellwether series of underlying specific transactions, like the Dow Jones Industrials or Transportation indexes. We thought combining these would give us a clearer picture of overall performance, than the individual numbers would.
Two indexes were drifting from their long term averages, meaning either a shift in the fundamentals (such as higher transaction load, OS, hardware, application software, storage or database tuning issues, or maybe higher data volumes or even (gasp!) un-archived data accumulations. My job was to figure out why.
I logged on to our Solution Manager system to get quick answers. Just as quickly, I turned it off as we're still getting the kinks out of that system. Maybe one day it will tell me everything I need to know, but for now, it's down to virtual shoe leather.
I spent part of the morning digging into the transactions on one of our R/3 production systems, using ST03 (workload analysis) and charting trends on a monthly basis. Early Watch reports do this out of the box, but only for the top 5 transactions each month. Only rarely do the problems show up that neatly. Here's one set of data:
| Xact | May08 | Jun08 | Jul08 | Aug08 | Sep08 | Oct08 |
A | 321.1 | 350.2 | 339.2 | 365.6 | 396.5 | 387.5 |
B | 209.6 | 211.1 | 203.2 | 173.7 | 195.6 | 208.5 |
C | 1,558.3 | 1,609.2 | 1,725.0 | 1,590.4 | 1,439.1 | 1,495.3 |
D | ||||||
E | 102.8 | 152.1 | 134.9 | 196.5 | 115.5 | 278.7 |
(note this was copied from my internal blog and pasted into the SDN space. Easier this way than what I've done before using spreadsheets, although charting is disabled)
Observations:
Transaction A slightly increased in the last 3 months. I'd want to know if anything changed in July or August to trigger this.
Transaction E jumped in October. On further analysis, though, the total time spent in this transaction was under 60 seconds for the month, so I stopped worrying about it.
Transaction C has a higher average than the others, so it probably more noticeable to users. It's also one that's executed more often than the others, so definitely has more impact on user experience. From a trending view, it is not very interesting. On the other hand, given that it's "weightier" it would be helpful to try to tune it.
Oh yeah, transaction D is nowhere to be found. I've shipped that over to missing persons.
Here's the other data:
| Xact | May08 | Jun08 | Jul08 | Aug08 | Sep08 | Oct08 |
A | 241.0 | 260.8 | 271.3 | 291.0 | 279.7 | 259.5 |
B | 185.0 | 200.9 | 195.8 | 184.9 | 216.1 | 219.5 |
VL02 | 2,229.6 | 2,228.8 | 2,434.9 | 2,385.7 | 2,429.2 | 2,495.4 |
Again, one transaction has a longer run time than the others, and in fact, is run more often. I didn't obscure it, as it's our lead suspect.
After looking by month, I looked by week. Unfortunately, I didn't spot any evidence of trends from that perspective. I have charts to prove it, if you're interested.
Looking at individual application servers lets you see which user IDs contribute to the total values for each time period. When I looked into VL02 ("Change Outbound Delivery"), it was apparent that the user WF-BATCH accounted for over 90% of both the steps and the time consumed.
Finally, a clue worth pursuing. I hoped.
Detective's Log, Monday Nov. 24, 2008 1:00 PM
In some cases, I've needed to look at each application server to spot characteristic differences in behavior. In this case, a quick look at a couple revealed similar patterns.
| User | Background Job | Number of Steps | T Response Time (s) |
| WF-BATCH | 12,164 | 38,398 | |
| USER A | 992 | 380 | |
| USER B | 200 | 114 | |
| USER C | 381 | 85 | |
| USER D | 127 | 84 |
Clearly, shadowing this user and creating a sketch for posting to other detectives and potential witnesses was going to be worth the effort.
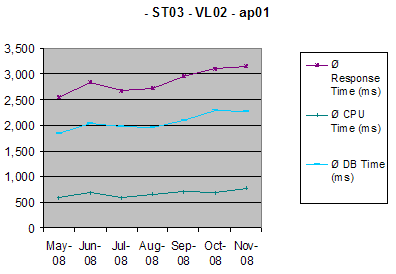
Here's the artist's rendition (man I dislike that word).
The default colors from Excel aren't always the most vibrant, but both total and database times were trending upwards. More shoe leather needed.
Detective's Log, Tuesday Nov. 25, 2008 8:00 AM
Now that I'd established a probable cause, it was time to crack open a few more tools from the toolbox. SM66, Global Work Process Overview, can be used to spot serious offenders. More often though, the low-hanging fruit has already ripened and been picked, leaving little to see here. But I was lucky (or good, or both), and saw this drift by:
Server | No | Typ | PID | Status | Start | Time | Client | User | Report | Action / Reason for Waiting | Table |
ap02_R3 | 3 | DIA | 811034 | running | Yes | 24 | 320 | WF-BATCH | SAPLTHFB | Insert | CKMI1 |
I knew I could find traces in a stakeout, and didn't have to be flipping through mug shots the rest of the day trying to get a match.
I'll skip over the other SM66 screen shots I took, as they led me to a series of jobs run through our enterprise scheduling software. This gave me a pattern of repetition, so I could look at SM66, ST03 and other views knowing when the code would run.
Detective's Log, Tuesday Nov. 25, 2008 11:00 AM
Armed with the above, I started staking out the suspects with a writ of SQL Trace. Here's an extract of an aggregated table report:
| VL02 | KNVV | SELECT | 13 | 24 | 92,474 | 0.0 |
| VL02 | VKDFS | INSERT | 4 | 4 | 7,636 | 0.0 |
| VL02 | KNVI | SELECT | 13 | 61 | 125,440 | 0.0 |
| VL02 | WBGT | SELECT | 13 | 0 | 9,431 | 0.0 |
| VL02 | TFDIR | SELECT | 13 | 26 | 9,770 | 0.0 |
| VL02 | VEKP | SELECT | 13 | 0 | 10,036 | 0.0 |
| Total | 10,813 | 63,628 | 29,585,073 | 98.0 |
A lot of individual tables being passed around, like funny money in small non-sequential bills. Bunko squad? No, I don't think so. Time to step back and look at the bigger picture, drink some coffee, have a lunch quesedilla, chat with colleagues.
Detective's Log, Tuesday Nov. 25, 2008 1:00 PM
After a few more ST05 Performance Analysis / SQL trace stakeouts, identical statement analyses and views with a different perspective, I pulled one table out for closer scrutiny. It started with "CE4" but I found no hits on SDN (orGoogle for that matter), which my Basis contact said was due to the table being generated.
| Duration | Obj. name | Op. | Recs. | RC | Statement | ||||||
| 5 | CE4____ | REOPEN | 0 | SELECT WHERE "MANDT" = '999' AND "AKTBO" = 'X' AND "KNDNR" = 'N' AND "ARTNR" = 'CD' AND "FKART" = ' ' AND "KAUFN" = ' ' AND "KDPOS" = 000000 AND "AUFNR" = ' ' AND "BUKRS" = 'LLC' AND "KOKRS" = 'PE... | |||||||
| 1,747,370 | CE4____ | FETCH | 0 | 1403 | |||||||
| 4 | CE4____ | REOPEN | 0 | SELECT WHERE "MANDT" = '999' AND "AKTBO" = 'X' AND "KNDNR" = 'N' AND "ARTNR" = 'CP' AND "FKART" = ' ' AND "KAUFN" = ' ' AND "KDPOS" = 000000 AND "AUFNR" = ' ' AND "BUKRS" = 'LLC' AND "KOKRS" = 'PEC... | |||||||
| 1,484,496 | CE4____ | FETCH | 0 | 1403 | |||||||
| 4 | CE4____ | REOPEN | 0 | SELECT WHERE "MANDT" = '999' AND "AKTBO" = 'X' AND "KNDNR" = 'N' AND "ARTNR" = 'KA' AND "FKART" = ' ' AND "KAUFN" = ' ' AND "KDPOS" = 000000 AND "AUFNR" = ' ' AND "BUKRS" = 'LLC' AND "KOKRS" = '... | |||||||
| 597,860 | CE4____ | FETCH | 0 | 1403 | |||||||
| 4 | CE4____ | REOPEN | 0 | SELECT WHERE "MANDT" = '999' AND "AKTBO" = 'X' AND "KNDNR" = 'N' AND "ARTNR" = 'KC' AND "FKART" = ' ' AND "KAUFN" = ' ' AND "KDPOS" = 000000 AND "AUFNR" = ' ' AND "BUKRS" = 'LLC' AND "KOKRS" = '... | |||||||
| 1,943,660 | CE4____ | FETCH | 1 | 0 | |||||||
| 6 | CE4____ | REOPEN | 0 | SELECT WHERE "MANDT" = '999' AND "AKTBO" = 'X' AND "KNDNR" = 'N' AND "ARTNR" = 'KC' AND "FKART" = ' ' AND "KAUFN" = ' ' AND "KDPOS" = 000000 AND "AUFNR" = ' ' AND "BUKRS" = 'LLC' AND "KOKRS" = 'PE... | |||||||
| 1,991,189 | CE4____ | FETCH | 0 | 1403 | |||||||
The red lines are a clue.
(Continued)
2 Comments
Related Content
- Simplifying Employee and Manager Experiences with Employee Central Quick Actions in Human Capital Management Blogs by SAP
- Analyze Expensive ABAP Workload in the Cloud with Work Process Sampling in Technology Blogs by SAP
- Debugging transaction MD04 in SAP S/4HANA in Enterprise Resource Planning Blogs by SAP
- Quick Start guide for PLM system integration 3.0 Implementation in Product Lifecycle Management Blogs by SAP
- CIG transaction tracker handling in Technology Q&A