
- SAP Community
- Products and Technology
- Additional Blogs by Members
- What? Performance is slow? I'll get right on it....
Additional Blogs by Members
Turn on suggestions
Auto-suggest helps you quickly narrow down your search results by suggesting possible matches as you type.
Showing results for
JimSpath
Active Contributor
Options
- Subscribe to RSS Feed
- Mark as New
- Mark as Read
- Bookmark
- Subscribe
- Printer Friendly Page
- Report Inappropriate Content
01-26-2008
5:39 PM
I blogged about a performance issue in sales order management last September. That focused on problems caused by table buffering changes. This time, there are reported issues with manufacturing response time, both dialog and batch.


I used a scatter plot to display each user's response time for that day. There are a few over 2 seconds, including a surprising maximum over 4 minutes. I later found out from the Basis team that we were getting dumps where other transactions hit the maximum time allowed, but these are not recorded in ST03 times.

Custom Indexes we have created over the past 10 years on MSEG and MKPF
Conclusions?
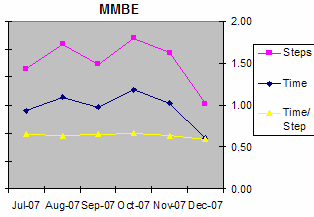
First I looked at dialog response time using ST03 (expert mode). I picked a few of the most-used transactions starting with "M". We keep 5 months online, so I viewed average response times back to July 2007. For each month, I copied the values to a spreadsheet after switching the screen to Excel viewing mode.
It's easier for me to see the trends with a picture, so I graphed the first 3 columns - dialog steps, time, and time per step. I often compute the average instead of using the downloaded column. Below are the views I captured.
I saw different trends, where some transactions show degrading performance over time, with others remaining constant. This means the entire system is not having a problem, but perhaps it is the tables or indexes used in MB51? As that one showed the largest change, I looked at it closer (note the slope of the yellow line on the first graph compared to the others).
The week view has higher numbers than the month views led me to think, although a few readings were under 2 seconds. I stopped charting after looking at 2 application servers as I felt a pattern was beginning to emerge.
When I added a trendline, I saw increasing response time on these app servers. The change from December to mid-January was a half second. This might start to be noticeable to users.
I posted emails asking if end users were reporting worse performance, and didn't hear of anything significant, although one business analyst mentioned that using date ranges in MB51 seemed to be less efficient than he thought it should be.
The day view widened the recorded response time ranges. This time I looked at one more app server, and skipped the weekend data.
The last drill down level I looked at was response time per user for MB51 on each application server on a specific day. This is the only way I've found to understand who is doing what, without running traces or analyses.
I used a scatter plot to display each user's response time for that day. There are a few over 2 seconds, including a surprising maximum over 4 minutes. I later found out from the Basis team that we were getting dumps where other transactions hit the maximum time allowed, but these are not recorded in ST03 times.
The last plot for that day omitted the top user, with a resulting trend of the vast majority of users seeing 1 or 2 seconds.
After looking at ST03, I switched gears the next day and started looking at ST04 to find what was showing up in the database shared SQL statement cache, and looked at a different perspective in ST03, the 10 minute snapshot.
The SQL cache review highlighted an SAP program (RM07DOCS) as having many disk reads. Several executions of one ABAP statement were in the cache, hinting that the code was being run in different ways.
Here's one I found:
SELECT
  T_01 . "ANLN1" , T_01 . "ANLN2" , T_01 . "APLZL" , T_01 . "AUFNR" , T_01 . "AUFPL" ,
[...]
FROM
  "MKPF" T_00 , "MSEG" T_01
WHERE
  ( T_01 . "MANDT" = '040' AND T_00 . "MANDT" = T_01 . "MANDT" AND T_00 . "MBLNR" = T_01 . "MBLNR"
  AND T_00 . "MJAHR" = T_01 . "MJAHR" ) AND T_00 . "MANDT" = '###' AND T_01 . "MATNR" = '##'
  AND T_00 . "BUDAT" BETWEEN '20080121' AND '20080122' AND T_01 . "WERKS" = '##'
Note: I changed literal values to number signs
This is a join between MSEG and MKPF, with the former being larger (50GB?). The explain plan lists a nested loop, with MSEG accessed with index "M" and MKPF using the primary key index. The material number was entered but not the year, which might be more efficient. Index "M" also keys off material number, with plant (WERKS) as the next key, so this should work well. But ST04 shows almost 30,000 disk reads for this statement, meaning it could be better.
ST03 10 minute detail report
| Started | Server | Transaction | Program | T | Scr. | Wp | User | Response Time | Time in |
|---|---|---|---|---|---|---|---|---|---|
| ms | WPs ms | ||||||||
| 10:01:39 | ap06_PRD_0 | MB51 | RM07DOCS | D | 0120 | 0 | T | 14,808 | 14,726 |
| 10:03:54 | ap02_PRD_0 | MB51 | RM07DOCS | D | 0120 | 8 | L | 18,629 | 18,536 |
| 10:05:12 | ap03_PRD_0 | MB51 | RM07DOCS | D | 0120 | 31 | Y | 33,836 | 33,518 |
| 10:07:24 | ap07_PRD_0 | MB51 | RM07DOCS | D | 0120 | 2 | E | 169,999 | 169,858 |
| 10:08:46 | ap07_PRD_0 | MB51 | RM07DOCS | D | 0120 | 8 | C | 38,617 | 38,536 |
| 10:11:37 | ap07_PRD_0 | MB51 | RM07DOCS | D | 0120 | 2 | E | 37,659 | 37,659 |
An email sent to a user returned with the feedback:
"... pero lo corrio sin parametros, ya hable con ellos para que no vuelva a pasar"
(Maybe Blag or Ignacio can help me out here)
Some of the above will be easier once I get Central Performance History working - see these earlier blogs [7606and 7607 ] for where I'm headed with that.
I'll try to blog on the batch run time analysis when I have time.
[All opinions expressed are mine, no one else's]
[04-Feb-2008 Update]
Problem user or problem system?
Ignacio rightly challenged my assertion that performance problems are caused by users, as it should be up to the developers and infrastructure team to deliver quality customer solutions. However, sometimes the budget isn't big enough, and sometimes, you inherit a system designed for a previous problem while users are solving the next one.
Problem user or user error?
There is turnover in the user community, so last year's training class was effective for those who attended, but not new hires. This dilemma requires ongoing learning, whether virtual, viral or vocal. Part of my job is determining where those gaps occur. Then there are refresher courses, or just reminders, for those who have forgotten the basics such as which columns allow the fastest return on query investment.
Then there are the "top" users, who are the exception to the rule, and who sometimes need to submit the dinosaur killer query to get their job done. The systems people need to recognize who they are, and perhaps steer them to a quiet time to prevent contention with other users.
Nuts & Bolts
After posting my original blog, I have continued research with the Basis and DBA teams. Below are findings as of 04-Feb-2008. Our Unicode conversion is next week, so some performance aspects may change due to index rebuilds. One index on MKPF did not get transported to production this weekend as expected, meaning I'll need to wait another 2 weeks before that impact is seen.
Tabe rows (TST)
MSEG 145,342,400
MKPF 19,374,700
Custom Indexes we have created over the past 10 years on MSEG and MKPF
MSEG~Z1
- WERKS
- BWART
- KOSTL
MSEG~Z2
- LIFNR
- WERKS
- BWART
MSEG~Z3
- LGORT
- WERKS
- BWART
- SOBKZ
MSEG~Z4
- AUFNR
- MATNR
- WERKS
- BWART
MKPF~Z1
- MANDT
- CPUDT
MKPF~Z2
- MANDT
- BLDAT
MKPF~Z3
- XBLNR
MKPF~Z4
- USNAM
- BUDAT
PRD - Oracle 9i / non-Unicode
SQL Plan for above generated code
TST - Oracle 10g / Unicode
New index is in place; transport into production 02-Feb-2008.
PRD - a different SQL statement from the same ABAP statement
The Plan
TST plan
Well, this is not as good as the other, as the optimizer decided date wasn't selective enough (range is a month instead of one day now), and went for index Z1 on MSEG. This will find all the rows mathing that plant (and the 2 BWARTs), and weed through MKPF by MBLNR. Ugh -- what I like to call the Mumble Number.
Shrinking the date dange in ST05 explain plan demo screen shows how the plan changes.
T_00 . "BUDAT" BETWEEN '20070526' AND '20070527'
The other improvement to this plan is a switch from NESTED LOOP to HASH JOIN.
Conclusions?
Not yet! There is a transport in flight, as well as Unicode and Oracle 10 migration. We could see improvements from better user education, and maybe pre-filling columns to steer users away from open-ended wildcard queries.
Stay tuned.
12 Comments
Related Content
- The project system should automatically update the equipment usage counter in Enterprise Resource Planning Q&A
- Kyma Integration with SAP Cloud Logging. Part 2: Let's ship some traces in Technology Blogs by SAP
- Error for Document Date in AR Invoice #59921 in Technology Q&A
- Debugging transaction MD04 in SAP S/4HANA in Enterprise Resource Planning Blogs by SAP
- Update Fields Record Learning Tool in Human Capital Management Q&A