In this WebLog I want to promote a very simple but also effective way of analyzing the performance of a running Web Dynpro application. This technique is an easy approach to detect given bottlenecks of a running Web Dynpro application. When a Web Dynpro application developer has to detect such a bottleneck during the development process she has to find an answer on the following questions:- Origin: Where does the performance bottleneck originiate from? Is it based on a problem on client side (parsing), on server side (application logic, server processing) or on backend side (business logic)? Does my dynamic view modification code cause the problem? Is it the execution of an Adaptive RFC model class?
- Effectiveness: How do I know whether my approach to solving the performance problem is going in the right direction? How can I measure the performance improvement during this iterative optimization process?
Attaching the Web Dynpro URL-parameter sap-wd-showInfo
To find a first answer on these two questions I highly suggest using the generic Web Dynpro URL-parameter named sap-wd-showInfo, which is applicable in SAP NW04 and NW04s.
In order to measure and characterize end-to-end performance of a running Web Dynpro application per client-server-roundtrip, just add the parameter sap-wd-showInfo to the application-URL and set it to any non-null value (e.g. “X” or “true”). The Web Dynpro HTML browser client then displays the following time values [in ms] in the status line
| Browser | - parsing: time for parsing HTML
- JSBefore: time for processing JavaScript code before HTML rendering
- HTML: time for rendering HTML
- JSAfter: time for processing JavaScript code after HTML rendering
|
| J2EE | - Server side processing time
- Time to process and dispatch an incoming request to the Web Dynpro Runtime
- Time needed by the Web Dynpro Runtime to process the complete phase model
|
| Back-End | - Length of time for accessing the backend (executing Adptive RFC model classes)
- Not measured (0) when other models are used (JavaBean, Adaptive Web Service Model)
|
| Size | - Estimated response size in kilobytes.
|
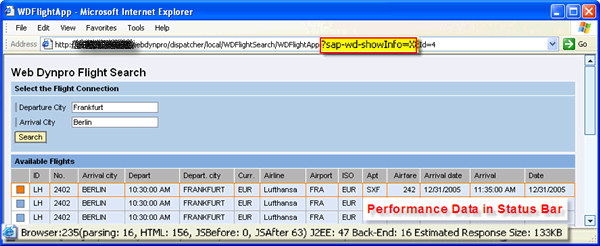
With the displayed time values you can determine the origin of potential performance bottlenecks on client side, server side or on backend side. The values are re-calculated in every single request-response cycle.
Restrictions - The URL parameter sap-wd-showInfo can only be applied for those Web Dynpro applications, which are not running within the SAP NetWeaver Portal as iViews do not provide a visible status line.
- The Backend time value is only measured for Adpative RFC Models. It is 0 for (Adaptive) Web Service or JavaBean Models.
Setting URL Parameters in the Web Dynpro Tool Preferences
To automatically add the key-value pair sap-wd-showInfo=X to the URL of a deployed Web Dynpro application you can use the Web Dynpro Tools preferences.
- Select menu item Window - Preferences in the SAP NetWeaver Developer Studio.
- In the preferences tree open node Web Dynpro - Server.
- In the field URL parameters enter the value sap-wd-showInfo=X.

Afterwards the defined URL parameter will be automatically attached to the application URL when iteratively deploying and running the Web Dynpro application you are actually developing.
Using the Web Dynpro Console
In this respect I want point out, that the Web Dynpro Console can be used to measure the client performance across multiple request-response cycles.
- Login to the Web Dynpro Console Application as an Administrator: http://:/webdynpro/dispatcher/sap.com/tc~wd~tools/WebDynproConsole
- Select the node Admin Menu - Performance - Client
- Open a new browser instance. Do not use the menu item File - New - Window (or CTRL+N) but run a new browser instance via Programs ....
- Start Measuring by pressing the Start button.
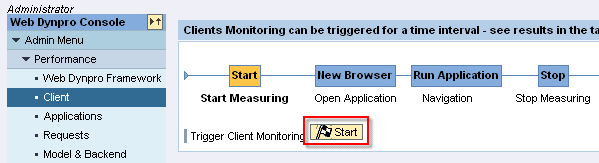
- Enter the URL of your test application in the new browser window and press Return.
- Interact with your Web Dynpro application by triggering on or more actions.
- After having completed your test scenario inside your Web Dynpro application window press Stop in the Web Dynpro Cosole.
- The Web Dynpro Console now displays the client performance results for the recorded request/response cycles (time interval). The calculation of different time values (total, average, minimum and maximum time, call count) for the quantities time_parse, time_scriptAfterHTML, time_applyInnerHTML, time_scriptBeforeHTML and response is based on the Browser-related performance values, which were displayed in the status bar.

Enjoy Web Dynpro,
Bertram Ganz, NW ESI F UI - WDF4J, SAP AG
