Administrators always want to know who is doing what in the portal -- who is entering the portal, what iViews or being run, which users are viewing which pages.
The Portal Activity Report gave you some of this information; now, since SAP NetWeaver 2004 SP Stack 15, it gives you more, and it is also easier to set up.
The changes I'm going to describe were first put into SAP NetWeaver 2004s, and then into 2004 for SP Stack 15.
Portal Activity Report
First, a quick overview of the Portal Activity Report.
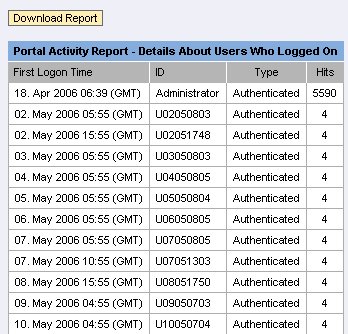
You can create an iView that displays data about who entered the portal and what iViews were run. The following is example of an iView that displays who entered the portal over the last 20 days, and the number of hits for each user:
You create a portal activity report by creating a new iView from the Portal Activity Report template, and then you open the iView for editing to configure it.
The editor has two panes:
- Type of Report: In this pane, you decide what type of information you want to display, such as the number of users over a specified period or the number of hits for each iView.
- Report Period: In this pane, you specify the reporting period, and the interval, that is, how to break up the data. For example, you can get a report for the last month, and see the data broken up per day.
The following is the editor for a Portal Activity Report iView:

How It Works
Just a few words on how the Portal Activity Report works.
The data collection service monitors activity in the portal, and creates a record in the portal database for each action, let's say, each time someone logs on or views an iView.
Every so often, a standalone application aggregates the data, getting rid of the raw data. The data can be aggregated for different time periods, for example, for each hour, day or month, based on the configuration of the aggregator application.
Here's a quick overview of the process:

New for SP15
The following are the major changes for SP15:
- Data Collection Service: You no longer have to start the data collection service -- it is automatically started when the portal is installed.
- Aggregation Application: You no longer need to deploy, configure and start the application. At one time, it was thought that the aggregation application might be a severe drain on performance of the portal, that it was delivered as a a separate application to be deployed on another machine. But it was shown to not affect performance, so now it is bundled together with the portal and automatically started.
- New Reports: The following additional reports or options were added:
- Weekly Intervals: You can now break down a report by week (and not just by day, week, month and quarter).
- User Reports: You can create reports that show what users logged on during a specified period, as well as the number of hits generated by each user.
In addition, the report that shows how many times each iView was viewed, also now shows which users viewed the iView. - New Reporting Period: Reports can now display information for the current day, or for the previous hour, day or week. In earlier portal versions, you could only specify a fixed time period.
For more information about portal activity reports, see http://help.sap.com/saphelp_nw04/helpdata/en/58/728ea01cf64fff996b827f2a06f9b1/frameset.htm.