
- SAP Community
- Groups
- Industry Groups
- SAP for Chemicals
- Blogs
- Value Management Approach for the Chemical Compani...
SAP for Chemicals Blogs
Explore blog posts by chemical industry leaders and SAP experts, showcasing transformative solutions powered by SAP. Contribute a blog post of your own.
Turn on suggestions
Auto-suggest helps you quickly narrow down your search results by suggesting possible matches as you type.
Showing results for
Employee
Options
- Subscribe to RSS Feed
- Mark as New
- Mark as Read
- Bookmark
- Subscribe
- Printer Friendly Page
- Report Inappropriate Content
12-05-2022
12:41 PM

Ola, boa tarde!
Reference
That is Part 3 of the blog article series I would like to describe the Value Management Approach for Chemical companies.
- The Part 1 with common overview of the approach is here: https://blogs.sap.com/2022/10/24/value-management-approach-for-the-chemical-companies-part-1/
- The Part 2 with KPI list and baseline description is here: https://blogs.sap.com/2022/11/04/value-management-approach-for-the-chemical-companies-part-2/
Today I will continue with the common approach and for doing this I should mention the common scheme.

Picture 1. The effective Value Management Approach – high-level overview.
In previous Part # 2 I described the main issues of KPI list definition and the baseline data collection. Baseline is important because any improvements might be calculated as delta between starting point and current. I you did not fix your starting point you will not be able to calculate your benefits in the future. There are steps 1, 2 and 3 on the scheme on the Picture 1 above.
Next Step 4 is about identification weak point and setting the targets of expected KPI values based on baseline analysis and benchmarking.
Identification of the Weak Points & Setting Targets | Step 4

To start let’s look again to the output of the Step 3
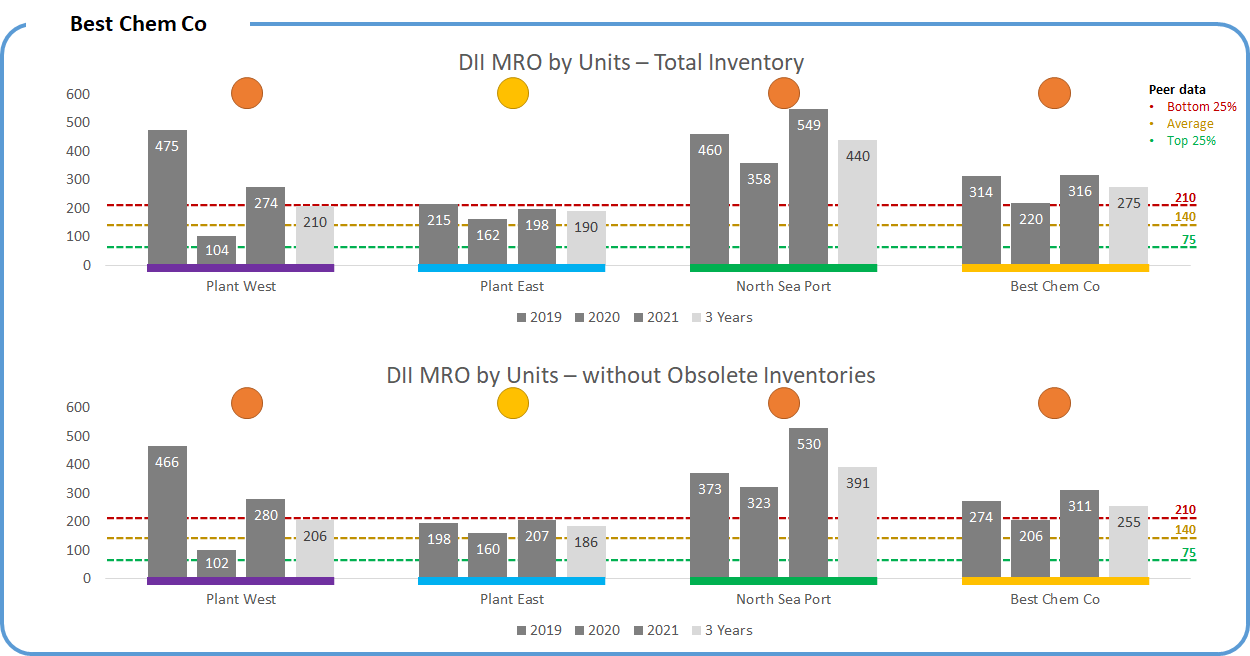
Picture 2. The baseline and benchmarking results for DII MRO.
What do we see based on this example and what hypotheses and conclusion we might make before the exploration?
- Obsolete inventory is not an issue and does not impact significantly on the KPI values. We are able exclude this and do not spend our focus on it,
- “North Sea Port” has worst KPIs values with bad trend, which may indicate a complete lack of supply chain management and control in this division,
- “Plant East” demonstrates best and stable results which are pointing on good enough supply chain management process comparing to other divisions and it could be the good internal benchmarking and source of experience for “Best Chem Co”
- Current business process in “Plant East” may allow to manage supply chain of MRO materials, it must be proved
- There is not any internal expertise sharing inside “Best Chem Co” between divisions,
- “Plant West” likely working by yearly planning cycles related to periodic shutdowns for overhauls
These processes usually impact on the DII MRO KPI:
- Material Master Data Management,
- EAM Master Data Management,
- EAM Long-term Planning (quarterly, monthly),
- Material Requirements Planning (MRP),
- Sourcing and Suppliers Performance Management,
- Procurement,
- Inbound Delivery and Quality Management,
- Warehouse Management,
Based on these hypotheses and knowledge about processes we can prepare the interview with business and request some materials from IT department. It’s recommended to request the current IT landscape from IT department before the interview. Also, I suggest preparing standard questionnaire for the interview.
Questionnaire for the Interview (example)
Here is the partial example of how these questions should be clarifies for DII MRO. For each answer should be recorded and short answer and any additional commentary.
- Material Master Data
- Is there a process / system in place for the management of MRO material master data?
- Is there a process / system in place to manage changes or analogues for MRO materials?
- Is there (in the process / in the system) a process for managing the categories of MRO materials to be purchased?
- Are MRO Materials defined in Maintenance Task Lists? How? What % is covered (estimated)?
- …
- Material Requirements Planning
- What is the (in-process / system) source of the MRO material requirements?
- At what point (in the process / in the system) is the available budget is being verified when creating material requisitions?
- At what point (in the process / in the system) is the change in the available budget controlled when consuming material for MRO purposes?
- Is the Material Requirements Planning (MRP) process implemented (in the process / in the system) in accordance with the generated requirement?
- How often (in the process / in the system) is the MRP process run? Daily, monthly, yearly, …?
- Is consolidation of requirements for external requisitions supported (in the process / in the system) by the MRP process?
- Is (in-process / in-system) the MRP process supported by a check of your own stock on hand?
- Is (in-process / in-system) the MRP process supported to check the allocation (targeted use) of your own stock inventory?
- How are defined ABC / XYZ categories for MRO materials?
- What planning strategies (Determined, Reorder Point, Statistics-based, …) are used for different MRO ABC / XYZ categories?
- Are lead times defined for MRO Materials? How are these lead times revised? What % is covered (estimated)?
- …
- Procurement
- Is the total cost of ownership (TCO) used (in the process/system) for supplier selection?
- Is the (process/system) qualification and performance evaluation of suppliers maintained?
- Is there an (in-process / system) process for managing material purchase contracts maintained?
- Are long-term contracts used against MRO ABC / XYZ categories?
- Is vendor-managed inventory process used? If yes – how many vendors and what categories?
- …
- Material Transactions
- Is there (in the process / in the system) a reserve of available inventory for the requested demand?
- Is there (in the process / in the system) an inbound quality control process for purchased MRO materials?
- Are the serial numbers managed for some MRO materials? How and where?
- …
- Management Analytics
- What reports you are using for MRO supply chain management? What is the reports’ content and frequency run?
- What KPI do you have for the MRO supply chain management?
- How these KPIs being managed? How are you motivated to these KPIs?
- …
I cannot provide questionnaires for all KPIs because it out of scope in this blog. Of course, our colleagues from SAP Value Advisory team can provide the full scope, if you are interested you can schedule the meeting via your Account Executive.
I recommend preparing similar questionnaires templates for all KPIs and record answers directly to templates – it will help you perform series of interviews, confirm / reject your hypotheses, and it will support you with ideas and arguments to define the transformation roadmap.
Planning of the interviews
The scheduling of the interviews with management is important because you need to allocate your resources and customers’ management time. To schedule the interviews, I recommend using the same table with responsibilities on KPIs which we already developed in the Step 1, but it also important to merge interviews about different KPIs for one responsible manager – to save his / her and your time. For example, if the Chief Engineer is responsible on DII MRO, OEE, Planned and Unplanned Shutdowns – it makes sense to discuss all these KPIs during one meeting.

Picture 3. Responsibility Table for the Interview Scheduling.
Setting of targets KPI values
This activity is one of the most difficult in the traditional value estimation approach because you should force the business management to believe in miracle in the future. But after you have performed the benchmarking comparison and have discussed (during the interviews) most details of the current process and root causes with executive management there will be easier for them to trust you and accept targets, because:
- Benchmarking results and peer comparisons already in place,
- Company Internal intra-divisions benchmarking also already in place – different divisions and responsible management usually run with different performance and here is the base and way to improvements,
- Root causes are likely clear based on answers by questionnaire,
- Targets are set by periods (years) for several years upfront,
- Targets are based on the current values, different starting points assume different targets,
- Ways to reach the targets must be discussed also during the interview including possible investments projects, which should be collected and grouped into one transformation program. Most of executives usually know about the issues, also the usually know what to do, and in most cases, they just search for reason to approve the investments for the improvements. The Value Management activity is the best reason do it – setting targets in exchange on investments.
The optimal moment to discuss KPI targets with executives is the same interview about current situation of “as-is” process based on answers of detailed questionnaire. That’s why another question topic should be added:
- Efficiency
- What is your opinion about possible improvement and targeted values for the future?
- What is your vision about projects and improvements should be done to reach these targets?
That´s how these targets may be represented.

Picture 4. Example of target KPIs for 3 Years Upfront.
What should be taken into consideration while setting the targets:
- Targets a different for business units because they are in different starting points,
- Targets are based on starting points,
- The calculation algorithms should be the same, for DII MRO example – 3 Years Average,
- You need to consider the project time. In our example we are in 2022, that´s why we will be able to plan and finish the project only in 2023, that´s why it makes sense to start the measuring only after completing the 2024. It´s impossible to promise and get the instant results with Supply Chain Optimization – it will take time to get an effect.
Results of the targets set should be included into one KPI calculation table.
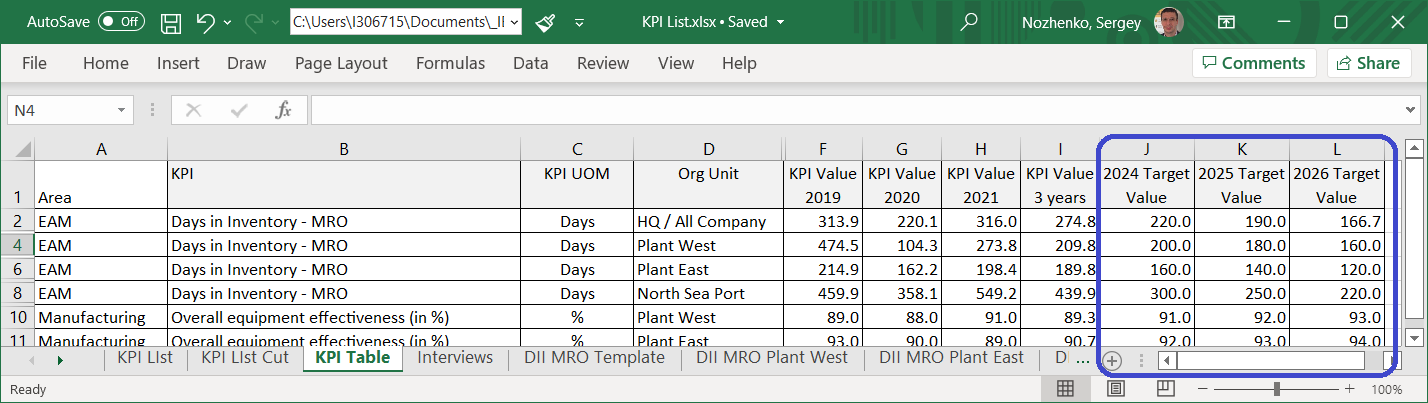
Picture 5. Targets added into KPI Calculation Table.
Roles and responsibilities for the Step 4:
Step 4 should be performed by company’s Business Efficiency (BE) team with assistance and advisory of SAP Value Advisory team (SAP VA) and with participation and approval of business executives (CXO).
Outcomes for the Step 4:
As the result we have gathered important insights about current processes practices and issues and approved the target KPI values. That leads us to the Step 5 – calculation of expected outcomes.
Calculate Monetized Outcomes | Step 5

Important disclaimer: all monetized values and amounts in this blog article are just for illustration of calculation logic and do not have any real source nor from SAP neither from any customer.
The Chemicals KPIs list which I proposed in Part 2 has been defined with following main points:
- Chemicals Industry relevant,
- May be compared with Chemicals Industrial Peers,
- Not so many to prevent the overload,
- Lead to clear financial outcomes
- Asset management area is highly important for Chemicals asset-incentive industry with continuous production cycle where shutdown of the one equipment might cause stop all production line with losses of production volumes and with high costs and time of the process restart,
- Manufacturing area and especially Overall Equipment Effectiveness (OEE) also critically important for the process where equipment should run in 24x365 mode,
- Sustainability with especially energy consumption ratio and manufacturing safety performance does not need any additional comments,
- Material turnaround or “Days in Inventory” (DII) impacts significantly to the working capital and should be measured for every type of inventories separately (raw materials, semi-products, goods, MRO material, CAPEX materials, others),
- Days Payables Outstanding (DPO) and Days Sales Outstanding (DSO) together with DII impact on Cash Conversion Cycle and possibility to manage and financing the operations with lower external credits to decrease the cost of capital.
Every KPI has its own logic to calculate outcomes. It’s impossible to proceed in detail with all KPs in this blog article, I will explain the business effects logic with example of DII MRO.
When Company has inventory in stock it assumes the freezing of the working capital in the Inventory. Money spent to the Inventory Stock are excluded from financing of the business operations. In our example the value of the “frozen” cash can be calculated from the data provided (3 Years Average).
- Plant West = (2 333 333 + 1 766 667) / 2 = 2 050 000 (USD)
- Plant East = (12 333 333 + 11 966 667) / 2 = 12 150 000 (USD)
- North Sea Port = (15 583 333 + 16 800 000) / 2 = 16 191 677 (USD)

Picture 6. Data collected for DII MRO.
In Step 4 we have defined targeted KPI values for DII MRO. For the calculation logic let’s take it for “Plant West”:
- 2024 (DII MRO Target) = 200 (Days)
- 2025 (DII MRO Target) = 180 (Days)
- 2026 (DII MRO Target) = 160 (Days)
Let´s look at the DII formulae for 3 years average:
“DII MRO 3 Years Ave” = 3*365*(“Ave INV Value for 3 Years”) / (“Sum of INV MRO Issue for 3 years”)
Where:
- “Ave INV Value for 3 Years” – average MRO inventory value for 3 years
- “Sum of INV MRO Issue for 3 years” – summary of all MRO materials spent (issued) for 3 years
If we assume that in the future the “Sum of INV MRO Issue for 3 years” value will be the same (it makes sense because we do not plan to change the Maintenance Volumes), that we´ll see all of parameters in the formulae above are constants except our targeted “Ave INV Value for 3 Years”
That means – new “Ave INV Value for 3 Years” for each targeted DII MRO is just proportion or rate of baseline DII and new targeted DII on the targeted year.
Applying this logic considering the baseline DII MRO “Plant West” = 210 Days.
- 2024 (DII Proportion) = 200/210 = 0,952
- 2025 (DII Proportion) = 180/210 = 0,857
- 2026 (DII Proportion) = 160/210 = 0,762
Multiplying these proportions to baseline “Ave INV Value for 3 Years” value to calculate targeted INV Value on each Year:
- 2024 (“Ave INV Value for 3 Years”) = 0,952 * 2 050 000 (USD) = 1 954 338 (USD)
- 2025 (“Ave INV Value for 3 Years”) = 0,857 * 2 050 000 (USD) = 1 758 904 (USD)
- 2026 (“Ave INV Value for 3 Years”) = 0,762 * 2 050 000 (USD) = 1 563 470 (USD)
Now we can calculate the yearly differences in the frozen inventory values.
- 2024 to 2021 = 2 050 000 – 1 954 338 = 95 662 (USD)
- 2025 to 2024 = 1 954 338 – 1 758 904 = 195 434 (USD)
- 2026 to 2025 = 1 758 904 – 1 563 470 = 195 434 (USD)
That is the total amount of freed working capital for 3 years, which is our first cash flow effect – it means “Best Chem Co” will not spend these money for the procurement. It´s a one-time effect.
But there is also another effect from the freed working capital: the freed capital should be invested to “Best Chem Co” business operation and in this case, it will return the additional operational margin of net profit margin after taxes.
Let’s imagine that our “Best Chem Co” has its internal investments rate return = 6% in net profit margin. That means that our internal investments of the freed capital may be calculated for 5-years horizon with the capital grow rate 6% yearly. It´s a periodic effect.
Doing all these calculations with the 5-years period we´ll get the following results for “Plant West”:

Picture 7. Plant West expected benefits estimation for 5 years horizon.
Above I have clarified the benefits calculation logic just for one example – “DII MRO” improvements for one business unit “Plant West”.
The same logic should be applied for other business units and for all others KPIs. It´s obviously that all these calculations will consume lots of time and workload, and for different KPIs the business effect and calculation logic is to be also different. It´s impossible to provide all detail in one blog but we can do it in the actual project if you are interested.
I recommend keeping all these calculations in one KPI Table. The full KPI table should look like this:

Picture 8. KPI Table with calculations of expected business outcomes.
All calculations and source data collected in one file and linked. This is important to keep it all in one master storage to be able disclosing all calculated outcomes in all details based on source collected data promptly by any request.
This topic for Step 5 is overloaded with digits and formulas, I know it’s hard to read and I am sorry for this, but I must put here all this stuff to explain the outcomes calculation logic.
Roles and responsibilities for the Step 5:
Step 5 should be performed by company’s Business Efficiency (BE) team with assistance and advisory of SAP Value Advisory team (SAP VA) and with participation and approval of business executives (CXO).
Outcomes for the Step 5:
As the result we have calculated expected business outcomes because of reaching target KPI values. Next step is to create the transformation program and formulate tasks which will help to achieve these effects. That leads us to the Step 6.
Define the Scope | Step 6

Business Scope Definition
Previously we have already found the points of weakness. In the Steps 2 & 3 we identified pain points by measuring KPIs (as an example I took the DII MRO). As an outcome of the Step 4 we have discussed possible sources of the lagging KPI areas with the business executives.
To keep the story logic, I will consider DII MRO KPI as an example. Let´s imagine that we have the interviews results from Step 4.
Usually, the EAM managers and planners considering these issues and pain points which can cause the risks of unavailability of spare parts for mandatory and critical maintenance tasks. Of course, this rick is unacceptable for Chemicals industry which is critically depends on maintenance quality and performance.
That´s why EAM-responsible managers are trying to mitigate this risk by ordering the important spare parts “in advance”, “just in case” and “as early as possible”. Ordered and delivered spare parts often even be taken from central warehouse or distribution centre and kept inside dozens of small shop-floor-owned” inventories as non-legal “safety stock” which is usually not recognized by MRP.
Considering this KPI there are several typical pain points sources of the lagging values:
- Untransparent and manual spare demand definition process
- Issues with EAM Master Data and Maintenance Orders Planning
- Rare or wrong usage of MRP, low quality and performance of supply chain planning for spare parts
- Long and unpredictable actual supply lead time – from purchase requisition to delivery
- Low service level of the own EAM Spare Parts Warehouse
- Low visibility of “shop-floor-owned” inventories
Taking these theses into account we can develop the transformation roadmap with solutions on following areas:
- Enterprise Asset Management processes and functions improvements:
- EAM master data (spare parts records for manufacturing equipment and maintenance task lists)
- EAM long and midterm planning
- Supply chain management:
- MRP for spare parts
- Inventory & Warehouse Management for Spare Parts
- Sourcing & Procurement for Spare Parts
Solution definition & SAP Transformation Navigator
Based on these improvements areas we can build the transformation roadmap with SAP solutions. For this task I recommend use the tool SAP Transformation Navigator. Unfortunately, this tool is unavailable for external access and can be used only by SAP employees or by authorized customers and partners. But anyway, I´d like to describe shortly only several tool capabilities:
- Recommend SAP solutions by desired capabilities and outcomes
- Manage SAP solutions pre-requisites
- Build transformation roadmap
- Connect the roadmap with SAP Value Lifecycle Management tool (I described in Part 2) to estimate value outcomes
- Generate Business Guide, Technical and Transformation Guides for recommended SAP Solutions and roadmap built
- Generate SAP Solution list with material codes and license or subscription metrics
- … and many others

Picture 9. Example of one page of SAP Transformation Navigator generated documents “Transformation Guide”.
Program high-level plan
Another important & mandatory task is the high-level plan development. This task better be completed with expected implementation service providers – SAP Services and/or SAP Service Partners. The Service Sourcing procedure is out of scope of this blog, but better way to start is using the SAP Partner Finder tool.
In collaboration with chosen Service Provider, you’d be able to develop the high-level plan. This how it might look like for the early estimation phase. It´s important in scope of Value Management approach because we need to calculate time-depended business outcomes.
For our example I consider that we are in the 1st quarter of 2022, and the example roadmap might look like this:

Picture 10. Example of high-level transformation roadmap.
This roadmap is very simplified. What are most important points here:
- Minimum lead time from the idea to start the value realization is 2 years – considering periods for program preparation and realization, and the stabilization phase.
- Stabilization phase (Q3 & Q4 year 2023 on the roadmap) is mandatory time lag, because company must start to work in new processes and solutions (processes and users adoption, etc)
- If we expect monetized effect from new Spare Parts management (to improve DII MRO), we must consider the work by new EAM and Supply Chain planning processes before they will provide effects. Planning and supply cycles are long for big plants, and first effect for FII MRO KPI we can expect after 6-9 month after go-live, not earlier.
I hope, now it´s clear why companies usually are unable to reach the instant business effects in the go-live moment, and why it takes so long to get real monetized results from the idea formulation.
And that leads us to next chapters 7 “Estimate the Program Costs” and 8 “Estimate the ROI, NPV, IRR”. I plan cover these topics in the next article.
Roles and responsibilities for the Step 6:
Step 6 should be performed by company’s Business Efficiency (BE) team with assistance and advisory of SAP Value Advisory team (SAP VA) and with participation and approval of business executives (CXO), and Software and Services providers (SAP with Partners and Cloud Hyperscalers).
Outcomes for the Step 6:
As the result we have built high-level program roadmap and understood the expected value realization period.
- SAP Managed Tags:
- Chemicals
You must be a registered user to add a comment. If you've already registered, sign in. Otherwise, register and sign in.