
- SAP Community
- Products and Technology
- Additional Blogs by SAP
- Take Your Solutions to New Heights with SAP Busine...
Additional Blogs by SAP
Turn on suggestions
Auto-suggest helps you quickly narrow down your search results by suggesting possible matches as you type.
Showing results for
former_member95
Explorer
Options
- Subscribe to RSS Feed
- Mark as New
- Mark as Read
- Bookmark
- Subscribe
- Printer Friendly Page
- Report Inappropriate Content
08-01-2016
2:10 AM
As I begin writing this blog, a memory comes to mind of a time when I sat with fellow students in the great hall of the university I attended. We sat discussing the latest in technology and one of my student colleagues talked about a day not too far in the future when all of our PC’s and laptops would no longer house OS’s and instead we’d connect to the “cloud” to get emails, create documents, develop software, etc. I sat there looking at my laptop and thinking about Moore’s Law where hardware has gotten more powerful and cheaper by the year and so although I was intrigued by this notion of cloud services, I didn’t completely agree that this is where technology was headed. If we look backwards, we used to rent space on mainframes in the early days of computing before hardware became commoditized enough for us to have the luxury of multiple home computers whether they were desktops or laptops. I thought, “would we really end up going back to renting resources?”
And now here we are; my friend was right. We’ve come full circle, but we haven’t given up our home computing resources, we’ve simply complimented them with cloud resources. In our personal lives we use services such as Gmail for email and calendar, Google Docs and Sheets or Microsoft 365 for cloud based productivity, Dropbox and Onedrive for cloud based extended storage, and Ufile or H&R Block Online to do our tax returns. Who needs an accountant? The cloud delivery model certainly has a huge benefit to consumers in the way of more affordable services and this certainly extends to the corporate world. Let’s take a look at a couple of interesting facts from a recent IDG survey on corporate cloud adoption.
- In 2012, 57% percent of organizations had
- Of those surveyed, 58% were using a public cloud model while 26% were using hybrid models.
- On average, 25% of IT budgets are being allocated to the cloud and if we look at that further, 51% if that is towards SaaS, 30% towards IaaS and 19% towards PaaS.
Source: http://www.idgenterprise.com/resource/marketing-tools/cloud-the-technology-powerhouse-infographic/
It’s pretty clear that businesses are increasingly adopting cloud infrastructure as well as cloud application services and for good reason. Cloud subscriptions are classified as an operating expense (you pay for what you use) versus a capital expense (you buy all the physical servers and amortize it down over a period). Being able to save money by only paying for what you need and being able to take that savings and re-invest it into your business is becoming increasingly critical to a company’s success and growth. Re-aligning resources to support strategic initiatives, increasing budgets for things like R&D to drive innovation are a few of the biggest reasons companies are embracing this new world of “anything-as-a-service”.
With the stage now set on why cloud can be a game changer, I’d like to put the spotlight on an SAP business intelligence cloud offering that was introduced to the market at the beginning of 2016 called SAP BusinessObjects Cloud (formerly known as Cloud for Analytics). I’ll refer to it simply as BoC from here on in as the latter is, well not a mouthful but in this case a keyboardful.
If you’re wondering where in the stack of cloud acronyms BoC fits, I would say it fits in the category of PaaS or Platform as a Service because it delivers a set of capabilities or tools that allow you to perform analytical functions on your data. We can even go so far as to further classify it as BIaaS or Business Intelligence as a Service. Now before we explore some of the great things SAP is delivering within this new offering, I should clarify that although SAP BusinessObjects Cloud shares a similar naming to its sibling SAP BusinessObjects Enterprise, they are completely different solutions. Unlike many vendors who take their existing BI solutions, stuff them into the cloud and rename it, SAP stepped back and looked at what was needed to truly create a solution that’s native to the cloud. This new solution therefore has all the attributes associated with a good cloud application such as a simple UI with responsive thin client design, scalable architecture, highly available, mobile support and social collaboration.
BoC delivers on each of these attributes as it has a completely HTML5-based front end and it is built on SAP’s HANA Cloud Platform which is an open standards based platform as a service based on in-memory technology for building new applications and extending existing applications. The last thing that makes a cloud application a great application is of course API’s and although they aren’t available today, SAP has prioritized them highly on the roadmap with the aim of delivering RESTful integration points late 2016-early 2017. So for those partners reading this and wondering if you can embed BoC into your own apps, the capability is on the near horizon so start your free trails today!
Source: http://www.businesscloudnews.com/2016/05/19/sap-updates-businessobjects-offering-at-sapphire-now-con...
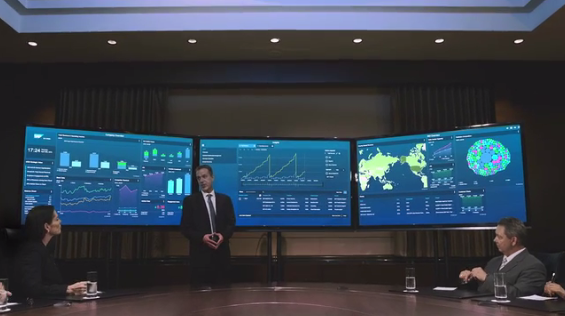
In my mind, the key differentiator between BoC and all the other cloud analytics solutions in the market is the really cool way that it allows you to organize and present your data to your audience, whoever they may be. Looking at the three screen set up above, doesn’t it look like something out of the CIA mixed with a bit of Minority Report? Those three screens are displaying a single real-time and unified view of one or more areas of a business. And this is what is delivered through what’s called The Digital Boardroom within BoC. Think of it as a way to turn your data into insights, organize them into a story, present and tell your story, and ultimately drive business results in a real time, engaging and interactive way. The three screens from left to right represent an overview of the business (furthest left), a more detailed view of specific areas called the detail view (middle screen) and lastly to the right the contextual details which help to complete the picture. Interactions on charts on any screen can drive what is shown on any of the three monitors. And at any time, let’s say when there’s a question that the data on display cannot answer, the user has the ability to go back to contextually pop into the data exploration view. Here they can slice and dice, look at different data points, filter, drill, etc to answer that question and then jump right back into the Boardroom to complete their workflow or presentation. The beauty of all this is that as you move through the story the data is telling, you always have the ability to look back on the previous screen for reference. If you’re reading Game of Thrones, then you’ll know exactly what I’m talking about. You get so deep into the story that once in a while you need to open the map at the start of the book to re-orientate yourself. Well, the full data story through Boardroom allows you to do that at any point. As I mentioned previously, this is what sets BoC apart because only BoC has the capability to span a single dashboard across multiple monitors without any additional set up from the end user while allowing for touch and gestures to drive the experience. Very exciting stuff! You might say, well, I can get a dashboard to display across three screens. But if you really look into what’s involved; three browser windows? How do they interact with each? One browser window? How much work is required to lay out all your charts and components so they appear in their assigned screens and do not overlap? It’s not as simple as a single click and simplicity is what BoC is all about.
Lastly, in my opinion, the name Digital Boardroom limits the use case a bit to a boardroom setting, but it can be applied to so many more scenarios. If you close your eyes and imagine a manufacturing floor, through BoC the operations manager at any time can have a real time view of employee metrics, production metrics and even sensor data coming off the machines with alerts allowing action to be taken before failure. Now imagine a call center with hundreds of employees manning the phones. A supervisor can use DBR to quickly and easily understand details such as response rates, call durations and abandon rates. From the initial display, they can drill down into the detail screens to understand the impact to underlying business KPI’s such as close rates, leads generated, sales revenue, etc, But the analysis doesn’t end there. They can also perform predictive forecasting on expected call volumes so that they can plan on headcount being available each day, and more importantly, to be able to do that in real time so instant decisions can be made when needed. So call it the Digital Boardroom if you like, or call it a “Command Center”, “Operations Awareness” or a “Business 360 View” or whatever name suits you, at it's core it is a single transparent and interactive view of one or more areas of the business intended to provide its audience immediate insights for informed and agile decision making. It certainly sets SAP's cloud analytics apart from the herd so for your partners out there looking for a competitive differntiator of your own, perhaps the Boardroom is just what your users have been looking for!
There’s so much more to BoC, including the different analytical tools that allow users to create the Digital Boardroom content we discussed and I’d love to go into that but alas, a blog is intended to be short and concise, not a rambling essay. Stay tuned for part two!

- SAP Managed Tags:
- Partnership
Related Content
- Meet PLM experts from SAP at Hannover Messe 2024 in Product Lifecycle Management Blogs by SAP
- RISE with SAP advanced asset and service management package in Supply Chain Management Blogs by SAP
- RISE with SAP advanced PLM package in Supply Chain Management Blogs by SAP
- Unlock the Power of AI with Intelligent Selling Services for SAP Commerce Cloud in CRM and CX Blogs by SAP
- Deliver Real-World Results with SAP Business AI: Q4 2023 & Q1 2024 Release Highlights in Technology Blogs by SAP