


- SAP Community
- Products and Technology
- CRM and Customer Experience
- CRM and CX Blogs by SAP
- SAP Hybris Cloud for Customer ⚡ Performance Best P...
CRM and CX Blogs by SAP
Stay up-to-date on the latest developments and product news about intelligent customer experience and CRM technologies through blog posts from SAP experts.
Turn on suggestions
Auto-suggest helps you quickly narrow down your search results by suggesting possible matches as you type.
Showing results for
Employee
Options
- Subscribe to RSS Feed
- Mark as New
- Mark as Read
- Bookmark
- Subscribe
- Printer Friendly Page
- Report Inappropriate Content
05-21-2016
7:07 PM
Performance Overview
End to end to performance consists of the time spent in the client (browser/device), the server and the network. Quite a few factors influences performance in terms of client settings, network setup and how you customizations are implemented. The following articles and how-tos will help you run C4C with optimal performance.
 Performance Analysis Blogs
The intention of these blogs is to break down performance analysis into simple tasks so that users and admins can take necessary actions to understand and troubleshoot what may be causing slowness in their implementations. We have also categorized these blogs into basic and expert so that general users along with admins can drill down into performance issues based on their comfort levels. These blogs are as a result of feedback from various constituencies including customers, partners and SAP colleagues in (Support, CEE, MCC, CoE and Expert Services).
You comments and suggestions are welcome.
Thank you!
Performance Team
Performance 101
This blog walks through the process of understanding and analyzing performance in SAP Hybris Cloud for Customer (C4C). It also describes the various performance metric attributes and provides link(s) on what to do next.
|
Basic Analysis
How-To: View performance statistics of the last user interaction How-To: Troubleshoot Cold Browsers How-To: How to identify latency and bandwidth issues Information required by SAP when submitting performance incidents
|
Performance Updates
1802: https://blogs.sap.com/2018/02/15/1805-performance-update/
1711: https://blogs.sap.com/2017/10/22/whats-new-in-c4c-performance-1711-edition/
1708: Performance improvements include request payload compression and faster loading of static assets wit...
1705: Enhancements include reduce cold starts wrt. implicit personalization, update of newer SAP UI ...
1702: Enhancements include improvements in server times, mobile offline, TTI, pre-fetch of UI floorp...
Performance Best Practices
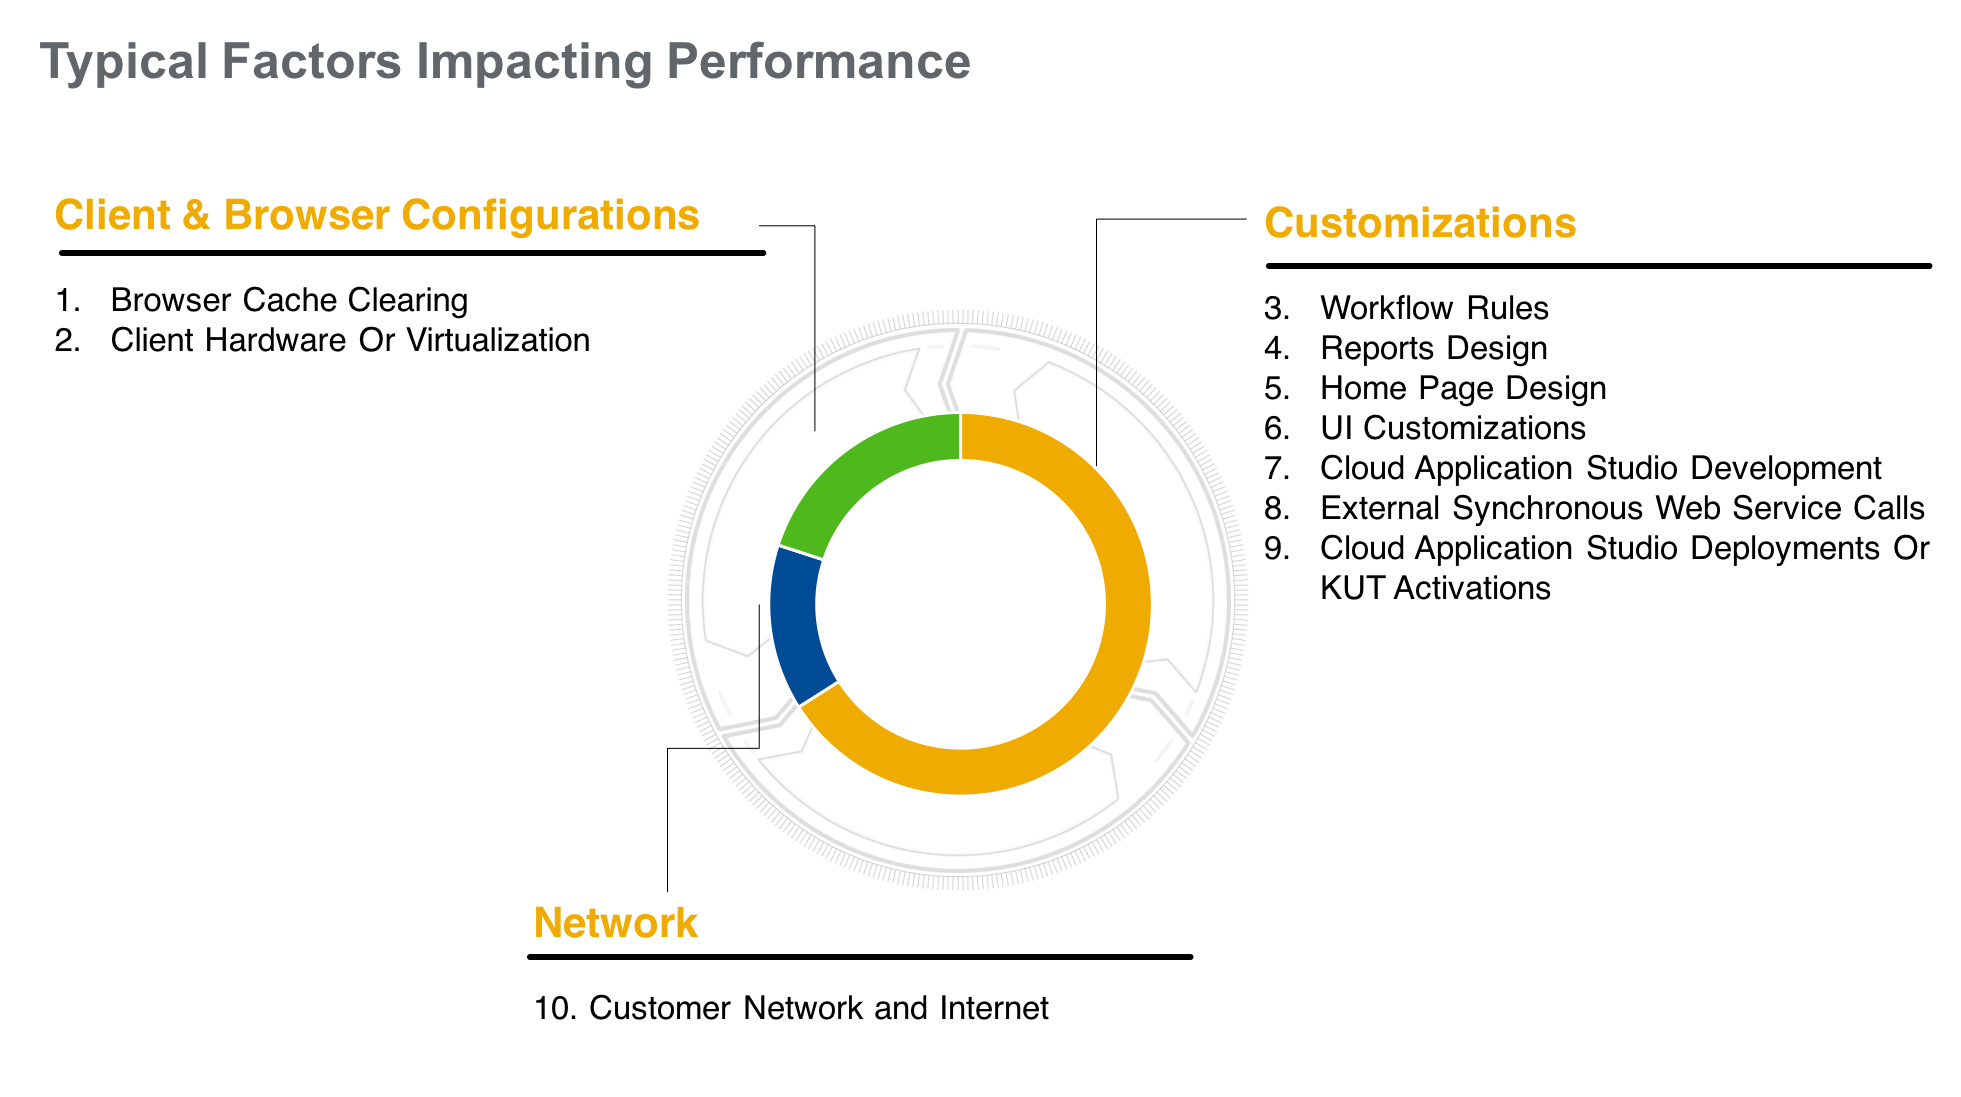
| #1 Browser Cache Clearing | ||
 When a users browser has to fetch static content (C4C UI-floorplans, images, JS etc) from the server, the end to end response times could be 4-5x or more slower than normal. During the "warming" process, whenever a user visits the workcenters/screens the static content on that page is cached. Normal these cached objects will stay as long as a year until the cache gets "dirty" or invalidated. This can happen after a hotfix or an upgrade. However, explicitly deleting the cache can have detrimental affect on the end to end performance. Therefore if you have enabled settings in the browser that restricts or clears the cache then could get significantly slower response times. This also represents a cold browser interaction and can be monitored from the in-tenant reports. Please check the "identifying and troubleshooting" sections for more details. | ||
| #2 Client Hardware or Virtualization | ||
Client hardware such as the processor and the amount of memory available can be a significant factor in performance. Slow disk systems can also slow down the client as static assets are retrieved from the browser are not rendered quickly. When working in virtualized environments such as Citrix, please make sure that sufficient resources such as disk space are allocated for the users. If browser cache is set to delete on logoff then each time the user logs in, there will be significant slowdown. In browser dev tool, this can easily be detected by long SEND times or BLOCKED states. | ||
| #3 Workflow Rules | ||
Workflow rules can add to the server time if you have too many of them or you have written logic that adds quite a bit of overhead. Also, workflow rules with timing set to "On Create/On Every Create" are triggered synchronously and blocks the UI until the logic finishes running. Workflow time can be monitored by check the "workflow time" in the performance historical data. For more details please see the server section in the "identifying and troubleshooting" guide below. | ||
| #4 Reports Design | ||
| The design of a a report plays an important role. Reports are significantly impacted by the way data source and/or reports are modeled. All the rules for good SQL applies here. If you make outer joins on a field which has a large number of entries then your reports performance can get slow. There are several best practices rules in the "identifying and troubleshooting" guide below. | ||
| #5 Home Page Design | ||
| As of 1602, the home page design alerts you with a warning if you have too many tiles and reports on the home page. Also, please make sure if you really need the home page as the landing page since this can cause a long login process. Please refer to the"identifying and troubleshooting" guide below. | ||
| #6 UI Customizations | ||
| When customizations are made to the UI screens, additional roundtrips could be triggered. Although many components are now loaded asynchronously there are some which still loads synchronously and this can cause slowness. | ||
| #7 Cloud Application Development Studio (PDI) | ||
| The best place to check for best practices recommendations here is to check the "Solution Diagnostics" tool under the Administrator workcenter, in the system administration section. Here you would find valuable feedback in your PDI implementation. Also please check the "identifying and troubleshooting" guide below. | ||
| #8 External Synchronous Web Service Calls | ||
| Synchronous web service that invoke external business systems can add an overhead if the providing business system is slow. Monitoring the WS Time in the performance historical data is a good practice. Please use tools such as SOAP UI etc to determine the performance of the external web service. | ||
| #9 Cloud Application Studio Deployments or KUT Activations | ||
| Cloud SDK deployments and KUT activations can invalidate the cache. Therefore a new copy has to be retrieved over the network slowing down performance. As of 1702, UI-floorplan metadata is pre-fetched during login process. Therefore a good practice is to activate KUT changelists via content transfer during off business hours. Therefore please follow best practices for deploying the same. More information is available in the "identifying and troubleshooting" guide below. | ||
| #10 Customer Network and the Internet | ||
Network plays a very important part in performance. Latency & bandwidth are two important aspects in getting a good end to end response. In the customer's environment, landscape components such as proxy, web filtering etc can play an important role as well. Also internet conditions keeps changing therefore tools such as browser dev tools, traceroute etc can be very handy in troubleshooting the same. Your best friend here is the in-tenant diagnostics tool accessible by url.
|
Best Practices Video
Link to Presentation (slide#10 onwards) describes Top 10 best practices
Identifying and Troubleshooting Performance Issues
The following blogs and links provide helpful links in understanding, troubleshooting and following best practices in performance.
How to take HTTP Traces using browser DevTools
Best viewed in full screen
Cloud for Service Performance Best Practices
Optimize the performance of your Cloud for Service implementation
(Link) Part 1
In customer service every second matters. Angry customers don’t like to wait, and agents must to be able to address their questions promptly. In order to deliver great customer service, agents should be supported by a well tuned system, optimized to provide the best experience with minimal response times
(Link) Part 2
Customer Service agents are constantly working on a ticket after the other. The time it takes for the ticket UI to open, and the time it takes to save a ticket after a change, are usually the two most important factors in determining the performance experienced by agents. We will review several ways to optimize the Save step in Part 2. In this section, let’s review a few ways in which you can optimize the time to Open.
For questions and suggestions please leave a comment ?
- SAP Managed Tags:
- SAP Cloud for Customer add-ins,
- C4C Extensibility,
- C4C Sales,
- C4C Service,
- Cloud
Labels:
16 Comments
You must be a registered user to add a comment. If you've already registered, sign in. Otherwise, register and sign in.
Labels in this area
-
Business Trends
270 -
Business Trends
11 -
chitchat
1 -
customerexperience
1 -
Event Information
256 -
Event Information
18 -
Expert Insights
30 -
Expert Insights
51 -
Life at SAP
133 -
Life at SAP
1 -
Product Updates
666 -
Product Updates
24 -
SAP HANA Service
1 -
SAPHANACloud
1 -
SAPHANAService
1 -
Technology Updates
453 -
Technology Updates
15
Related Content
- Working with SAFe Epics in the SAP Activate Discover phase in CRM and CX Blogs by SAP
- SAP Commerce Best Practices for Performance in CRM and CX Blogs by SAP
- SAP Commerce Cloud Q1 ‘24 Release Highlights in CRM and CX Blogs by SAP
- Unlock the Power of AI with Intelligent Selling Services for SAP Commerce Cloud in CRM and CX Blogs by SAP
- Maximize Results and Drive Sustainability in Fashion Retail with SAP and GK AIR Dynamic Pricing in CRM and CX Questions
Top kudoed authors
| User | Count |
|---|---|
| 5 | |
| 2 | |
| 2 | |
| 2 | |
| 2 | |
| 1 | |
| 1 | |
| 1 | |
| 1 | |
| 1 |