
- SAP Community
- Products and Technology
- Technology
- Technology Blogs by SAP
- Explore Networks using SAP HANA and Cytoscape
Technology Blogs by SAP
Learn how to extend and personalize SAP applications. Follow the SAP technology blog for insights into SAP BTP, ABAP, SAP Analytics Cloud, SAP HANA, and more.
Turn on suggestions
Auto-suggest helps you quickly narrow down your search results by suggesting possible matches as you type.
Showing results for
Product and Topic Expert
Options
- Subscribe to RSS Feed
- Mark as New
- Mark as Read
- Bookmark
- Subscribe
- Printer Friendly Page
- Report Inappropriate Content
09-22-2021
4:25 PM

Recently, my family was out for a couple of days, which gave me time to kick start a little spare-time project: An SAP HANA plugin for the open source network analysis client Cytoscape.
(Time feels infinite when 4 kids leave the house - so this ended up being a few thousand lines of code)
The plugin shall provide basic connectivity between Cytoscape and Graph Workspaces in SAP HANA. Even with only basic connectivity, users will immediately gain advantages when working with the plugin:
- Cytoscape provides an easy-to-use rich client to visualise, explore and understand network/graph data. With a few clicks, you can visually explore graph data stored in SAP HANA.
- Cytoscape integrates with a variety of network data formats (e.g. GraphML, SIF, GML and many more) and also has import wizards for general purpose file formats such as CSV or Excel. The plugin enables the user to use the available file formats for importing and exporting graph workspaces from SAP HANA.
- Cytoscape offers out-of-the-box integration with public network databases such as NDEx. The user can load data from those sources right into SAP HANA without even leaving the Cytoscape client.
Due to the history of Cytoscape, the focus of the application and also the connected public databases is mostly on biological research use cases. However, from a technology perspective the client is perfectly suitable for almost any general network analytics use case.
Now, let's go through a small roundtrip of uploading network data to SAP HANA, visualising it in the Cytoscape client and exporting it with a different format. You can follow the steps of the blog with an SAP HANA Cloud Trial instance, which is including the graph engine without any functional restriction.
I will assume that you already have the database instance setup. If this is not yet the case, you may revisit these tutorials to get up to speed.
Install Cytoscape and the SAP HANA Plugin
Get the most recent version of the Cytoscape client from the download page. Cytoscape is a Java application with installers for Mac, Windows and Linux. Just follow the steps of the installer.
Once Cytoscape has been installed, we need to do two more things to enable support for SAP HANA: Install the SAP HANA JDBC client and install the SAP HANA plugin for Cytoscape itself.
Installing the SAP HANA JDBC client
- Download the latest JDBC client jar from SAP Development Tools.
- Copy the file (i.e. ngdbc-xxx.jar) to:
<Cytoscape Installation Path>/framework/lib/openjfx/<Your Platform>

Example location for JDBC client on macOS
Installing the SAP HANA plugin for Cytoscape
The latest version of the SAP HANA plugin for Cytoscape can be found on the project's GitHub repository. This version is automatically built from the latest commit and should be considered "the bleeding edge" of development. This is a beta version and there are no stable releases.
- Navigate to https://github.com/mkemeter/cyHANA
- On the right hand side (or the packages section) click on the package "org.kemeter.cyhana"

- Again on the right hand side, choose the latest jar file for download from the assets section (just ignore all the other file endings).

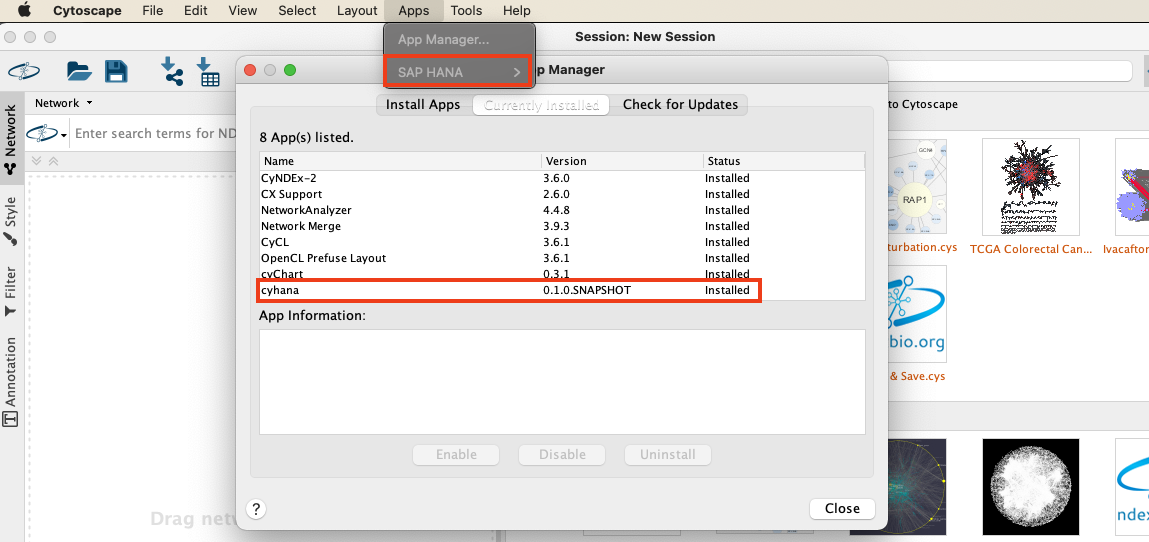
- This jar can easily be installed using the Cytoscape client. Open the client and from the menu choose "Apps > App Manager > Install from File"

- In the following dialog choose the jar file, that you have downloaded from GitHub.
- You should see the plugin in the list of installed plugins and the submenu "SAP HANA" has appeared as part of the App menu.
You are now ready to start with the fun part!
Load Network Data into Cytoscape
Let's start with an example dataset. The easiest approach would probably be to use a dataset from the NDEx database (in Cytoscape: File > Import > Network from NDEx). However, the typical datasets available there are not light fare. Thus, I would like to start with a more easy-going dataset.
The one I found on Kaggle is a network dataset originating from meetup.com. It describes physical meetups of certain interest groups within the Nashville area. After creating a Kaggle account, you can download the dataset here:
https://www.kaggle.com/stkbailey/nashville-meetup
The portion of the network, that we will be interested in, are the interest groups itself and the relation between those interest groups. In our case, two groups are "related" to one another if the same participant is part of both groups. The weight of the relation (or edge) is defined by the total number of participants, which are part of the two groups.
In the archive we downloaded, we are only interested in two of the files:
- meta-groups.csv
Information for each group, including name and category. The primary key is group_id. - group-edges.csv
Edge list for constructing a group-to-group graph. The weight column represents shared members between groups.
To construct the basic network in Cytoscape, we start with group-edges.csv:
- In Cytoscape choose File > Import > Network from File.
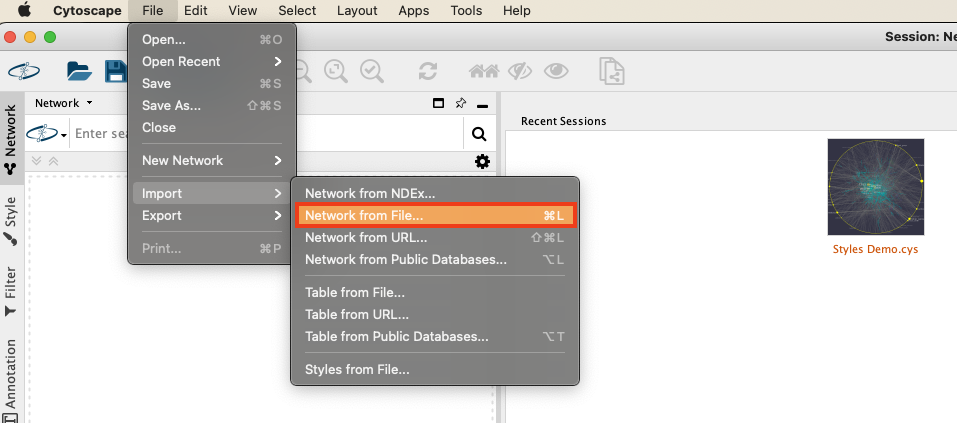
- In the following dialog open group-edges.csv.
- Now we need to add some semantics to the columns in the file. Use the drop-down next to the column header to define group1 as a source node (green dot) and group2 as a target node (orange circle).

- After confirming, the column header icons will change accordingly. If the result looks similar to the picture below, confirm with OK to load the network into the client.

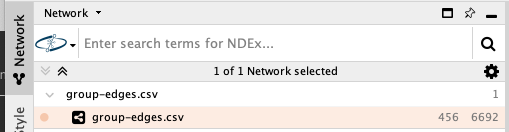
- You have constructed a basic network with 456 nodes and 6692 edges. Also the client will create a first visualization, which we will ignore for the moment.
When looking closer at what you have just created in Cytoscape, you will notice that the node table in the lower right corner is pretty empty when it comes to its attributes:
![]()
Since we only uploaded the edge list and not the group metadata, Cytoscape generated one node per source or target id in the edge file. Since there is not more known, than the id itself it has become the only attribute in the nodes table.
Luckily the file meta-groups.csv contains all the context information about the nodes (i.e. groups) in our graph linked by their respective id. We can enrich the graph with metadata as follows:
- Drag'n'drop the file meta-groups.csv onto the node table view shown above.
- The import dialog will open up. The proposed import configuration is just fine. Note, that group_id has already been marked as a key field.
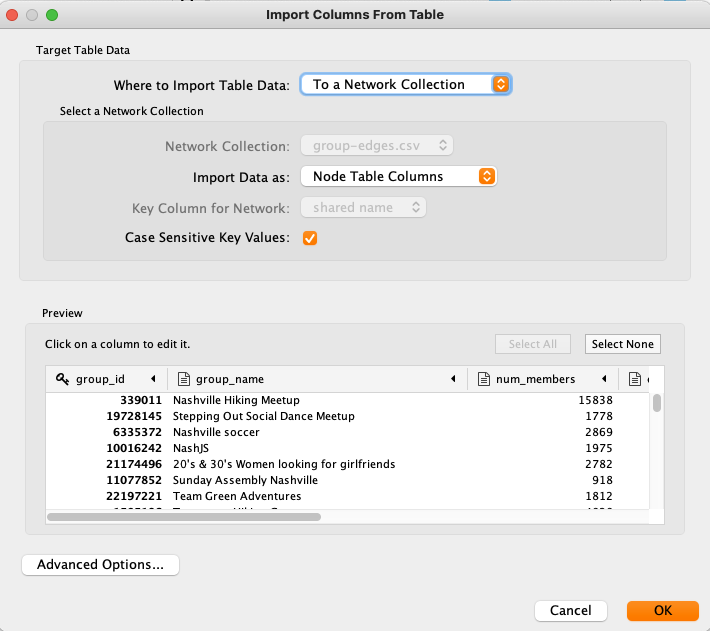
- After confirming the dialog with OK, you will notice that the node table has been enriched with the imported metadata.

You have successfully loaded a network into the Cytoscape client!
Upload Network Data to SAP HANA
Now, let's upload the newly created network to SAP HANA using the previously installed plugin. Before we can interact with our SAP HANA instance, we first need to establish a connection.
The SAP HANA plugin for Cytoscape can be found in menu Apps > SAP HANA.
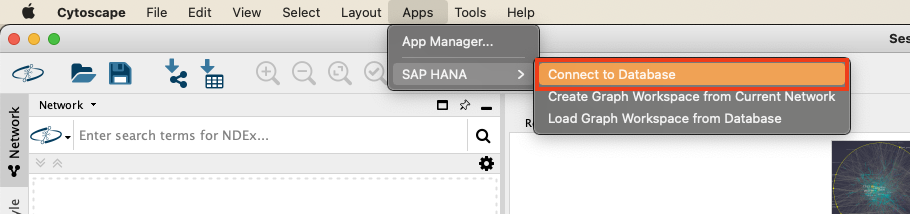
Connecting to SAP HANA
Choose Connect to Database and enter your connection credentials in the following dialog. The dialog will always pre-populate the last used credentials. Except for the password, which is dependent on dialog configuration.

- Host
The host address of your SAP HANA or SAP HANA Cloud instance - Port
The port for SQL connections. For SAP HANA Cloud, this will typically be port 443. - Username
The database user. It is recommended that this user has authorisation to create a new schema as the plugin offers this option when uploading a network to SAP HANA. - Password
The password of the respective database user. - Save Password
If checked the password will be saved in a text file in the user folder. Please note, that it will be saved as plain text! - Auto-Connect from Cache
Typically, the user needs to explicitly "Connect to Database" whenever restarting the Cytoscape client. Auto-Connect can only be used in case the password has been saved. In this case the plugin will try to use the saved credentials to automatically connect whenever a database operation is executed. The user then does not have to explicitly "Connect to Database" after restarting Cytoscape.
After confirming the connection with OK, you can check Cytoscape's task history to confirm, that the connection attempt has been successful.

Creating a new Network in SAP HANA
I am assuming, that you still have the meetup.com network open in the client.

Choose "Apps > SAP HANA > Create Graph Workspace from Current Network" to initiate the upload. You will be presented with the compact view on the upload dialog.

The compact view gives you the ability to define target schema and target name of the new graph workspace. Note, that you can unfold the section "New Tables" on the bottom of the dialog. Also, in Cytoscape you may have multiple networks open at the same time. The full dialog with all fields will look the following:

- Network
You will see this dropdown field in case you have more than one network present in the Cytoscape client. Use this field to determine wich of the networks shall be uploaded. The field is hidden, if there is only one network. - Schema
The target schema on the database. - Name
The desired name of the graph workspace on the database. The field will be pre-populated with the network name in Cytoscape (e.g. group-edges.csv) and can be changed to any suitable value (e.g. meetup-groups). Note, that existing graph workspaces will not be overwritten. Choosing an existing workspace will result in an upload failure. - Create Schema
If checked and the target schema is not existing, the schema will be created. Note, that the database user needs to have permission to create new schemas. - Node Table
The name of the new node table. Will be pre-populated with <Workspace Name>_NODES. Note, that existing tables will not be overwritten. Choosing an existing table will result in an upload failure. - Edge Table
The name of the new edge table. Will be pre-populated with <Workspace Name>_EDGES. Note, that existing tables will not be overwritten. Choosing an existing table will result in an upload failure.
In our case, I have used the compact upload dialog and just changed the workspace name from group-edges.csv to meetup-groups and - of course - confirmed the upload with OK. Again, you can use the task history to verify that the upload went smoothly.
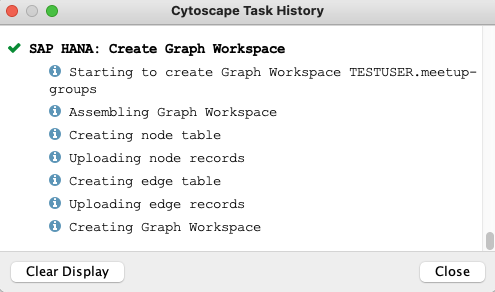
If you still cannot believe, that it was THAT easy to create your first graph workspace in SAP HANA (Cloud), you can double check in your database client, that the node, the edges table and the new graph workspace are existing. The following statement should return an entry for WORKSPACE_NAME = 'meetup-groups'.
SELECT * FROM GRAPH_WORKSPACESYou can also query GRAPH_WORKSPACE_COLUMNS to retrieve the metadata (i.e. node and edge tables) associated with the workspace.
SELECT * FROM GRAPH_WORKSPACE_COLUMNS WHERE WORKSPACE_NAME LIKE 'meetup-groups'
You have uploaded a network to SAP HANA and created the corresponding graph workspace to do in-database graph processing!
Visualize Data from SAP HANA in Cytoscape
So far, you have loaded a text file representation of a network into the Cytoscape client and uploaded this network to SAP HANA. To make the roundtrip complete, we would like to load this network (name 'meetup-groups') back into the client.
To start on a green field, please close the Cytoscape client an open it again. The list of networks should be empty in the client.
Downloading Graph Workspace from SAP HANA
Have you checked "Save Password" and "Auto-Connect from Cache" when previously establishing the connection to SAP HANA?
- If yes, you can head straight to the plugin menu and select "Load Graph Workspace from Database".
- If no, you will first have to establish the connection to the database by selecting "Connect to Database" from the plugin menu. Afterwards, you should select "Load Graph Workspace from Database".

The following dialog is very simple. It shows one dropdown box containing all graph workspaces, that have been found on the respective system. If this list is very long, you may start typing text into the field to search within the name of the listed workspaces.

- Schema/Name
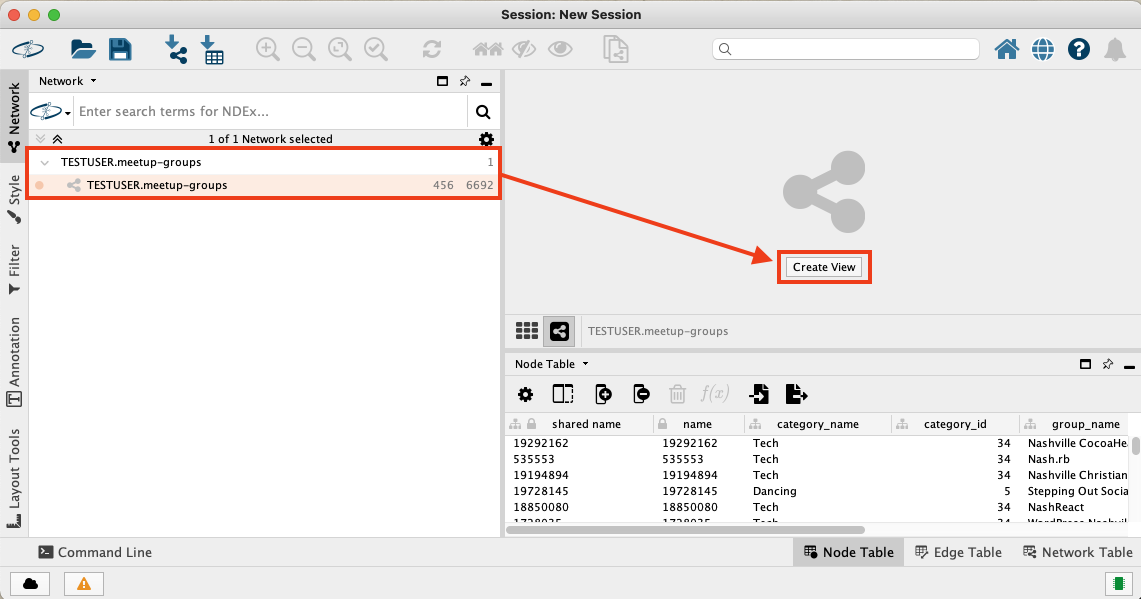
A selection field containing all graph workspaces, that have been found on the connected SAP HANA system. The naming scheme is <Schema Name>.<Workspace Name>.
After confirming the dialog with OK, the graph workspace gets downloaded back into the Cytoscape client. Click the "Create View" button to generate a basic visualisation of the network.
Improving the Network Visualisation in Cytoscape
The automatically generated visualisation does not make it easier for us to generate insights out of the graph. Note that it does offer panning, zooming and selecting nodes and edges to start some exploratory analysis. Also the layout can be changed by moving around nodes.

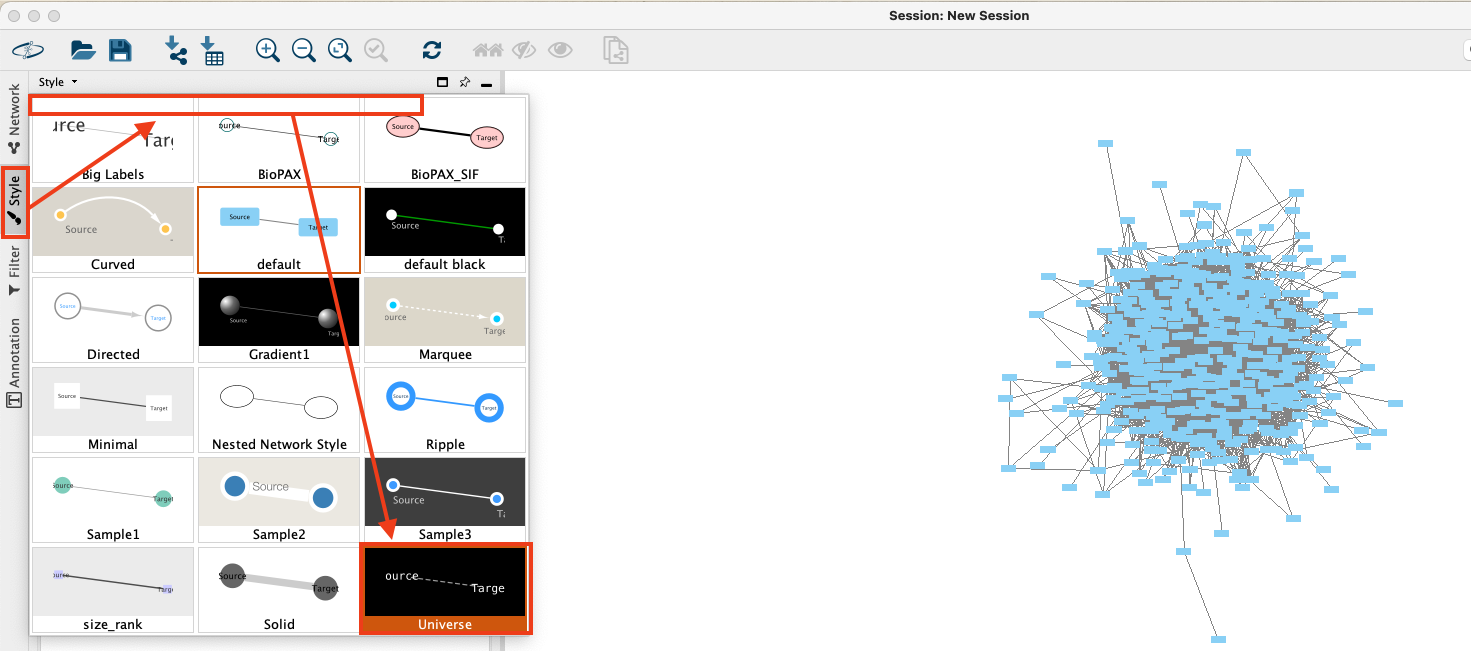
Let's apply a couple of changes to the visualisation to make some key aspects of the network easier to consume:
- Apply a different predefined style: Unfold the styling panel by clicking "Style" on the left hand side. Unfold the dropdown field at the top of the panel to list the available pre-defined styles. Choose style "Universe".
- Change the node labels: When you zoom close enough, you will notice that the nodes of the graph are labelled with their technical id. To show the name of the meetup group instead, make sure to stay on the styling panel, select the "Node" style at the bottom of the panel and change the "Label" column to "group_name".

- Install an advanced layout plugin: In the application's layout menu, there are already plenty of pre-defined layout algorithms. We would like to use the yFiles Layout Algorithms for Cytoscape and need to install this commonly used plugin first. The "Layout" menu offers the installation out-of-the box: Just click "Install yFiles Organic Layout" and click "Install" on the following web page.

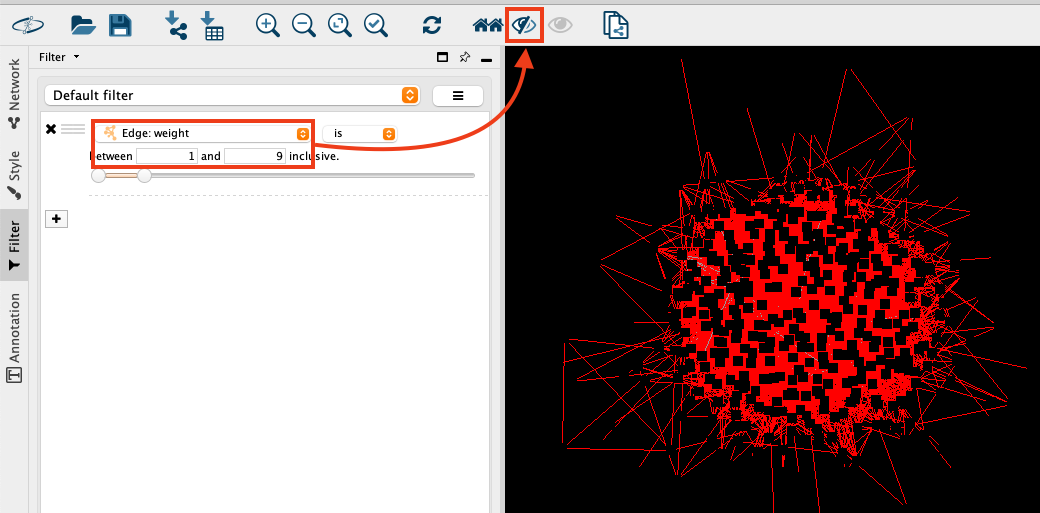
- Hide low-weight edges: The graph itself is pretty noisy since edge connections between groups are also drawn if there is just one group member in common (weight = 1). Let's visualise only edges for groups with at least 10 members in common before we continue with the layout.On the left side, open the filter panel and add a column filter.

Choose the column "Edge: weight" and select the values between 1 and 9. The selected edges will be marked in red in the network visualisation. Choose the button "Hide selected nodes and edges" to remove them from the visualisation and make the graph less crowded.
- Change the layout of the graph: From the layout menu choose "yFiles Organic Layout", which you have installed previously, to change the layout of the graph.
- Decrease density of the graph: Let's be honest. The result doesn't look promising so far. The reason is mainly that the graph is too dense and the labels are too large, so that they overlap. To change this, open the "Layout Tools" panel on the lower left corner of the screen and move the Scale slider from 1 to 4.

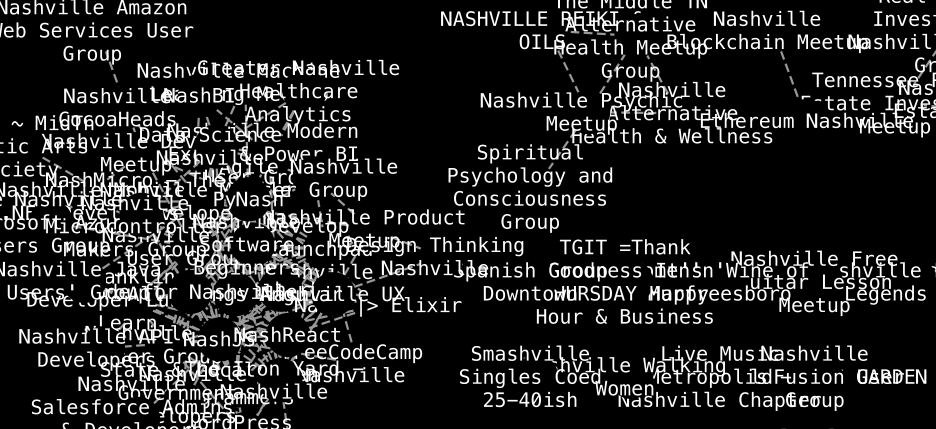
The result (to which I additionally applied a rotation using the layout tools), looks way easier to consume.

Just from looking at the new visualisation, you can immediately add some semantic to the visual clusters. This way, you can analyse the interaction between the interest groups for leisure, business, tech and spiritual topics.

You have learnt how to adapt your visualisation in order to better explore the relations of the network.
Export Data as GraphML
Last but not least let's use Cytoscape to export the graph, that we have just loaded from SAP HANA, to a common graph file exchange format.
Select your network and navigate to File > Export > Network to File in the Cytoscape client.

In the following dialog choose the GraphML format and a proper target location for the file.
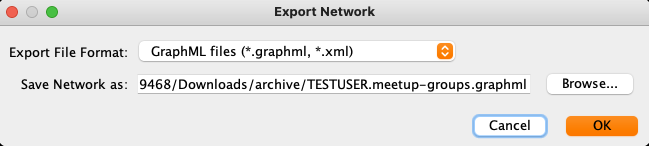
Just click OK and you are done.
The resulting GraphML file can be opened by other clients or used to exchange the data.
Summary & What's Next
Today, you have learnt how to create a graph workspace on SAP HANA using the Cytoscape client. The SAP HANA plugin for Cytoscape enables you to connect commonly used graph exchange formats with SAP HANA - both for import and export of data. Furthermore, the open source client offers a rich feature set in styling and exploring your graph.
So why would you need SAP HANA at all? Of course, the visualisation above is a pure client side feature and the underlying data management platform does not play any role. It must be clear, that the roundtrip depicted in this blog is a technical example, on how to connect a graph workspace in SAP HANA to Cytoscape. In a real-world scenario the graph workspace in SAP HANA is closely related to your business data (think of supply chain scenario as an example) and you would use in-database graph processing to enable your business processes with network insights.
If you are looking for some material on how to generate further network insights on the database level, I strongly recommend checking some blogs of my colleague markus.fath:
- Know Your Dependencies - Network Tracing with SAP HANA Graph
- Mapping Risk in a Stormwater Network using SAP HANA Spatial and Graph
- Calculating Isochrones using SAP HANA Graph and Spatial
Meanwhile, my family is back from their short vacation and it feels that my spare-time has reduced to minus infinity. In future, I may transform this small project into an official SAP open source project to find more time to keep working on it and make it available on the Cytoscape App Store (there is actually nothing to buy!).
Needless to say: Since this is open source, you are invited to contribute! Cytoscape has a really well-documented developer onboarding and the full source code of the SAP HANA plugin for Cytoscape can be found on GitHub.
I am awaiting your pull request!
- SAP Managed Tags:
- SAP HANA Cloud,
- SAP HANA Cloud, SAP HANA database,
- Open Source,
- SAP HANA,
- SAP HANA Graph,
- SAP HANA multi-model processing
Labels:
1 Comment
You must be a registered user to add a comment. If you've already registered, sign in. Otherwise, register and sign in.
Labels in this area
-
ABAP CDS Views - CDC (Change Data Capture)
2 -
AI
1 -
Analyze Workload Data
1 -
BTP
1 -
Business and IT Integration
2 -
Business application stu
1 -
Business Technology Platform
1 -
Business Trends
1,661 -
Business Trends
87 -
CAP
1 -
cf
1 -
Cloud Foundry
1 -
Confluent
1 -
Customer COE Basics and Fundamentals
1 -
Customer COE Latest and Greatest
3 -
Customer Data Browser app
1 -
Data Analysis Tool
1 -
data migration
1 -
data transfer
1 -
Datasphere
2 -
Event Information
1,400 -
Event Information
64 -
Expert
1 -
Expert Insights
178 -
Expert Insights
273 -
General
1 -
Google cloud
1 -
Google Next'24
1 -
Kafka
1 -
Life at SAP
784 -
Life at SAP
11 -
Migrate your Data App
1 -
MTA
1 -
Network Performance Analysis
1 -
NodeJS
1 -
PDF
1 -
POC
1 -
Product Updates
4,577 -
Product Updates
325 -
Replication Flow
1 -
RisewithSAP
1 -
SAP BTP
1 -
SAP BTP Cloud Foundry
1 -
SAP Cloud ALM
1 -
SAP Cloud Application Programming Model
1 -
SAP Datasphere
2 -
SAP S4HANA Cloud
1 -
SAP S4HANA Migration Cockpit
1 -
Technology Updates
6,886 -
Technology Updates
403 -
Workload Fluctuations
1
Related Content
- Demystifying Transformers and Embeddings: Some GenAI Concepts in Technology Blogs by SAP
- Highlights from DSAG's SAP ALM Thementage Stuttgart 2024 and Technology Days Hamburg 2024 in Technology Blogs by SAP
- Graph intro series, part 1: Introduction to Graph in SAP Integration Suite in Technology Blogs by SAP
- AN INTRODUCTION TO QUADRATIC UNCONSTRAINED BINARY OPTIMIZATION (QUBO) in Technology Blogs by SAP
- As of Feb 19, 2024, the SAP Datasphere Content Documentation has moved to the SAP Help Portal in Technology Blogs by Members
Top kudoed authors
| User | Count |
|---|---|
| 12 | |
| 10 | |
| 9 | |
| 7 | |
| 7 | |
| 7 | |
| 6 | |
| 6 | |
| 5 | |
| 4 |