In the next blog Rob Case (rob.case@sap.com) explains how to consume an HANA Rules Framework rules' results with (prerequisites are described in Visualizing SAP HRF Rule Results in SAP Lumira - Part 1)...
SAP Lumira Desktop Preparation and Presentation
Data Source
The first thing to understand is that SAP Lumira cannot be directly connected to the SAP HRF column view “SAP_HRF”.“sap.demo-store.sales.resources ::Sales Analysis.VIEW”. The SAP Lumira data source must be a cube such as those created by an Analytic View or a Calculation View. I therefore need to build one of these against my rule service column view.
As I want to make my SAP Lumira presentation more appealing I elect to create a data set based upon more than just the result data obtained from the SAP HRF column view. I will join the content of the view to my existing SALES_QTY table data so that I can show time series analysis in my SAP Lumira chart.
The following script allows me to join the table and view on column “product_id” and I also take the opportunity to add the average of actual product quantity sold available from one of the outputs of my rule into the new calculation view.
Calculation View SALES_VIEW
This is the content of the Script_View scenario
/********* Begin Procedure Script ************/
BEGIN
var_out = SELECT
SQ."id",
SQ."product_id",
SQ."description",
SQ."sales_month",
SQ."budget_qty",
SQ."actual_qty",
SA."AVG_Actual_Quantity" as "avg_actual_qty"
FROM
"SAP_SALES"."sap.demo-store.sales.model::SALES_QTY" SQ,
"SAP_HRF"."sap.demo-store.sales.resources::Sales Analysis.VIEW" SA
where SQ."product_id" = SA."product_id";
END /********* End Procedure Script ************/
On the “View Properties” tab in the Semantic Scenario I make sure that SALES_VIEW has a data category of CUBE.

Having activated SALES_VIEW I can create it as a data source in SAP Lumira. A Data Preview provides the following data

SAP Lumira Add New Dataset
Once I have connected to the HANA server where SAP HRF is installed I can see the SALES VIEW data set

SAP Lumira Visualize Tab
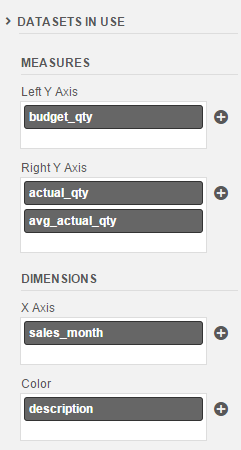
I decide to create a Combined Column Line Chart with 2 Y-Axes:
- I add the budget_qty measure as the Left Y Axis
- I add the actual qty and avg_actual_qty measures as the Right Y Axis
- I add sales_month as the X Axis dimension
- I add description as the Y Axis dimension
- I filter sales month so that only October, November and December data is present so that Q4 is represented
This generates the following combination chart for my data source:

At this point I could go on to compose an SAP Lumira story but that is beyond the scope I wish to cover here.
The one item I have left to do is to show how changing an SAP HRF rule condition or output content can be reflected in my SAP Lumira data source.
SAP HANA Rules Framework Modifications
In the SAP HRF Fiori UI, I edit my “Sales Below Budget” rule and change the condition to provide average values across both November and December. I then activate the rule

A Data Preview of my SALES_VIEW calculation view shows new results that have occurred due to the rule change. The SAP HRF column view “SAP_HRF”.“sap.demo-store.sales.resources ::Sales Analysis.VIEW” is updated immediately the rule activation takes place.

We can see from the data above that the average actual quantity for Boots sold through November and December exceeded the budgeted average quantity for the same time period. Now that only Shoes and Trainers evaluate to true in the rule condition Boots no longer appear in the results.
SAP Lumira Visualize Tab
When I refresh my SAP Lumira chart the new data is reflected in my chart - Shoes and Trainers become the only relevant products:

