
- SAP Community
- Products and Technology
- Technology
- Technology Blogs by SAP
- Optimizing DMO Performance
Technology Blogs by SAP
Learn how to extend and personalize SAP applications. Follow the SAP technology blog for insights into SAP BTP, ABAP, SAP Analytics Cloud, SAP HANA, and more.
Turn on suggestions
Auto-suggest helps you quickly narrow down your search results by suggesting possible matches as you type.
Showing results for
former_member19
Explorer
Options
- Subscribe to RSS Feed
- Mark as New
- Mark as Read
- Bookmark
- Subscribe
- Printer Friendly Page
- Report Inappropriate Content
12-15-2015
8:01 PM
When migrating an existing SAP system to the SAP HANA database using SUM with database migration option (DMO), several ways exist to optimize the performance and reduce the downtime.
This blog covers the topics benchmarking, optimization and analysis step-by-step. Therefore you should read and follow the steps in sequence
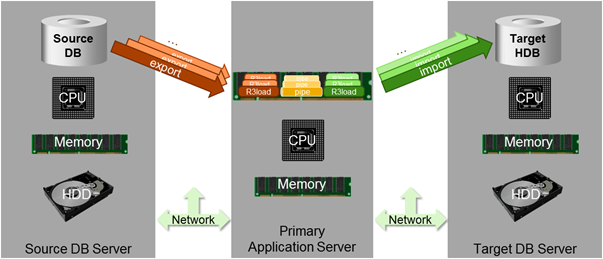
The following graphic gives you an overview of the migration process and will be used below to visualize the performance optimization options.
Optimizing the standard DMO performance
Preparation steps
The DMO uses tables from the nametab. Therefore it is recommended to clean up the nametab before starting a DMO run. Proceed as follows:
1.) Start transaction DB02 (Tables and Indexes Monitor) and choose “Missing tables and Indexes”
2.) Resolve any detected inconsistencies

If you do not perform this step, the DMO run may stop with warnings in the roadmap step “Preparation”.
Benchmarking Tool
Before you start a complete DMO test run, we highly recommend using the benchmarking tool to evaluate the migration rate for your system, to find the optimal number of R3load processes and to optimize the table splitting.
Start the benchmarking mode with the following addresses:
http://<hostname>:1128/lmsl/migtool/<sid>/doc/sluigui
or
https://<hostname>:1129/lmsl/migtool/<sid>/doc/sluigui
This opens the following dialog box:

Benchmark Export
Use this option when you want to simulate the export of data from the source system.
Proceed as follows in the dialog box:
1.) Select the option “Benchmark migration”
2.) Select the option “Benchmark export (discarding data)”
This selection will run a benchmark of the data export and discard the data read
from the source database (source DB).
Note:
a) Always start with the benchmark of the export to test and optimize the performance of your source DB.
Since almost the complete content of the source DB needs to be migrated to the SAP HANA database, additional load is generated on the source DB, which differs from the usual database load of a productive SAP system.
This is an essential part for the performance of the DMO process, since on the one hand parts of the data is already transferred during the uptime while users are still active on the system. On the other hand the largest part of the data is transferred during the downtime. Therefore you have to optimize your source DB for the concurring read access during uptime to minimize the effect on active business users and also for the massive data transfers during the downtime to minimize the migration time.

b) Always start with a small amount of data for your first benchmarking run.
This will avoid extraordinary long runtimes and allow you to perform several iterations.
The idea behind this is that performance bottlenecks on the source DB can already be found with a short test run while more iterations are useful to verify the positive effects of source DB configuration changes on the migration performance.
However, too short runtimes should also be avoided, since the R3load processes and the database need some time at the beginning to produce stable transfer rates.
We recommend about 100GB or less than 10% of the source database size for the first run.
The ideal runtime of this export benchmark is about 1 hour.

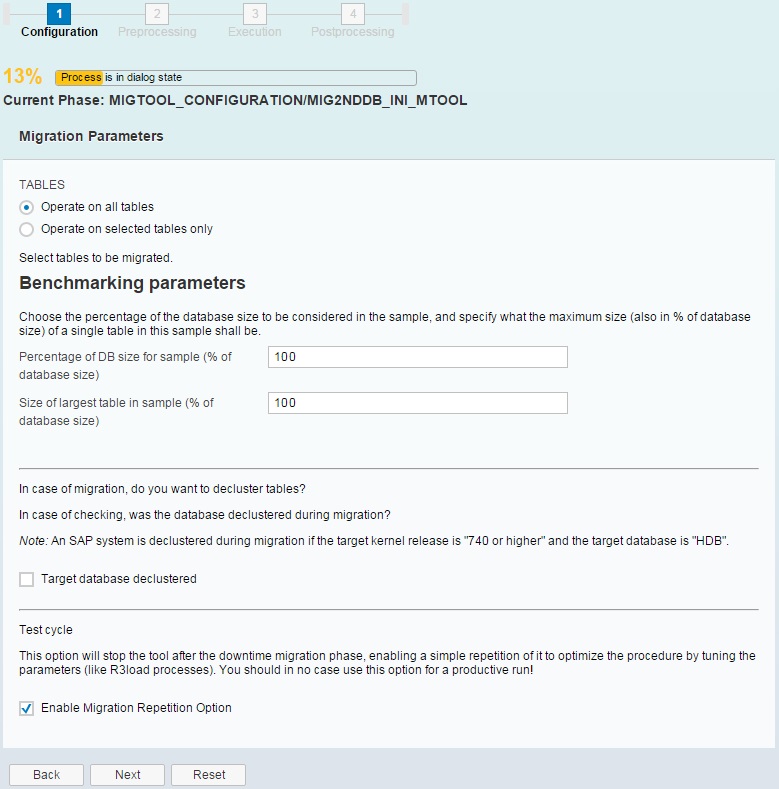
3.) Select the option „Operate on all tables“.
Define the sample size as percentage of the source database size.
- Example: your source database has a size of 1 TB, then using 10% as "percentage of DB size for sample" will result in around 100 GB size for the sample.
Define the size of the largest table in the sample as percentage of the source database size. The tool will then only consider tables for the sample which size is smaller than this percentage of the DB size.
- Example: your source database has a size of 1 TB. One of the tables <TABLE1> has a size of 15 GB. You have chosen 1 % as "Size of largest table in sample" which is equivalent to around 10 GB. The tool will then not select <TABLE1> as part of the sample because the size exceeds the given limit.
4.) Also select “Enable Migration Repetition Option”.
This option enables you to simply repeat the migration benchmark without changing the set of tables. This is especially useful for finding the optimal number or R3load processes for the migration.
5.) Define a high number of R3load processes in your first test iteration to get enough packages from the table spitting to be able to play around with the number of parallel running R3load processes later on. For detailed information of the table splitting mechanism see the blog DMO: background on table split mechanism
Use 10 times the number of CPU cores available on the SUM host (usually the Primary Application Server) as the number of R3load processes here.
The R3loads for "UPTIME" are used for the preparation (determine tables for export), the R3loads for "DOWNTIME" are used for the export (and import, if selected), so UPTIME and DOWNTIME are no indication for uptime or downtime (concerning the configuration of R3load processes).
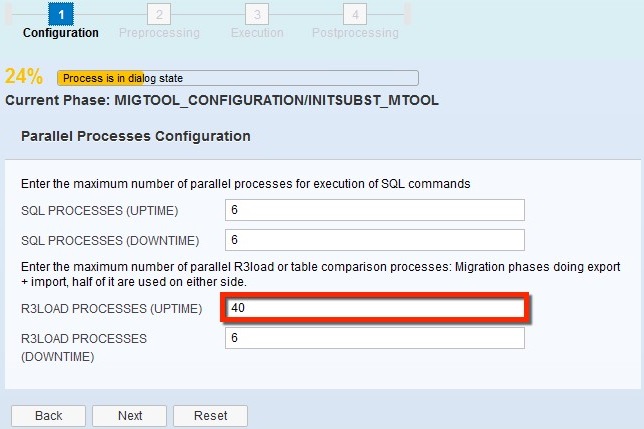

6.) Directly before starting the roadmap step “Execution”, in which the actual data migration will take place, reduce the R3load processes to 2 times the number of CPU cores available on the SUM host.
You can change the SUM process parameters during the run by means of the DMO utilities:


7.) Start the roadmap step “Execution”.
While monitoring your network traffic and CPU load, raise the number of R3load processes step by step, always waiting 10 to 15 seconds until they are started.
When either the CPU load or the network traffic reach 80% to 90%, you have found the optimal number of R3load processes for this system landscape.
8.) If you repeat the benchmarking run, avoid database caching.
This can either be realized by flushing the cache or by restarting the database.
If you want to change the table set, finish the current benchmarking run and start the test from the beginning. To avoid database caching, you can also select bigger tables that exceed the database cache.
Benchmark Export + Import
Use this option when you want to simulate the export of data from the source system and the import of data into the target system.
After you have executed at least one export benchmark, you can continue with benchmarking the migration export and import in combination. In this way you can find out if your target SAP HANA database is already running at peak performance or if it needs to be optimized for the mass import of migrated data.
The behavior of this combined benchmark is very similar to a real migration run since the exported data is really imported into the target HANA database. Only after a manual confirmation at the end of the migration benchmark the temporarily created database schema is dropped from the target HANA database.
Proceed as follows in the dialog box:
1.) Select the option “Benchmark migration”
2.) Select the option “Benchmark export and import”

Automatically optimize Table Splitting
1.) Perform a benchmark migration of the whole database to generate a durations file, which contains the migration runtimes of the most significant tables.
Set the percentage of the DB size as well as the size of the largest tables to 100% and enable the “Migration Repetition Option”.
On the process configuration screen, input the optimal number of R3load processes, identified beforehand.
2.) Repeat the migration phase to run the full migration benchmark again.
This time the benchmarking tool makes use of the durations file from the first full run to automatically optimize the table splitting, which should result in a shorter overall migration runtime.

Analysis
After a complete migration run, you can analyze the migrated data volume and the migration speed.
The SUM creates a summary at the end of the file ../SUM/abap/log/EUMIGRATERUN*.LOG:
Total import time: 234:30:20, maximum run time: 2:31:41.
Total export time: 222:31:49, maximum run time: 2:31:42.
Average exp/imp/total load: 82.0/87.0/168.9 of 220 processes.
Summary (export+import): time elapsed 2:41:40, total size 786155 MB, 81.05 MB/sec (291.77 GB/hour).
Date & Time: 20150803161808
Upgrade phase “EU_CLONE_RUN” completed successfully (“20150803161808”)
In this example
- 220 R3load processes have been used (110 Export, 110 Import)
- the downtime migration phase took 2 hours 41 minutes
- total migration data volume was: 786155 MB (786 GB)
- migration speed was: 81 MB/s (291 GB/h)
- the migration phase ended without issues: “completed successfully”
In general, a good migration speed is above 300 GB per hour.
R3load Utilization
In the DMO Utilities, analyze the R3load utilization after a migration run.
1.) Open the DMO utilities and navigate to “DMO Migration Post Analysis -> Charts”.
2.) Select the file “MIGRATE_*PROC*”
3.) Check for a long tail at the end of the migration, in which only a small number of R3loads still process remaining tables.

For a definition of this tail and examples for a long and a short tail, see the blog
DMO: background on table split mechanism
If such a long tail is found, analyze the durations file to find out which tables cause it.
Durations file
1.) Open the file SUM/abap/htdoc/MIGRAT*_DUR.XML
(or SUM/abap/doc/analysis/MIGRAT*_DUR.XML if you are using SUM 2.0 SP 02 or newer) with a browser to get a graphical representation of the runtimes of the migrated tables.
2.) Look for long-running tables at the end of the migration phase.

In this example, the table RFBLG has a very long runtime. It is running from the beginning of the migration phase until the end.
R3load logs
Analyze the R3load logs to identify the origin of performance bottlenecks of long-running tables.
1.) Open the R3load log summary file SUM/abap/log/MIGRATE_RUN*.LOG
2.) Search for the problematic tables
3.) Analyze the R3load runtimes to identify the origin of the performance bottlenecks.
You will find R3load statistics of the time spend in total (wall time), in CPU in user mode (usr) and in the kernel system calls (sys).
There are separate statistics available for the database and memory pipe of the exporting R3load (_EXP) and the importing R3load (_IMP).
#!---- MASKING file “MIGRATE_00009_RFBLG_EXP.LOG”
(STAT) DATABASE times: 1162.329/4.248/0.992 93.6%/36.9%/47.6% real/usr/sys.
(STAT) PIPE times: 79.490/7.252/1.092 6.4%/63.1%/52.4% real/usr/sys.
#!---- MASKING file “MIGRATE_00009_RFBLG_IMP.LOG”
(STAT) DATABASE times: 702.479/213.625/4.896 56.6%/96.6%/86.3% real/usr/sys.
(STAT) PIPE times: 539.445/7.620/0.780 43.4%/3.4%/13.7% real/usr/sys.
In this example the exporting R3load spend 1162 seconds on the source DB reading data.
79 seconds were required to copy the data to the memory pipe.
The importing R3load spent 702 seconds on the target SAP HANA DB to write the data and it spend 539 seconds on the memory pipe waiting for data.
Conclusion: In this example the source DB was the bottleneck, because the importing R3load has been waiting for data on the pipe most of the time.
In this case you should ask the administrator of the source DB if he can do a performance analysis of this table.
Extended Analysis
If you still experience low migration speeds, an extended analysis of the following factors during a migration run might help to find bottlenecks:
CPU Usage
As already mentioned in the R3log analysis example, the R3loads usually wait for the database most of the time while the actual processing of the data only takes a small amount of time.
Therefore it should not happen, that the R3load processes use more than 90% of the CPU time on the application server. If this is the case, either reduce the number of R3load processes or equip the server, on which SUM is running (usually the application server), with more CPUs, if feasible.

Memory Usage
Analogous to the CPU usage on the server where SUM is running, enough main memory should be available for the R3load processing.
Otherwise the operating system will apply paging mechanisms that significantly slow down the migration performance.
The minimum memory usage of a single R3load process during the migration of a standard table is about 60 MB.
Especially when declustering is necessary (for target releases 7.40 and higher), the memory required by R3load is very content dependent.
Therefore it makes sense to monitor the actual memory usage during a complete test migration run to determine the optimal memory configuration.

Disk I/O
The performance of export and import operations on the source and target DB is depending on a good disk input/output (I/O) performance. Therefore it might be necessary to postpone activities which create heavy disk I/O (such as backup jobs) during the migration run.
Sometimes it is not obvious, which activities create disk I/O and have a negative impact on the DMO migration performance.
In this case it might be useful to actively monitor the disk I/O during a test migration to pinpoint the timeframe of problematic activities.

Network
The network can also be a bottleneck, therefore it is recommended to monitor the throughput of the different network connections (from PAS to source DB, from PAS to target SAP HANA DB) during a migration run.
Theoretically this should not be a major issue with modern LAN networks. The recommend 10 Gbit LAN would already deliver an expected transfer rate of ~3500 GB / hour. Therefore a low throughput can be an indicator for an unfavorable setup for the migration (e.g data flow through two firewalls).
It also has to be considered, if parallel migrations of different systems or other activities that use network bandwidth, are planned.

Remove the bottlenecks
Depending on the results of your analysis there may be various ways to deal with the bottlenecks found.
If a more powerful machine is required for the R3load processes, it might be an option to run the SUM on a powerful Additional Application Server (AAS) instance with free resources.
In general, SUM and SUM with DMO may be executed not only on the Primary Application Server (PAS), but also on an Additioal Application Server (AAS). However, running SUM with DMO on an AAS is only supported if your system has a separate ASCS instance.
It might be even possible to use an SAP HANA Standby Node for this purpose, especially if the network connection to the SAP HANA database is the bottleneck.
Housekeeping
Especially when performing a SAP BW migration, the positive impact of housekeeping tasks like cleaning up the persistent staging area (PSA), the deletion of aggregation tables and compression of InfoCubes should not be underestimated.
For details regarding the SAP BW migration using DMO see the document:
SAP First Guidance - Using the new DMO to Migrate BW on HANA
But even with a standard DMO you should give some thought to housekeeping before starting the migration. For example, it might be an option for you to delete or archive old data that is not accessed frequently anymore (analogous to moving BW data to Near-Line Storage) before starting the DMO migration. This data does not need to be transferred, which reduces the migration runtime, and it does not need to be stored in-memory on the target HANA database.
Table Comparison
After you have optimized the DMO migration using the benchmarking tool, you are ready for the first test migration run.
You have now the option to let SUM compare the contents of tables on the target database with their respective content on the source database to make sure that everything has been migrated successfully.

We recommend to switch on the table comparison for all tables in the first test run only.
The reason is that the full table comparison via checksums takes a lot of time, usually as long as the table export itself.
If no errors are found, keep the table comparison off (“Do not compare table contents”) or compare only single, business critical tables in the productive DMO migration run.
This will minimize the Downtime in the productive run.
In fact, even when "Do not compare table contents" is selected, the SUM still compares the number of rows of the migrated tables on the target database with the number of rows on the source database after the migration of their content.
For further information regarding the DMO table comparison see DMO: table comparison and migration tools
Downtime Optimization
If the performance of the standard DMO is still not sufficient after all optimization potential has been utilized (usually a migration speed of up to ~500 GB/h can be reached) and the downtime needs to be significantly shorter, additional options to minimize the downtime are available.

Downtime optimized DMO
The Downtime optimized DMO further reduces the downtime by enabling the migration of selected application tables during the DMO uptime.
The report RSDMODBSIZE (available with SAP Note 2153242) determines the size of the largest tables in a SAP system and gives an estimation about the transfer time required for these tables in the DMO downtime.
Tables transferred with Downtime optimized DMO in the DMO uptime effectively reduce the downtime.
The report facilitates the decision if the usage of Downtime optimized DMO is suitable and generates a list of tables as input for SLT.

The following blog post describes this technology, prerequisites and how to register for pilot usage of the Downtime optimized DMO:
DMO: downtime optimization by migrating app tables during uptime (preview)
Note that the Downtime optimized DMO works for SAP Business Suite systems, but not for SAP BW.
BW Post Copy Automation including Delta Queue Cloning
To minimize the migration downtime of a productive SAP BW system, one of the recommended migration paths from SAP BW to SAP BW on SAP HANA comprises a system copy of your SAP BW system.
To keep things simple, SAP offers the Post-Copy Automation framework (PCA) as part of the SAP Landscape Virtualization Management which includes post-copy automation templates for SAP BW as well as an automated solution for delta queue cloning and synchronization, enabling the parallel operation of your existing production system.

In combination with the SUM DMO the production downtime of the migration from SAP BW to SAP BW on SAP HANA can be kept at a minimum. The usage of the delta queue cloning solution requires additional steps to be performed before the standard SUM DOM is started.

For further information about the downtime-minimized migration process of SAP BW using Post-Copy Automation with delta queue cloning see the following links:
TechEd 2014 - Migration to BW on HANA - Best Practice
SAP First Guidance - Using the DMO Option to Migrate BW on HANA
SAP First Guidance - BW Housekeeping and BW-PCA
Three things to know when migrating SAP BW on SAP HANA
Easier Migration to SAP BW powered by SAP HANA with ABAP Post-Copy Automation for SAP Business Wareh...
Post-Copy Automation
- SAP Managed Tags:
- Software Logistics
60 Comments
- « Previous
-
- 1
- 2
- Next »
You must be a registered user to add a comment. If you've already registered, sign in. Otherwise, register and sign in.
Labels in this area
-
ABAP CDS Views - CDC (Change Data Capture)
2 -
AI
1 -
Analyze Workload Data
1 -
BTP
1 -
Business and IT Integration
2 -
Business application stu
1 -
Business Technology Platform
1 -
Business Trends
1,658 -
Business Trends
92 -
CAP
1 -
cf
1 -
Cloud Foundry
1 -
Confluent
1 -
Customer COE Basics and Fundamentals
1 -
Customer COE Latest and Greatest
3 -
Customer Data Browser app
1 -
Data Analysis Tool
1 -
data migration
1 -
data transfer
1 -
Datasphere
2 -
Event Information
1,400 -
Event Information
66 -
Expert
1 -
Expert Insights
177 -
Expert Insights
298 -
General
1 -
Google cloud
1 -
Google Next'24
1 -
Kafka
1 -
Life at SAP
780 -
Life at SAP
13 -
Migrate your Data App
1 -
MTA
1 -
Network Performance Analysis
1 -
NodeJS
1 -
PDF
1 -
POC
1 -
Product Updates
4,577 -
Product Updates
344 -
Replication Flow
1 -
RisewithSAP
1 -
SAP BTP
1 -
SAP BTP Cloud Foundry
1 -
SAP Cloud ALM
1 -
SAP Cloud Application Programming Model
1 -
SAP Datasphere
2 -
SAP S4HANA Cloud
1 -
SAP S4HANA Migration Cockpit
1 -
Technology Updates
6,873 -
Technology Updates
421 -
Workload Fluctuations
1
Related Content
- Start page of SAP Signavio Process Insights, discovery edition, the 4 pillars and documentation in Technology Blogs by SAP
- Composite Data Source Configuration in Optimized Story Experience in Technology Blogs by SAP
- QM Notification Configuration from DMC to ERP in Technology Blogs by Members
- Embed mode not working for optimized story in Technology Q&A
- Up Net Working Capital, Up Inventory and Down Efficiency. What to do? in Technology Blogs by SAP
Top kudoed authors
| User | Count |
|---|---|
| 38 | |
| 25 | |
| 17 | |
| 13 | |
| 7 | |
| 7 | |
| 7 | |
| 7 | |
| 6 | |
| 6 |