
- SAP Community
- Products and Technology
- Enterprise Resource Planning
- ERP Blogs by Members
- Using SAP ByDesign OData in Microsoft Power Query
Enterprise Resource Planning Blogs by Members
Gain new perspectives and knowledge about enterprise resource planning in blog posts from community members. Share your own comments and ERP insights today!
Turn on suggestions
Auto-suggest helps you quickly narrow down your search results by suggesting possible matches as you type.
Showing results for
Former Member
Options
- Subscribe to RSS Feed
- Mark as New
- Mark as Read
- Bookmark
- Subscribe
- Printer Friendly Page
- Report Inappropriate Content
10-07-2015
9:09 AM
Eine deutsche Version des Blogs ist hier verfügbar-.
In this blog I would like to give you a short overview about extended functionality of SAP Business ByDesign`s OData reporting feed.
In my opinion Microsoft Power Query is currently the most power full tool for creating dashboards for SAP Business ByDesign. Regarding this you can find here a step by step guide to get ByDesign OData feed working with Microsoft Power Query:
1. Searching for a report in SAP Business ByDesign, you want to use in Power Query
2. Get the technical name of the report (for example ZB68545FD12E4222BE8B904)
In Business Analytics report view add ID field via Personalize or open report and click in report on Details for Technical information:
Report view

Technical information

3. Open Microsoft Excel
4. Go to PowerQuery Tab

5. Click on Get from web

6. Insert report URL with specific oData parameters (for parameters see following blog post http://scn.sap.com/community/business-bydesign/blog/2015/03/10/odata-for-sap-business-bydesign-analy... of Knut Heusermann)
If single sign-on is configured in system you also have to add the following parameter to url: saml2=disabled
7. Chose Standard Authorization:

Example request for Sales order volume:
(for structure of URL see also following blog post http://scn.sap.com/community/business-bydesign/blog/2015/03/10/odata-for-sap-business-bydesign-analy... of Knut Heusermann)
I would recommend to use JSON format because it is more performant as XML.
8. Now you can go ahead with configuration of your request
Example:
- Define source stream as JSON by clicking on Option logo behind the source (on the right side):


- Convert source to table

- Split Value column

- Split Value.results

- Split Records (At this point you have to choose which Characteristics and Key Figures you would like to use)

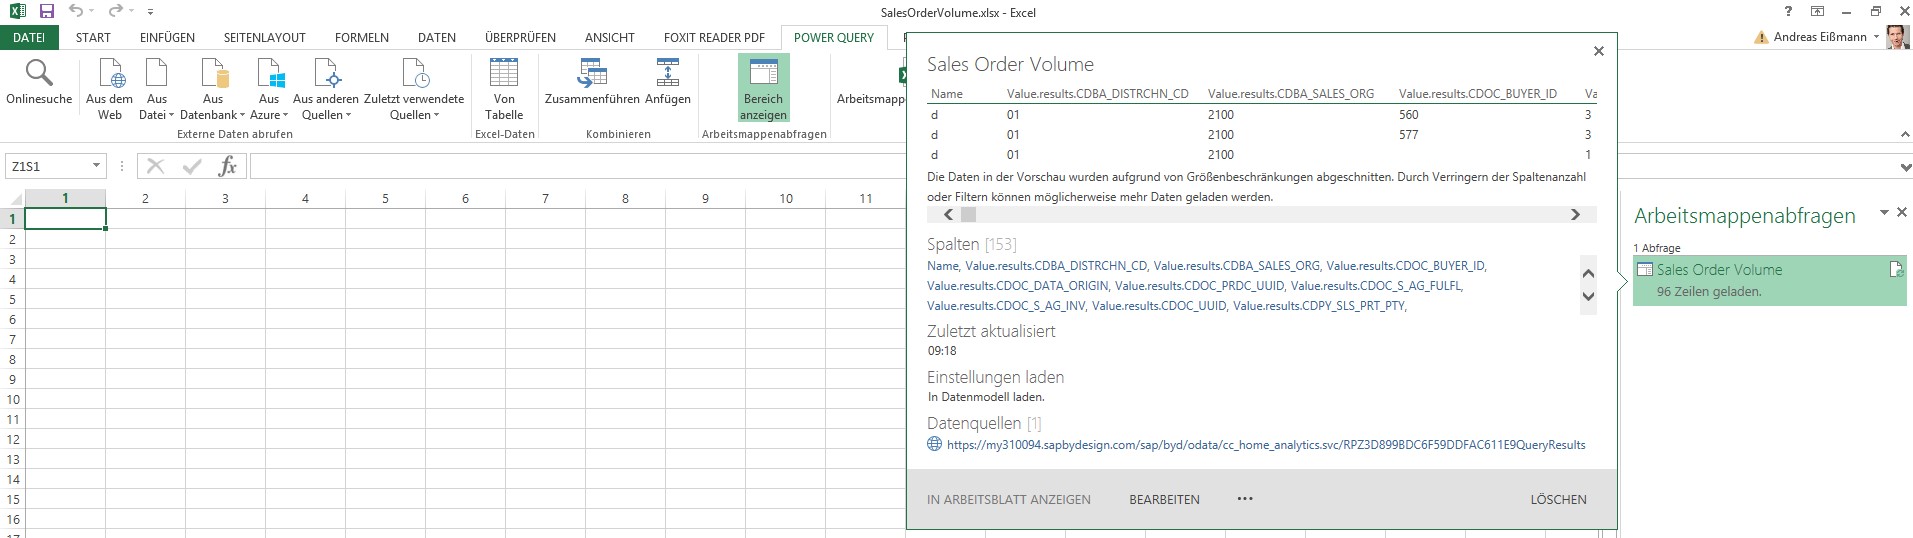
9. Now you find on the right side the automatically generated steps from Power Query. You can modify all these steps by simple click on it (for example renaming).

10. You can also rename column headers, delete columns or modify data in columns (for example splitting by specific char) (Please find more information about Power Query possibilities in this blog http://blogs.msdn.com/b/powerbi/archive/2014/07/08/getting-started-with-excel-and-power-bi-series.as...)
11. If you now use Save and Load Button, your Power Query Request loads data in default defined data model.

12. You can define in the Options if Power Query should load by default data in Excel table or directly in Power Pivot (https://msdn.microsoft.com/en-us/library/gg399183(v=sql.110).aspx)

13. Now you have data available in data model and you can work with it

- SAP Managed Tags:
- SAP Business ByDesign
3 Comments
You must be a registered user to add a comment. If you've already registered, sign in. Otherwise, register and sign in.
Labels in this area
-
"mm02"
1 -
A_PurchaseOrderItem additional fields
1 -
ABAP
1 -
ABAP Extensibility
1 -
ACCOSTRATE
1 -
ACDOCP
1 -
Adding your country in SPRO - Project Administration
1 -
Advance Return Management
1 -
AI and RPA in SAP Upgrades
1 -
Approval Workflows
1 -
ARM
1 -
ASN
1 -
Asset Management
1 -
Associations in CDS Views
1 -
auditlog
1 -
Authorization
1 -
Availability date
1 -
Azure Center for SAP Solutions
1 -
AzureSentinel
2 -
Bank
1 -
BAPI_SALESORDER_CREATEFROMDAT2
1 -
BRF+
1 -
BRFPLUS
1 -
Bundled Cloud Services
1 -
business participation
1 -
Business Processes
1 -
CAPM
1 -
Carbon
1 -
Cental Finance
1 -
CFIN
1 -
CFIN Document Splitting
1 -
Cloud ALM
1 -
Cloud Integration
1 -
condition contract management
1 -
Connection - The default connection string cannot be used.
1 -
Custom Table Creation
1 -
Customer Screen in Production Order
1 -
Data Quality Management
1 -
Date required
1 -
Decisions
1 -
desafios4hana
1 -
Developing with SAP Integration Suite
1 -
Direct Outbound Delivery
1 -
DMOVE2S4
1 -
EAM
1 -
EDI
2 -
EDI 850
1 -
EDI 856
1 -
EHS Product Structure
1 -
Emergency Access Management
1 -
Energy
1 -
EPC
1 -
Find
1 -
FINSSKF
1 -
Fiori
1 -
Flexible Workflow
1 -
Gas
1 -
Gen AI enabled SAP Upgrades
1 -
General
1 -
generate_xlsx_file
1 -
Getting Started
1 -
HomogeneousDMO
1 -
IDOC
2 -
Integration
1 -
Learning Content
2 -
LogicApps
2 -
low touchproject
1 -
Maintenance
1 -
management
1 -
Material creation
1 -
Material Management
1 -
MD04
1 -
MD61
1 -
methodology
1 -
Microsoft
2 -
MicrosoftSentinel
2 -
Migration
1 -
MRP
1 -
MS Teams
2 -
MT940
1 -
Newcomer
1 -
Notifications
1 -
Oil
1 -
open connectors
1 -
Order Change Log
1 -
ORDERS
2 -
OSS Note 390635
1 -
outbound delivery
1 -
outsourcing
1 -
PCE
1 -
Permit to Work
1 -
PIR Consumption Mode
1 -
PIR's
1 -
PIRs
1 -
PIRs Consumption
1 -
PIRs Reduction
1 -
Plan Independent Requirement
1 -
Premium Plus
1 -
pricing
1 -
Primavera P6
1 -
Process Excellence
1 -
Process Management
1 -
Process Order Change Log
1 -
Process purchase requisitions
1 -
Product Information
1 -
Production Order Change Log
1 -
Purchase requisition
1 -
Purchasing Lead Time
1 -
Redwood for SAP Job execution Setup
1 -
RISE with SAP
1 -
RisewithSAP
1 -
Rizing
1 -
S4 Cost Center Planning
1 -
S4 HANA
1 -
S4HANA
3 -
Sales and Distribution
1 -
Sales Commission
1 -
sales order
1 -
SAP
2 -
SAP Best Practices
1 -
SAP Build
1 -
SAP Build apps
1 -
SAP Cloud ALM
1 -
SAP Data Quality Management
1 -
SAP Maintenance resource scheduling
2 -
SAP Note 390635
1 -
SAP S4HANA
2 -
SAP S4HANA Cloud private edition
1 -
SAP Upgrade Automation
1 -
SAP WCM
1 -
SAP Work Clearance Management
1 -
Schedule Agreement
1 -
SDM
1 -
security
2 -
Settlement Management
1 -
soar
2 -
SSIS
1 -
SU01
1 -
SUM2.0SP17
1 -
SUMDMO
1 -
Teams
2 -
User Administration
1 -
User Participation
1 -
Utilities
1 -
va01
1 -
vendor
1 -
vl01n
1 -
vl02n
1 -
WCM
1 -
X12 850
1 -
xlsx_file_abap
1 -
YTD|MTD|QTD in CDs views using Date Function
1
- « Previous
- Next »
Related Content
- SAP S/4HANA Public Cloud for Solution Business reporting with SAP Analysis for Office in Enterprise Resource Planning Blogs by SAP
- SAP Business ByDesign 2023 year-end review and outlook 2024 in Enterprise Resource Planning Blogs by SAP
- SAP B1 deadlock OPLN trough SAP Integration Service in Enterprise Resource Planning Q&A
- Azure Monitor for SAP solutions One-stop-shop for SAP technical monitoring in Enterprise Resource Planning Blogs by Members
- SAP Business ByDesign – What’s New 23.11 in Enterprise Resource Planning Blogs by SAP
Top kudoed authors
| User | Count |
|---|---|
| 2 | |
| 2 | |
| 2 | |
| 2 | |
| 2 | |
| 1 | |
| 1 | |
| 1 | |
| 1 | |
| 1 |