
- SAP Community
- Groups
- Interest Groups
- Application Development
- Blog Posts
- ABAP Profiler - Aggregation by Call Stack
Application Development Blog Posts
Learn and share on deeper, cross technology development topics such as integration and connectivity, automation, cloud extensibility, developing at scale, and security.
Turn on suggestions
Auto-suggest helps you quickly narrow down your search results by suggesting possible matches as you type.
Showing results for
Former Member
Options
- Subscribe to RSS Feed
- Mark as New
- Mark as Read
- Bookmark
- Subscribe
- Printer Friendly Page
- Report Inappropriate Content
10-22-2015
10:23 AM
If you have not seen the ABAP Profiler in Eclipse yet, I recommend this quick introduction that spotlights all analysis tools of the ABAP Profiler in SAP NW ABAP 7.4 SP2 for non-aggregated traces.
Problem :shock:
I was trying to profile the extraction of SQL monitor (SQLM) results to a file, which may take several minutes. The non-aggregated trace aborted with error state ‘Size exceeded’ (see below).

Of course, I could try to repeat the measurement with an aggregated trace but traces aggregated by call position contain less information and offer a very restricted set of analysis tools.
Solution :lol:
In this situation, a new feature of the ABAP profiler in Eclipse in SAP NW ABAP 7.5 provides a significant improvement: Aggregation by Call Stack. This aggregation mode is recommended whenever non-aggregated trace files become too large. In difference to non-aggregated traces, the chronological order of trace events and the individual execution times of each trace event are not contained in traces aggregated by call stack. As a consequence, the trace files are much smaller. I repeated the trace with this new mode and succeeded with a trace file of 149KB where 30MB have not sufficed before (see below).

For the second trace in the ABAP Traces view above, I have used the trace parameters shown below.

In particular, I have chosen the new trace parameter aggregation by call stack (“Yes, I need the Aggregated Call Tree (medium file size)”) and traced procedural units and SQL statements. Non-procedural trace events (SQL statements in this case) are called specified statements.
In my experience, often trace files with aggregation by call stack are not much larger than the old fallback option – trace files aggregated by call position (option “Yes, Hit List is sufficient (small file size)”). That’s great news, especially when I realized how to access the additional information about call stacks by new analysis tools in several ways. Let me show you!
New Analysis Tools
The first new analysis tool - the Condensed Hit List shown below - provides information about called units (methods, functions, forms, programs, transactions, …). You see how often, from how many different call stacks and from how many different call positions the unit was called. Most importantly, three execution times of the units are listed. The Total Time includes the total execution time of call statements (e.g. call method) of the unit. The difference between the two Own Times is whether they include the execution time of specified statements (SQL statements in this case) or not.

The Condensed Hit List is a good starting point for the analysis of traces. For example, to display the four different call stacks of method CL_ABAP_GZIP->COMPRESS_BINARY in the second line of the Condensed Hit List, I simply right-click on the line and choose “Show Call Stack” in the context menu. Then, in the Properties View, each of the four stacks can be displayed as below.

Now consider method CL_SQLM_METADATA->GET_MD_FOR_TABLES in the Condensed Hit List. Observe the difference between the two Own Times of this method. This means that the method spends a lot of time in specified statements. I navigate to the source code simply by double-clicking on the line of the method and remark that two specified statements of the method are SELECT loops. But I can find out even more details easily! I right-click on the line of the method in the Condensed Hit List, choose “Show in Aggregated Call Tree” and click on “Show” in the Statement Filter column of the method. As below, I see that the first select loop on table DD02L took significantly longer than the second one on table DD06L.
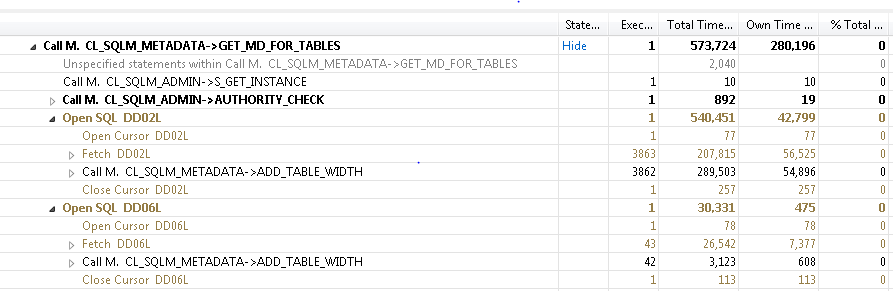
With the last mouse clicks, I arrived in the second new analysis tool, the Aggregated Call Tree shown above. For traces aggregated by call stack, it displays all execution details contained in the trace, namely the tree of all call stacks of trace events with their execution counters and execution times. The tool is very suitable for detail analysis. A single mouse click unfolds those parts of subtrees that consumed most of the time. Furthermore, for each trace event, navigation to the source code and to all related entries in other analysis tools of the ABAP profiler is supported.
Summary
With SAP NW ABAP 7.5, the ABAP Profiler in Eclipse offers aggregation by call stack. This aggregation mode is the new fallback option whenever no aggregation is not applicable. New analysis tools - the Condensed Hit List and the Aggregated Call Tree - interact nicely with each other and with the other tools of the ABAP profiler. I use these tools to get an overview, to explore and to discover efficiently useful execution details from a trace.
The option to view call stacks was formerly reserved to non-aggregated traces and is now also available for the often unavoidable fallback option! In my opinion, this takes ABAP performance analysis to the next level.
- SAP Managed Tags:
- ABAP Development
You must be a registered user to add a comment. If you've already registered, sign in. Otherwise, register and sign in.
Labels in this area
-
A Dynamic Memory Allocation Tool
1 -
ABAP
8 -
abap cds
1 -
ABAP CDS Views
14 -
ABAP class
1 -
ABAP Cloud
1 -
ABAP Development
4 -
ABAP in Eclipse
1 -
ABAP Keyword Documentation
2 -
ABAP OOABAP
2 -
ABAP Programming
1 -
abap technical
1 -
ABAP test cockpit
7 -
ABAP test cokpit
1 -
ADT
1 -
Advanced Event Mesh
1 -
AEM
1 -
AI
1 -
API and Integration
1 -
APIs
8 -
APIs ABAP
1 -
App Dev and Integration
1 -
Application Development
2 -
application job
1 -
archivelinks
1 -
Automation
4 -
BTP
1 -
CAP
1 -
CAPM
1 -
Career Development
3 -
CL_GUI_FRONTEND_SERVICES
1 -
CL_SALV_TABLE
1 -
Cloud Extensibility
8 -
Cloud Native
7 -
Cloud Platform Integration
1 -
CloudEvents
2 -
CMIS
1 -
Connection
1 -
container
1 -
Debugging
2 -
Developer extensibility
1 -
Developing at Scale
4 -
DMS
1 -
dynamic logpoints
1 -
Eclipse ADT ABAP Development Tools
1 -
EDA
1 -
Event Mesh
1 -
Expert
1 -
Field Symbols in ABAP
1 -
Fiori
1 -
Fiori App Extension
1 -
Forms & Templates
1 -
IBM watsonx
1 -
Integration & Connectivity
10 -
JavaScripts used by Adobe Forms
1 -
joule
1 -
NodeJS
1 -
ODATA
3 -
OOABAP
3 -
Outbound queue
1 -
Product Updates
1 -
Programming Models
13 -
Restful webservices Using POST MAN
1 -
RFC
1 -
RFFOEDI1
1 -
SAP BAS
1 -
SAP BTP
1 -
SAP Build
1 -
SAP Build apps
1 -
SAP Build CodeJam
1 -
SAP CodeTalk
1 -
SAP Odata
1 -
SAP UI5
1 -
SAP UI5 Custom Library
1 -
SAPEnhancements
1 -
SapMachine
1 -
security
3 -
text editor
1 -
Tools
16 -
User Experience
5
Top kudoed authors
| User | Count |
|---|---|
| 6 | |
| 5 | |
| 3 | |
| 3 | |
| 2 | |
| 2 | |
| 2 | |
| 2 | |
| 1 | |
| 1 |