By now, you may have seen the "What's New" post for the SAP Lumira 1.27 release. One of the new and exciting features of this release is data blending. This blog post will attempt to give a more detailed overview of the feature and explain how it all works. There will be more posts to come to further explain in more detail the intricacies of blending especially around dataset links, filtering, multiple matching members, duplicates, and joining vs blending decisions.
Imagine that you have a dataset that shows population values by country and city

If I apply a filter for 2014 (ie exclude 2013), and display Country by Population, I will see this in SAP Lumira:

Suppose I also have a dataset of average net income values also broken down by country: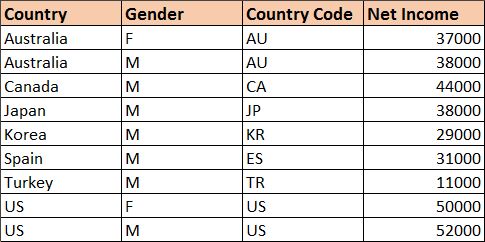
I can acquire this dataset into SAP Lumira and build a separate visualization of Countries by Avg Net Income:

How do I build a singular visualization that can show me populations and net incomes together? I can't do a traditional merge / join on these two datasets because there is no way to determine a unique key value on which to merge. This is where data blending comes in handy.
I know that for the two datasets, their respective Country dimensions contain values that are common. This gives me a condition on which to define a link between these two dimensions. SAP Lumira doesn't know this relationship yet but I can:
- switch back to the visualization on the Population dataset (Country by Population values)
- change the dataset to the Net Income dataset; my object picker will change to show its respective objective, but leave the visualization unchanged. Notice that in this pre-blended state, the Chart Builder UI now shows a Datasets In Use to indicate that the visualization loaded is built using a different dataset.
- add the Net Income measure from my Net Income dataset into my visualization to initiate a blend
See the animation of these 3 steps below:

This deliberate action of bringing in an object from my Net Income dataset into my visualization based on the Population dataset initiates the workflow of constructing a blended visualization. Because SAP Lumira does not know that the two Country dimensions can be related to one another, a dialog will appear to request that I create, establish and confirm these dataset links.

One very important note to point out here is that dataset links are defined at a document level, and not on a per visualization level. This means that the link context created here with Country dimensions from Population and Net Income datasets, will be used again if another blended visualization were to be created using the same two datasets. But for each visualization, it only uses whatever dataset link relationships are present in the viz itself.
One the dataset links are defined, SAP Lumira is capable of joining (via left outer join) the two aggregate tables into one blended visualization. The result is a single visualization that displays Population values from one dataset, matched with Net Income values from another dataset, based on a common Country dimension.

Notice that in this blend, the Country values are driven by the dataset that is primary: Population. This is why there is no value for US, because US only exists in the Net Income secondary dataset, and its Country, Net Income information is not able to blend into the Population primary dataset.
More to come! Expect to see posts diving into how values change depending on what dimensions are linked, how filtering is applied to a blend, and how we handle one to many or many to many relationships between primary and secondary dimension values. If you have any particular requests for detailed explanations, feel free to comment below!
Some key facts on Data Blending in SAP Lumira 1.27
- supports offline datasources only
- blending is limited to one secondary dataset
- filters are still applied at a dataset level, and not yet applied post-blend (1.28)
- ranking is supported on primary measures and dimension contexts only
