
- SAP Community
- Products and Technology
- Technology
- Technology Blogs by SAP
- Creating a Grid Style Report (Instead of Using a C...
Technology Blogs by SAP
Learn how to extend and personalize SAP applications. Follow the SAP technology blog for insights into SAP BTP, ABAP, SAP Analytics Cloud, SAP HANA, and more.
Turn on suggestions
Auto-suggest helps you quickly narrow down your search results by suggesting possible matches as you type.
Showing results for
JWiseman
Active Contributor
Options
- Subscribe to RSS Feed
- Mark as New
- Mark as Read
- Bookmark
- Subscribe
- Printer Friendly Page
- Report Inappropriate Content
06-05-2014
4:29 PM
This blog post will give you the steps on how to create a grid style analytic in Crystal Reports. This grid is created using the Multi-Column feature and can provide some great advantages over using a regular Cross-tab object. The advantages include being able to add objects such as charts, cross-tabs (to use as a table object inside the cells), multiple formatted summary objects, etc. to the grid cells.

Cricket fans might be familiar with a grid style analytic like the one above representing a bowler's results for each segment of the pitch. And for those of you who have been following Tom Flanagan's blog posts on 2014 cricket here you may have seen this report being used as a bowler analytic or similar bowler vs. batsman heat-map analytics.
The report shown in the screenshot is attached to this blog. Please extract the contents of the attachment and change the .txt extension to .rpt. Unfortunately there is no saved data with the report as the raw data is proprietary data and therefore I cannot publish a report with this raw data. However, the attached report should help you get a better idea as to how everything fits together. Please do open this sample report and look through its design if you are going through the instructions below.
The grid is created by the data returned to the report. Therefore, the first and most important step is to ensure that you have the proper and complete data returned to your report so that the grid will have all of the required rows and columns. In this example, I need to return all combinations of the 8 Length Names and 7 Line Names or 56 records in order to create the grid. In this case, the grid is inside of a sub-report but you don't necessarily need a sub-report to create this type of grid. A sub-report was used so that I could easily create the row headers and the column headers via a pair of cross-tab objects in the main report.
Returning the Proper Data
The easiest way to ensure that all of the cells (row & column combinations) are represented in the grid is to create a dummy record set of those row & column combinations. This can be done by creating your report off of a Command object as opposed to tables. Have a look at the sample Command syntax below which is written for an SAP HANA database. This is the query from the sub-report where the actual grid is generated and the bowler specific data is also used. Note that your syntax may vary as Commands are written in your database specific syntax.
SELECT
"C50_COMBINED"."bowling_length",
"C50_COMBINED"."bowling_length_name",
"C50_COMBINED"."bowling_line",
"C50_COMBINED"."bowling_line_name",
"C50_COMBINED"."bowler_runs_conceded",
"C50_COMBINED"."bowler_name",
"C50_COMBINED"."game_id",
"C50_COMBINED"."id",
"C50_COMBINED"."timestamp",
"C50_COMBINED"."dismissal_type_name",
"C50_COMBINED"."shot_type_name",
"C50_COMBINED"."wide",
"C50_COMBINED"."no_ball"
FROM
"CRICKET"."C50_COMBINED" "C50_COMBINED"
WHERE
"C50_COMBINED"."bowler_name"= '{?BowlerName}' AND
"C50_COMBINED"."game_id"= {?GameId} AND
"C50_COMBINED"."bowling_line_name" > ''
UNION ALL
SELECT DISTINCT
"C50_COMBINED"."bowling_length",
"C50_COMBINED"."bowling_length_name",
"C50_COMBINED"."bowling_line",
"C50_COMBINED"."bowling_line_name",
0,
'',
0,
0,
CURRENT_TIMESTAMP,
'NULL',
'NULL',
0,
0
FROM
"CRICKET"."C50_COMBINED" "C50_COMBINED"
WHERE
"C50_COMBINED"."bowling_line_name" > ''
The above syntax uses a UNION ALL of two queries. The first query is used to get the normal bowler data for our sub-report. Using the cricket example, the first query brings back records for a particular bowler for a specific game. The second query is used to bring back the dummy record set. It brings back 56 records where each length name and line name combination will have a dummy record. Again, this is to ensure that our grid will have 7 columns and 8 rows.
For those not familiar with using a UNION or UNION ALL, it is important to note that the queries that you are joining must have the same number of fields returned and the types must also match. Also note that the names of the fields will be taken from the first set of fields or the first query.
Creating the Grid
Now that we have the proper data in the record set in the sub-report we can create the grid formatting. We need to adjust the width of the sub-report in the main report Design mode so that the width is slightly larger than the width we want. In the example, the grid is going to be 3.5" wide, so I have set the width of the sub-report to be 3.503" wide.
The next step is to Insert a single Group in the sub-report which will represent the row & column (or in the example, Length & Line ) combinations. Create a formula that will concatenate the field that you want to use as the row first and then the field that you want to use as the column. For example, the following concatenates a totext() of the Length ID and a totext() of the Line ID.
totext({Command.bowling_length},0,'') + '|' + totext({Command.bowling_line},0,'')
After you've created the row & column concatenation formula, go to the Insert menu and choose Group and choose this new formula.
Now we want to specifya width for the entire grid. As we are using a sub-report to simplify formatting, we go to the File menu while in the sub-report design / edit mode, then go to Page Setup, and then specify a width. I chose 3.5" as I want to have 7 columns that are each 0.5" wide. This is because there are 7 values for the Lines in this cricket analytic.
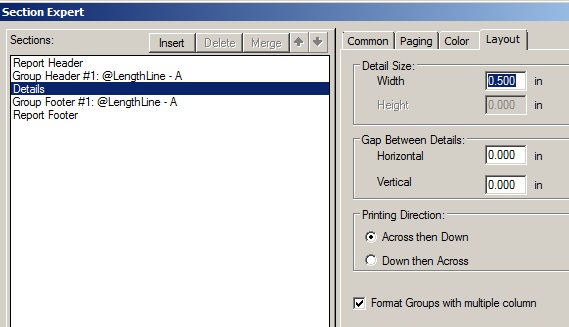
To create the individual grid cells based on the new grouping, we use the Format with Multiple Columns option which is available in the Section Expert for the Details section. When this is selected a new "Layout" tab appears.

In the Layout tab we specify the width that we want. Note in the screenshot below I've entered a Width of 0.5" and then a Printing Direction of Across then Down. The Format Groups with Multiple Column option has also been checked. You don't need to fill in any values for the Horizontal or Vertical Gaps.
You can now suppress both the Group Header and the Details section as the Group Footer section will be used to contain any objects that you want to display. The last step to format the actual grid size is to expand the Group Footer 1 section to the desired height as this footer will be the only section displayed from the sub-report.

I've moved the Group 1 Name to the Group Footer just to show the results of the grid in conjunction with the formula used for the group. When I preview the sub-report it will now look like this, where the rows do continue down from 5 to 8.

Customizing the Grid
You can now add charts, multiple summaries, etc. to the group footer. In the cricket bowler analytic sample, I used a string running total that keeps track of run types, wickets, and dots for each of the length & line areas. Those ball values are later converted to color-coded markers using some RTF code in the display formula. This type of analytic would not be possible to create in a cross-tab object just due to that particular requirement.
The following screenshot from another report used in the cricket blogs shows several different grids (in sub-reports) which have cells that contain cross-tab objects used as summary tables for the lines, the lengths, and the length - line cells.

Review
If you need to create a grid that has more functionality than a regular cross-tab then this blog post will hopefully get you to the final result. There is a bit of formatting to create the grid and a bit more work to ensure that the correct records are coming into the sub-report, but once this is done you have a lot more formatting options available in each grid cell. Another good usage of the multi-column feature in Crystal is the development of calendar style reports.
As mentioned earlier, the above Command object syntax uses SAP HANA SQL. If you are a Crystal Reports developer and are using HANA or just wish to find out more about HANA SQL etc. then please visit the SAP HANA Academy for lots of free 'how to' videos.
- SAP Managed Tags:
- SAP Crystal Reports,
- SAP HANA
You must be a registered user to add a comment. If you've already registered, sign in. Otherwise, register and sign in.
Labels in this area
-
ABAP CDS Views - CDC (Change Data Capture)
2 -
AI
1 -
Analyze Workload Data
1 -
BTP
1 -
Business and IT Integration
2 -
Business application stu
1 -
Business Technology Platform
1 -
Business Trends
1,658 -
Business Trends
93 -
CAP
1 -
cf
1 -
Cloud Foundry
1 -
Confluent
1 -
Customer COE Basics and Fundamentals
1 -
Customer COE Latest and Greatest
3 -
Customer Data Browser app
1 -
Data Analysis Tool
1 -
data migration
1 -
data transfer
1 -
Datasphere
2 -
Event Information
1,400 -
Event Information
66 -
Expert
1 -
Expert Insights
177 -
Expert Insights
299 -
General
1 -
Google cloud
1 -
Google Next'24
1 -
Kafka
1 -
Life at SAP
780 -
Life at SAP
13 -
Migrate your Data App
1 -
MTA
1 -
Network Performance Analysis
1 -
NodeJS
1 -
PDF
1 -
POC
1 -
Product Updates
4,577 -
Product Updates
344 -
Replication Flow
1 -
RisewithSAP
1 -
SAP BTP
1 -
SAP BTP Cloud Foundry
1 -
SAP Cloud ALM
1 -
SAP Cloud Application Programming Model
1 -
SAP Datasphere
2 -
SAP S4HANA Cloud
1 -
SAP S4HANA Migration Cockpit
1 -
Technology Updates
6,873 -
Technology Updates
422 -
Workload Fluctuations
1
Related Content
- Business Partner customizing for Automotive Industry in Technology Blogs by Members
- I am using exit_saplkedrcopa_001 for enhancement to populate characteristics values in KEDR. in Technology Q&A
- Extend Your Crystal Reports Solutions in the DHTML Viewer With a Free Function Library in Technology Blogs by Members
- I created a table function, but in amdp I am not able to create table using sqlscript to append data in Technology Q&A
- CAP Autentication error in Technology Q&A
Top kudoed authors
| User | Count |
|---|---|
| 39 | |
| 25 | |
| 17 | |
| 13 | |
| 7 | |
| 7 | |
| 7 | |
| 7 | |
| 6 | |
| 6 |