
- SAP Community
- Products and Technology
- Technology
- Technology Blogs by Members
- Greek Tourism Data - Creating Marketing Campaign
Technology Blogs by Members
Explore a vibrant mix of technical expertise, industry insights, and tech buzz in member blogs covering SAP products, technology, and events. Get in the mix!
Turn on suggestions
Auto-suggest helps you quickly narrow down your search results by suggesting possible matches as you type.
Showing results for
Former Member
Options
- Subscribe to RSS Feed
- Mark as New
- Mark as Read
- Bookmark
- Subscribe
- Printer Friendly Page
- Report Inappropriate Content
05-28-2014
10:58 AM
Greek tourism has always been considered a major contributor to the country’s economy. According to research of Association of Greek Tourism Enterprises, Greek tourism contributes 16,4% to the country’s Gross Domestic Product, covers 51,2% of the trade balance deficit, employees 1 in every 5 local residents and generates 34 billion in total demand. So here follows an interesting analysis based on Tourism Data regarding the mobility of the local population. The goal is to obtain intriguing, visual information quickly and easily, utilizing the capabilities of SAP Lumira from a newbie in analysis tools, in order to create some valuable knowledge for a Tourist Enterprise.
Moreover, you can access the final deliverable of boards here: http://bit.ly/1k0nLEl. This link will enable you to walk your way freely through the data and manipulate the charts, without the need to have a Lumira Cloud account. For full view of the boards navigate from the points under the charts, as highlighted in the following picture.

The data has been retrieved from Greek Statistical Authority (http://www.statistics.gr/portal/page/portal/ESYE/PAGE-database/custom_database?user_param=A2001) open databases and have been analyzed with SAP Lumira. More specifically the dataset investigates Tourism per duration, gender, age, purpose and interior/exterior tourism.
To see the full process followed in Lumira and learn some basic steps to use in your own analysis, check this post: Learn to use Lumira - Manipulate columns, Create Visualizations and Storyboards (+ links to more hel...
Considering it would be easier to comprehend and evaluate the offerings if we follow a story, let us assume that we own an ice-cream business on a Greek island and we want to analyze these data in order to improve our business income.
Visualization
- Let us first get a feeling of the route of Interior Tourism across the Years 2005-2007 based on different age groups. With a first look it is obvious that people who travel the most are the ones of ages 25-44, closely followed by 45-64, regardless the duration of their stay.

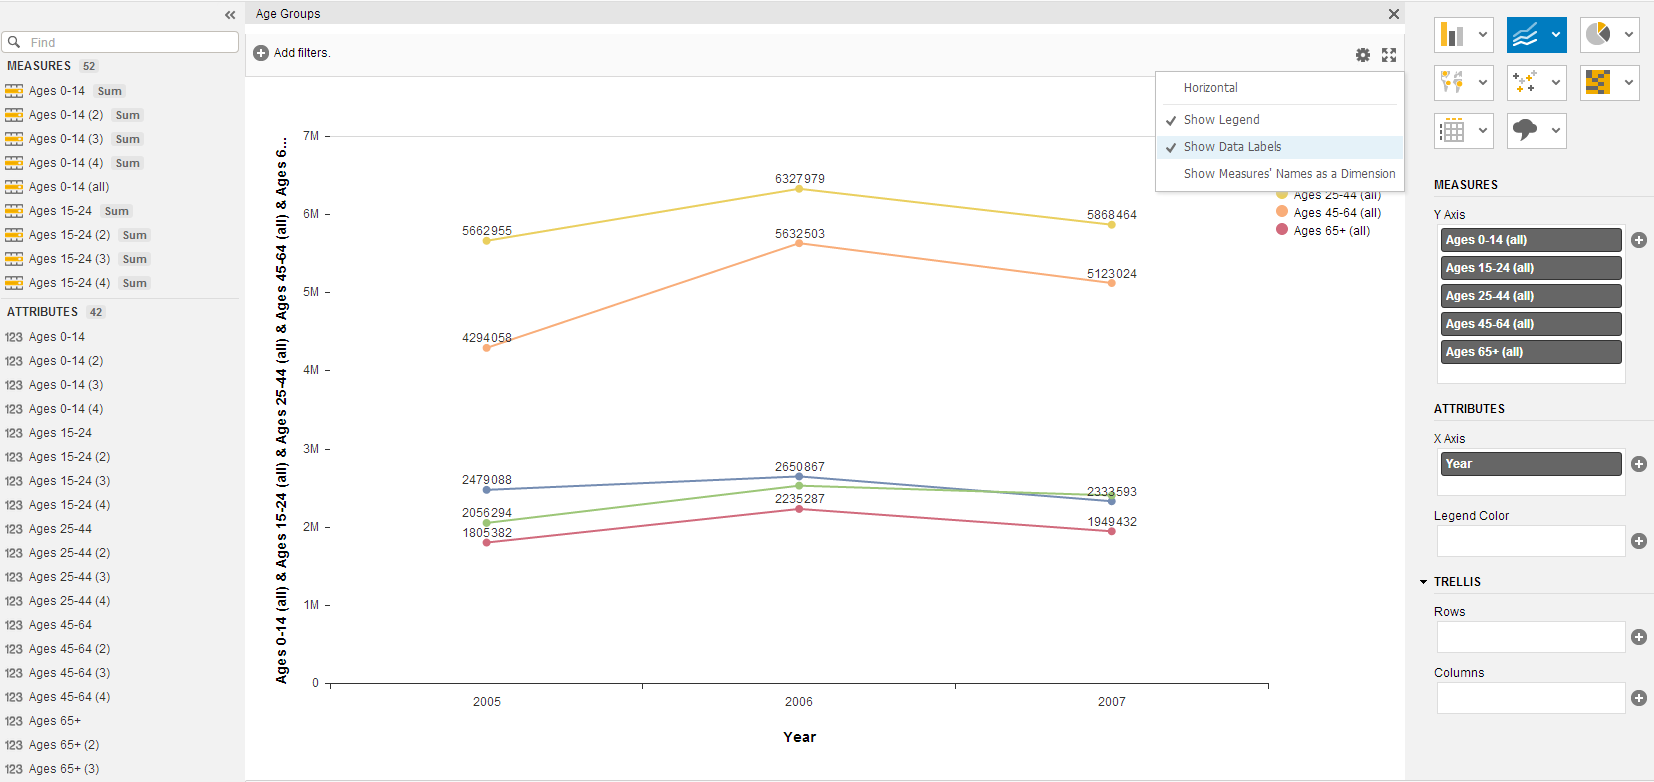
- In order to understand the general trends of these age groups the bar chart is turned into a line chart with a single click. By selecting the Settings and checking the option “Show Data Labels”, the exact view of the travelers’ numbers is supplied. It is apparent here that through the years there has been an increasing tendency in numbers of travelers, the most steep being of ages 45-64. Ages 25-44 are following closely, while 15-24 and 65+ are relatively steady. Ages 0-14 show an overall decrease in numbers. Now, keeping in mind that ages 25-44 and 45-64 seem to be most interesting so far, we continue to differentiate the groups in terms of their vacation duration.
- Looking into further detail, an insightful Area Chart with 100% Stacking (using settings option) is created, in order to compare the age groups according to their duration of stay. Lumira also gives users the opportunity to turn the chart horizontally for easier comprehension. For further understanding the years 2005 and 2007 can be highlighted, the overall fluctuation is more apparent. The information from this chart indicates that all the short term age groups are promising, as they have achieved a growing trend in proportion measures, while 25-44, 45-64 year old long duration travelers keep a great portion although it’s decreasing. So we decide to focus on long-term 25-44, 45-66 and keep an eye for potential on short-term groups.

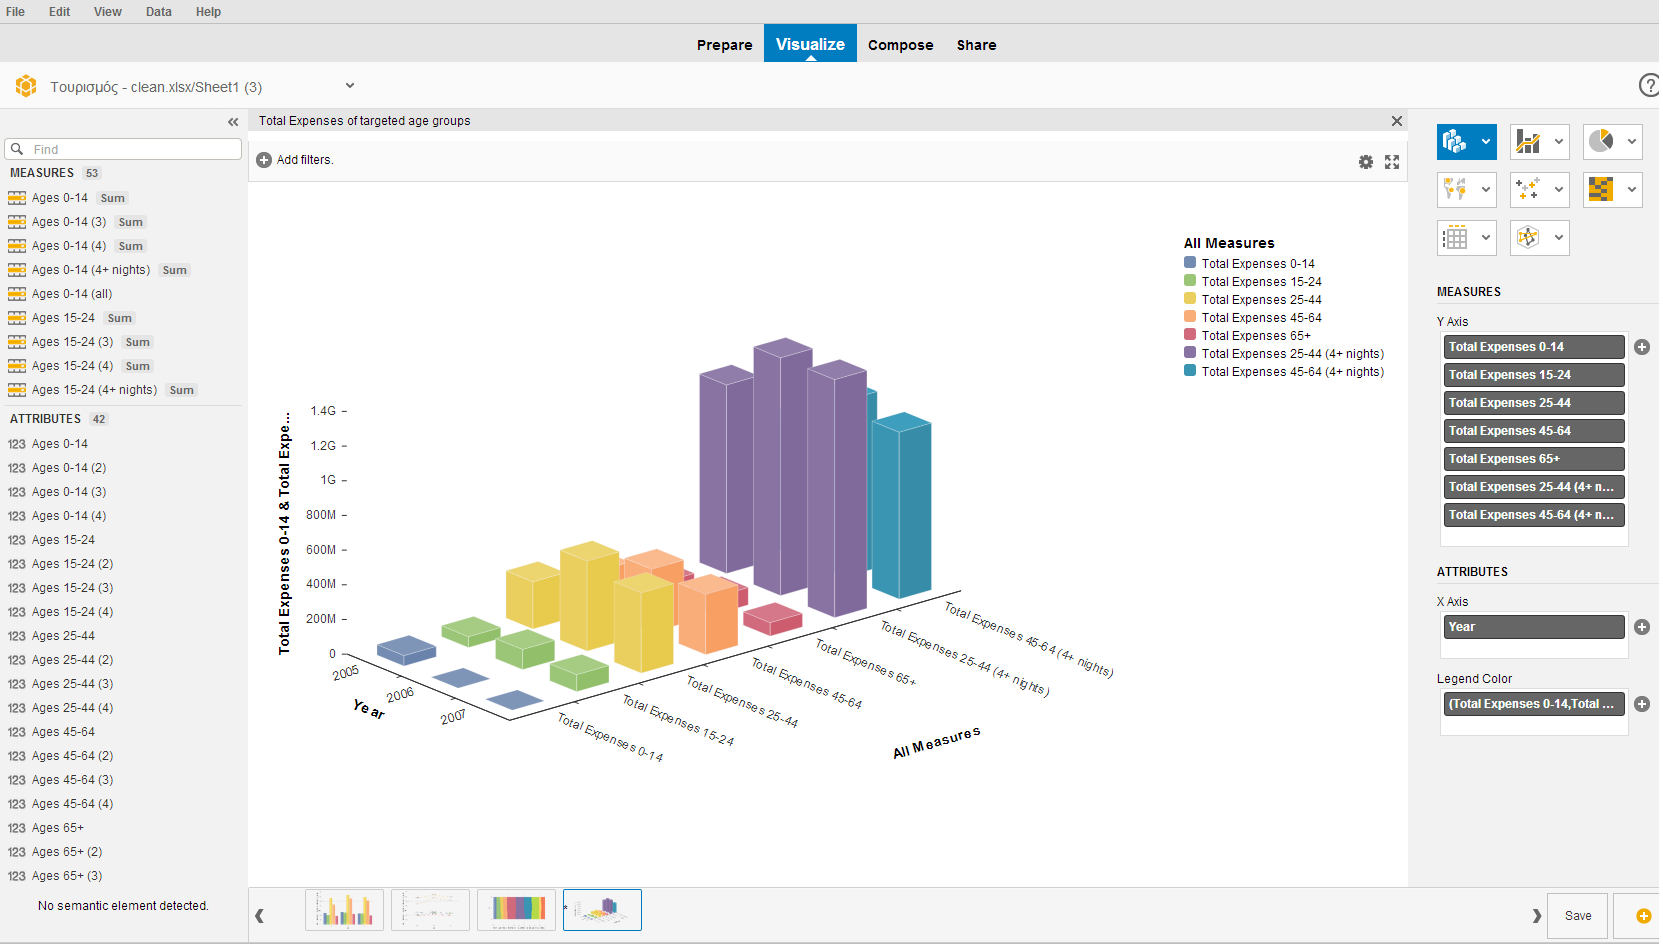
- Although numbers of travelers are interesting, the budget spent on vacation is of outstanding importance. Using one of the most striking visualizations of SAP Lumira, the following 3D Column Chart shows the Total Expenses of short duration travelers (1-3 night stay) and 25-44, 45-64 year old long duration travelers (4+ night stay) according to age and time. Providing a clear overview of the data, makes it obvious that the tourists that spend more during travelling are people of 25-44 and 45-64 on long duration stay.
- To confirm the assumptions a regular bar chart is created. By clicking on the measures on the right hand Lumira highlights the analogous bar columns, making them easier to spot and compare. Checking becomes easier, while there is no need to re-input the measures and attributes. In this chart it is easier to spot the groups that although may have lower total expenses rates, show promising trends. Characteristic examples are the groups of 25-44 and 45-64 short duration that mind want to be kept in mind in the future. Supposing that one group is to be chosen to focus on through the marketing campaign, that would be the people of 25-44 years old who tend to stay for more than 4 nights while travelling, as this is the group with the highest expenses and most intense course.

- Having finalized the target group, let us now look more into their profile characteristics to customize the marketing campaign accordingly. Lumira is used to create a pie that summarizes their purpose of travelling. SAP Lumira states that more than 90% of this group tend to travle most for Vacation purposes, rahter than Business or othere reasons.

- Although numbers of travelers are a valuable attribute for any marketing campaign, again there is the need to know how much of these travelers’ budget is spent along the different travel purposes. As can be seen here, indeed the greatest amount of monehy spend on tourism is during Vacation, although in a slightly smaller rate (82.79%). Finally, the ideal group is targeted and is consisted of people who age 25-44, stay for 4 nights or more, while on holidays in Greece.

- One final step that comes to mind would be moving on to investigate the exact trends of total expenses over the previous years, so the owner can make a personal, rough estimation of the trends this year. A line chart of the travelers’ budget through the years is constructed. What can be observed here is that although in year 2006 there has been an expense increase in all groups, in year 2007 there has been a slight decrease of the general budget. This may have implications with the economic state of the country or changes in the peoples’ habits. Either way, the possession of this information may have important implications on the future strategy of any business.

Storyboards
Having created visualizations of the data, the next step is to create a Storyboard, composing some visualizations that can provide important observations, through easy comparison and manipulation of the charts.
- The first board displays the Tourist Rates through the Years chart and the General Trend line chart, as well as the one that states the Trends of the different groups according to the duration of their stay.

- The controls on the side give the opportunity to select and limit the data for further drill down on the graphs. For example, by selecting the start and finish year of our data (2005, 2007) the following board is produced.

NOTE: If you enjoyed these views, feel free to access the rest of the boards, visit the link http://bit.ly/1k0nLEl. Its access is fulfilled by any computer, without the need of a Lumira Cloud account.
Through this short analysis on Tourism Data, we were able to inspect the trends and historical features along the years 2005-2007. Assuming we owned a business in the tourist industry we reviewed how the analysis on this data has proven of value to us while creating a marketing campaign.
Examples of specially tailored marketing campaigns for this group are:
- Focus on high offerings, regarding quality and service, as this group seems to be willing to spend more to ensure that they have a nice time,
- Come up with unique products,
- Run special offers through the social media (eg. Facebook) that people can print or “like” to redeem,
- Have punch cards that will allow customers a free cone after, say, 4 visits, since they tend to stay for a long duration,
- Promote group offers (eg. with every 2 waffles, 2 coffees for free) to attract families,
- Close late at night if there are bars around the area and offer breakfast deals,
- Cross-promote by partnering up with outdoor/summer activities companies, beauty centers and family-friendly restaurants etc.,
- Create children-friendly atmosphere (eg. decorate shop with colorful chairs or embellish ice-creams with kids biscuits) and hold special events such as birthday parties or holiday promotions (eg. meet Santa Claus),
- Set up an ice-cream cart at local playgrounds, theater productions, children’s sporting events,
- Sponsor charitable events or realize “New Flavor” contest where entry fees will be donated to a children’s house.
With SAP Lumira all this information has come to the tips of our fingers, and with some simple clicks one can review, analyze and understand vast amount of data and gain vision in the market in a way people never could before. The true value however is one step after that, in the actionacle insights that the software supplies and the influence of this in daily procedures and corporate strategy, example of which are the targeted marketing campaigns mentioned above.
As promised, here follows the technical part of the analysis with some basic steps that can be used in any analysis! If you enjoyed this post and care to learn how the analysis was completed, check: Learn to use Lumira - Manipulate columns, Create Visualizations and Storyboards (+ links to more hel....
- SAP Managed Tags:
- SAP Lumira
You must be a registered user to add a comment. If you've already registered, sign in. Otherwise, register and sign in.
Labels in this area
-
"automatische backups"
1 -
"regelmäßige sicherung"
1 -
"TypeScript" "Development" "FeedBack"
1 -
505 Technology Updates 53
1 -
ABAP
14 -
ABAP API
1 -
ABAP CDS Views
2 -
ABAP CDS Views - BW Extraction
1 -
ABAP CDS Views - CDC (Change Data Capture)
1 -
ABAP class
2 -
ABAP Cloud
2 -
ABAP Development
5 -
ABAP in Eclipse
1 -
ABAP Platform Trial
1 -
ABAP Programming
2 -
abap technical
1 -
absl
2 -
access data from SAP Datasphere directly from Snowflake
1 -
Access data from SAP datasphere to Qliksense
1 -
Accrual
1 -
action
1 -
adapter modules
1 -
Addon
1 -
Adobe Document Services
1 -
ADS
1 -
ADS Config
1 -
ADS with ABAP
1 -
ADS with Java
1 -
ADT
2 -
Advance Shipping and Receiving
1 -
Advanced Event Mesh
3 -
AEM
1 -
AI
7 -
AI Launchpad
1 -
AI Projects
1 -
AIML
9 -
Alert in Sap analytical cloud
1 -
Amazon S3
1 -
Analytical Dataset
1 -
Analytical Model
1 -
Analytics
1 -
Analyze Workload Data
1 -
annotations
1 -
API
1 -
API and Integration
3 -
API Call
2 -
Application Architecture
1 -
Application Development
5 -
Application Development for SAP HANA Cloud
3 -
Applications and Business Processes (AP)
1 -
Artificial Intelligence
1 -
Artificial Intelligence (AI)
5 -
Artificial Intelligence (AI) 1 Business Trends 363 Business Trends 8 Digital Transformation with Cloud ERP (DT) 1 Event Information 462 Event Information 15 Expert Insights 114 Expert Insights 76 Life at SAP 418 Life at SAP 1 Product Updates 4
1 -
Artificial Intelligence (AI) blockchain Data & Analytics
1 -
Artificial Intelligence (AI) blockchain Data & Analytics Intelligent Enterprise
1 -
Artificial Intelligence (AI) blockchain Data & Analytics Intelligent Enterprise Oil Gas IoT Exploration Production
1 -
Artificial Intelligence (AI) blockchain Data & Analytics Intelligent Enterprise sustainability responsibility esg social compliance cybersecurity risk
1 -
ASE
1 -
ASR
2 -
ASUG
1 -
Attachments
1 -
Authorisations
1 -
Automating Processes
1 -
Automation
2 -
aws
2 -
Azure
1 -
Azure AI Studio
1 -
B2B Integration
1 -
Backorder Processing
1 -
Backup
1 -
Backup and Recovery
1 -
Backup schedule
1 -
BADI_MATERIAL_CHECK error message
1 -
Bank
1 -
BAS
1 -
basis
2 -
Basis Monitoring & Tcodes with Key notes
2 -
Batch Management
1 -
BDC
1 -
Best Practice
1 -
bitcoin
1 -
Blockchain
3 -
bodl
1 -
BOP in aATP
1 -
BOP Segments
1 -
BOP Strategies
1 -
BOP Variant
1 -
BPC
1 -
BPC LIVE
1 -
BTP
12 -
BTP Destination
2 -
Business AI
1 -
Business and IT Integration
1 -
Business application stu
1 -
Business Application Studio
1 -
Business Architecture
1 -
Business Communication Services
1 -
Business Continuity
1 -
Business Data Fabric
3 -
Business Partner
12 -
Business Partner Master Data
10 -
Business Technology Platform
2 -
Business Trends
1 -
CA
1 -
calculation view
1 -
CAP
3 -
Capgemini
1 -
CAPM
1 -
Catalyst for Efficiency: Revolutionizing SAP Integration Suite with Artificial Intelligence (AI) and
1 -
CCMS
2 -
CDQ
12 -
CDS
2 -
Cental Finance
1 -
Certificates
1 -
CFL
1 -
Change Management
1 -
chatbot
1 -
chatgpt
3 -
CL_SALV_TABLE
2 -
Class Runner
1 -
Classrunner
1 -
Cloud ALM Monitoring
1 -
Cloud ALM Operations
1 -
cloud connector
1 -
Cloud Extensibility
1 -
Cloud Foundry
4 -
Cloud Integration
6 -
Cloud Platform Integration
2 -
cloudalm
1 -
communication
1 -
Compensation Information Management
1 -
Compensation Management
1 -
Compliance
1 -
Compound Employee API
1 -
Configuration
1 -
Connectors
1 -
Consolidation Extension for SAP Analytics Cloud
1 -
Control Indicators.
1 -
Controller-Service-Repository pattern
1 -
Conversion
1 -
Cosine similarity
1 -
cryptocurrency
1 -
CSI
1 -
ctms
1 -
Custom chatbot
3 -
Custom Destination Service
1 -
custom fields
1 -
Customer Experience
1 -
Customer Journey
1 -
Customizing
1 -
cyber security
3 -
Data
1 -
Data & Analytics
1 -
Data Aging
1 -
Data Analytics
2 -
Data and Analytics (DA)
1 -
Data Archiving
1 -
Data Back-up
1 -
Data Governance
5 -
Data Integration
2 -
Data Quality
12 -
Data Quality Management
12 -
Data Synchronization
1 -
data transfer
1 -
Data Unleashed
1 -
Data Value
8 -
database tables
1 -
Datasphere
2 -
datenbanksicherung
1 -
dba cockpit
1 -
dbacockpit
1 -
Debugging
2 -
Delimiting Pay Components
1 -
Delta Integrations
1 -
Destination
3 -
Destination Service
1 -
Developer extensibility
1 -
Developing with SAP Integration Suite
1 -
Devops
1 -
digital transformation
1 -
Documentation
1 -
Dot Product
1 -
DQM
1 -
dump database
1 -
dump transaction
1 -
e-Invoice
1 -
E4H Conversion
1 -
Eclipse ADT ABAP Development Tools
2 -
edoc
1 -
edocument
1 -
ELA
1 -
Embedded Consolidation
1 -
Embedding
1 -
Embeddings
1 -
Employee Central
1 -
Employee Central Payroll
1 -
Employee Central Time Off
1 -
Employee Information
1 -
Employee Rehires
1 -
Enable Now
1 -
Enable now manager
1 -
endpoint
1 -
Enhancement Request
1 -
Enterprise Architecture
1 -
ETL Business Analytics with SAP Signavio
1 -
Euclidean distance
1 -
Event Dates
1 -
Event Driven Architecture
1 -
Event Mesh
2 -
Event Reason
1 -
EventBasedIntegration
1 -
EWM
1 -
EWM Outbound configuration
1 -
EWM-TM-Integration
1 -
Existing Event Changes
1 -
Expand
1 -
Expert
2 -
Expert Insights
1 -
Fiori
14 -
Fiori Elements
2 -
Fiori SAPUI5
12 -
Flask
1 -
Full Stack
8 -
Funds Management
1 -
General
1 -
Generative AI
1 -
Getting Started
1 -
GitHub
8 -
Grants Management
1 -
groovy
1 -
GTP
1 -
HANA
6 -
HANA Cloud
2 -
Hana Cloud Database Integration
2 -
HANA DB
2 -
HANA XS Advanced
1 -
Historical Events
1 -
home labs
1 -
HowTo
1 -
HR Data Management
1 -
html5
8 -
HTML5 Application
1 -
Identity cards validation
1 -
idm
1 -
Implementation
1 -
input parameter
1 -
instant payments
1 -
Integration
3 -
Integration Advisor
1 -
Integration Architecture
1 -
Integration Center
1 -
Integration Suite
1 -
intelligent enterprise
1 -
iot
1 -
Java
1 -
job
1 -
Job Information Changes
1 -
Job-Related Events
1 -
Job_Event_Information
1 -
joule
4 -
Journal Entries
1 -
Just Ask
1 -
Kerberos for ABAP
8 -
Kerberos for JAVA
8 -
KNN
1 -
Launch Wizard
1 -
learning content
2 -
Life at SAP
1 -
lightning
1 -
Linear Regression SAP HANA Cloud
1 -
local tax regulations
1 -
LP
1 -
Machine Learning
2 -
Marketing
1 -
Master Data
3 -
Master Data Management
14 -
Maxdb
2 -
MDG
1 -
MDGM
1 -
MDM
1 -
Message box.
1 -
Messages on RF Device
1 -
Microservices Architecture
1 -
Microsoft Universal Print
1 -
Middleware Solutions
1 -
Migration
5 -
ML Model Development
1 -
Modeling in SAP HANA Cloud
8 -
Monitoring
3 -
MTA
1 -
Multi-Record Scenarios
1 -
Multiple Event Triggers
1 -
Neo
1 -
New Event Creation
1 -
New Feature
1 -
Newcomer
1 -
NodeJS
2 -
ODATA
2 -
OData APIs
1 -
odatav2
1 -
ODATAV4
1 -
ODBC
1 -
ODBC Connection
1 -
Onpremise
1 -
open source
2 -
OpenAI API
1 -
Oracle
1 -
PaPM
1 -
PaPM Dynamic Data Copy through Writer function
1 -
PaPM Remote Call
1 -
PAS-C01
1 -
Pay Component Management
1 -
PGP
1 -
Pickle
1 -
PLANNING ARCHITECTURE
1 -
Popup in Sap analytical cloud
1 -
PostgrSQL
1 -
POSTMAN
1 -
Process Automation
2 -
Product Updates
4 -
PSM
1 -
Public Cloud
1 -
Python
4 -
Qlik
1 -
Qualtrics
1 -
RAP
3 -
RAP BO
2 -
Record Deletion
1 -
Recovery
1 -
recurring payments
1 -
redeply
1 -
Release
1 -
Remote Consumption Model
1 -
Replication Flows
1 -
research
1 -
Resilience
1 -
REST
1 -
REST API
1 -
Retagging Required
1 -
Risk
1 -
Rolling Kernel Switch
1 -
route
1 -
rules
1 -
S4 HANA
1 -
S4 HANA Cloud
1 -
S4 HANA On-Premise
1 -
S4HANA
3 -
S4HANA_OP_2023
2 -
SAC
10 -
SAC PLANNING
9 -
SAP
4 -
SAP ABAP
1 -
SAP Advanced Event Mesh
1 -
SAP AI Core
8 -
SAP AI Launchpad
8 -
SAP Analytic Cloud Compass
1 -
Sap Analytical Cloud
1 -
SAP Analytics Cloud
4 -
SAP Analytics Cloud for Consolidation
2 -
SAP Analytics Cloud Story
1 -
SAP analytics clouds
1 -
SAP BAS
1 -
SAP Basis
6 -
SAP BODS
1 -
SAP BODS certification.
1 -
SAP BTP
21 -
SAP BTP Build Work Zone
2 -
SAP BTP Cloud Foundry
6 -
SAP BTP Costing
1 -
SAP BTP CTMS
1 -
SAP BTP Innovation
1 -
SAP BTP Migration Tool
1 -
SAP BTP SDK IOS
1 -
SAP Build
11 -
SAP Build App
1 -
SAP Build apps
1 -
SAP Build CodeJam
1 -
SAP Build Process Automation
3 -
SAP Build work zone
10 -
SAP Business Objects Platform
1 -
SAP Business Technology
2 -
SAP Business Technology Platform (XP)
1 -
sap bw
1 -
SAP CAP
2 -
SAP CDC
1 -
SAP CDP
1 -
SAP CDS VIEW
1 -
SAP Certification
1 -
SAP Cloud ALM
4 -
SAP Cloud Application Programming Model
1 -
SAP Cloud Integration for Data Services
1 -
SAP cloud platform
8 -
SAP Companion
1 -
SAP CPI
3 -
SAP CPI (Cloud Platform Integration)
2 -
SAP CPI Discover tab
1 -
sap credential store
1 -
SAP Customer Data Cloud
1 -
SAP Customer Data Platform
1 -
SAP Data Intelligence
1 -
SAP Data Migration in Retail Industry
1 -
SAP Data Services
1 -
SAP DATABASE
1 -
SAP Dataspher to Non SAP BI tools
1 -
SAP Datasphere
9 -
SAP DRC
1 -
SAP EWM
1 -
SAP Fiori
2 -
SAP Fiori App Embedding
1 -
Sap Fiori Extension Project Using BAS
1 -
SAP GRC
1 -
SAP HANA
1 -
SAP HCM (Human Capital Management)
1 -
SAP HR Solutions
1 -
SAP IDM
1 -
SAP Integration Suite
9 -
SAP Integrations
4 -
SAP iRPA
2 -
SAP Learning Class
1 -
SAP Learning Hub
1 -
SAP Odata
2 -
SAP on Azure
1 -
SAP PartnerEdge
1 -
sap partners
1 -
SAP Password Reset
1 -
SAP PO Migration
1 -
SAP Prepackaged Content
1 -
SAP Process Automation
2 -
SAP Process Integration
2 -
SAP Process Orchestration
1 -
SAP S4HANA
2 -
SAP S4HANA Cloud
1 -
SAP S4HANA Cloud for Finance
1 -
SAP S4HANA Cloud private edition
1 -
SAP Sandbox
1 -
SAP STMS
1 -
SAP successfactors
3 -
SAP SuccessFactors HXM Core
1 -
SAP Time
1 -
SAP TM
2 -
SAP Trading Partner Management
1 -
SAP UI5
1 -
SAP Upgrade
1 -
SAP Utilities
1 -
SAP-GUI
8 -
SAP_COM_0276
1 -
SAPBTP
1 -
SAPCPI
1 -
SAPEWM
1 -
sapmentors
1 -
saponaws
2 -
SAPS4HANA
1 -
SAPUI5
4 -
schedule
1 -
Secure Login Client Setup
8 -
security
9 -
Selenium Testing
1 -
SEN
1 -
SEN Manager
1 -
service
1 -
SET_CELL_TYPE
1 -
SET_CELL_TYPE_COLUMN
1 -
SFTP scenario
2 -
Simplex
1 -
Single Sign On
8 -
Singlesource
1 -
SKLearn
1 -
soap
1 -
Software Development
1 -
SOLMAN
1 -
solman 7.2
2 -
Solution Manager
3 -
sp_dumpdb
1 -
sp_dumptrans
1 -
SQL
1 -
sql script
1 -
SSL
8 -
SSO
8 -
Substring function
1 -
SuccessFactors
1 -
SuccessFactors Platform
1 -
SuccessFactors Time Tracking
1 -
Sybase
1 -
system copy method
1 -
System owner
1 -
Table splitting
1 -
Tax Integration
1 -
Technical article
1 -
Technical articles
1 -
Technology Updates
1 -
Technology Updates
1 -
Technology_Updates
1 -
terraform
1 -
Threats
1 -
Time Collectors
1 -
Time Off
2 -
Time Sheet
1 -
Time Sheet SAP SuccessFactors Time Tracking
1 -
Tips and tricks
2 -
toggle button
1 -
Tools
1 -
Trainings & Certifications
1 -
Transport in SAP BODS
1 -
Transport Management
1 -
TypeScript
2 -
ui designer
1 -
unbind
1 -
Unified Customer Profile
1 -
UPB
1 -
Use of Parameters for Data Copy in PaPM
1 -
User Unlock
1 -
VA02
1 -
Validations
1 -
Vector Database
2 -
Vector Engine
1 -
Visual Studio Code
1 -
VSCode
1 -
Web SDK
1 -
work zone
1 -
workload
1 -
xsa
1 -
XSA Refresh
1
- « Previous
- Next »
Related Content
- SAP Datasphere - Space, Data Integration, and Data Modeling Best Practices in Technology Blogs by SAP
- Capitalizing on AI: The Future of Industries in Technology Blogs by SAP
- Deliver Real-World Results with SAP Business AI: Q4 2023 & Q1 2024 Release Highlights in Technology Blogs by SAP
- SAP Cloud ALM Health Monitoring Using Your Own Metrics — Needs More Clarification in Technology Blogs by Members
- Augmenting SAP BTP Use Cases with AI Foundation: A Deep Dive into the Generative AI Hub in Technology Blogs by SAP
Top kudoed authors
| User | Count |
|---|---|
| 12 | |
| 12 | |
| 7 | |
| 5 | |
| 5 | |
| 4 | |
| 4 | |
| 3 | |
| 3 | |
| 3 |