
- SAP Community
- Products and Technology
- Technology
- Technology Blogs by SAP
- Troubleshooting Workload Analysis data for ABAP, J...
Technology Blogs by SAP
Learn how to extend and personalize SAP applications. Follow the SAP technology blog for insights into SAP BTP, ABAP, SAP Analytics Cloud, SAP HANA, and more.
Turn on suggestions
Auto-suggest helps you quickly narrow down your search results by suggesting possible matches as you type.
Showing results for
Advisor
Options
- Subscribe to RSS Feed
- Mark as New
- Mark as Read
- Bookmark
- Subscribe
- Printer Friendly Page
- Report Inappropriate Content
04-23-2014
12:38 AM
Hello Everybody,
This post will show you how to troubleshoot workload analysis application for ABAP, JAVA and Dual stack systems. I will show what I consider the most important steps to check when we see warnings like* 'no applicable data found'* in the workload analysis application for the managed systems.
The steps shown in this post are for Solution Manager 7.10 systems.
1) Check Diagnostics Infrastructure
1.1) Ensure that the Solution Manager ABAP and JAVA stacks are according to note 1483508.
As Solution Manager is a dual stack system, both stacks ABAP and JAVA must have the software component levels as described in note 1483508. If the software component levels from ABAP and JAVA differ from note 1483508, they will not be able to talk to each other and the applications will not work correctly.
1.2) System Preparation and Basic Configuration
Ensure that the System Preparation and Basic Configuration in transaction SOLMA_SETUP were performed correctly.
1.3) Check RFCs SOLMANDIAG, WEBADMIN and MDX PARSER.
1.3.1) The RFCs SOLMANDIAG and WEBADMIN are used to collect performance data from the Introscope Enterprise Manager. If these RFCs are not working, the extractor framework in the Solman will not be to contact the Enterprise Manager, thus no performance data will be collected.
To check the RFCs SOLMANDIAG and WEBADMIN are ok, you need to perform a Connection Test in transaction SM59.
- Tx SM59
- TCP/IP Connections
- Find SOLMANDIAG and WEBADMIN
- Perform a connection test:

1.3.2) The RFC MDX PARSER is used to render the graph in the Overview tab of the Workload Analysis application. If you cannot see performance data just in the Overview tab of the workload analysis, you should check this RFC in transaction SM59 as well. You can do a connection test as shown above. If the connection test fails for RFC MDX PARSER, check note 1032461 .
1.4) Check EFWK RESOURCE MANAGER job:
This is the central job that controls all extractors in the Solution Manager system. Make sure this job is released in transaction SM37 and it is running without issues. This job should be schedule to run every minute and only one job should be scheduled.
Job name: EFWK RESOURCE MANAGER
Program name : E2E_EFWK_RESOURCE_MGR
For more information about the Extractor Framework check the EFWK Wiki .
If you are getting issues with the EFWK, check the EFWK Troubleshooting WIKI :
2) Check Managed System Configuration
The managed system configuration for must be performed completely for the target managed systems. All steps of the managed system configuration must performed and their results must be all green.

Recheck all steps of the managed system configuration for the target system and ensure that there are no issues. Sometimes the steps/activities are marked as 'Update Needed', repeat all steps/activities marked as 'Update Needed'. What is most important:
For ABAP stack systems:
- Step 'Connect Managed Systems': Ensure that the RFCs are working correctly.
- Step 'Assign Diagnostics Agents': Ensure that all SMDAgents are connected to the Solman.
- Step 'Create Users': The user SM_ADMIN_<SolutionManager SID> is used by the SMDAgent (Wilyhost application) to collect performance data from the managed system. Ensure that user SM_ADMIN_<SolutionManager SID> has no issues, e.g. it is not locked.
- Step ''Configure Automatically': All activities within this step must finish green, especially 'Database Extractor Setup', 'Extractors Setup' and 'Introscope Host Adapter'.
- Step Configure Manually: All Mandatory steps
For JAVA stack systems:
- Step 'Assign Diagnostics Agents': Ensure that all SMDAgents are connected to the Solman.
- Step 'Create Users': The user SM_COLL<SolutionManager SID> is used to collect data from the managed system. Ensure that user SM_COLL<SolutionManager SID> has no issues, e.g. it is not locked.</p><p>
- Step ''Configure Automatically': All activities within this step must finish green, especially 'Database Extractor Setup', 'Extractors Setup', 'Introscope Host Adapter' and 'Byte Code Adapter'. After the 'Byte Code Adapter' setup, it is required to restart the JAVA stack of the managed system to start the Byte Code Adapter (ISAgent)
- Step Configure Manually: All Mandatory steps
For dual stack systems: same check all steps for ABAP and JAVA systems.
3) Check data collected by the SMDAgent (WilyHost application) and Introscope JAVA Agent (Byte Code Adapter).
Sometimes when the managed system configuration is finished, we still do get workload analysis data for the target managed system. In this case, I like to check firstly if all agents (SMDAgents and ISAgents) are running without issues for the managed system. Below, I show how to check the data collected by the agents in the Introscope Enterprise Manager.
Instances of ABAP systems:
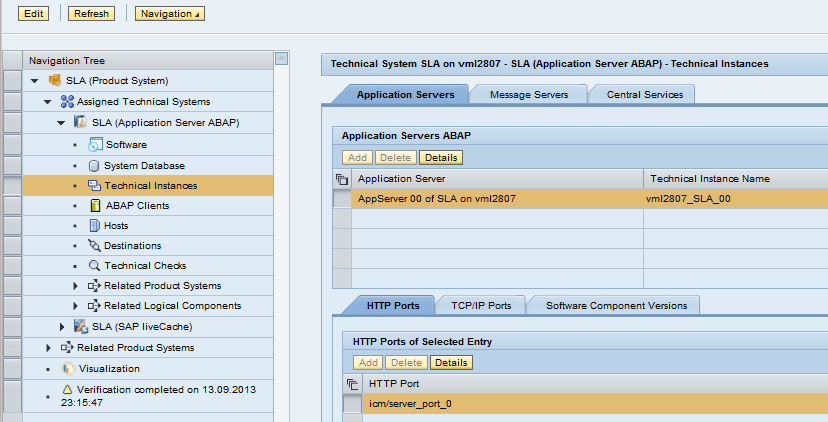
Above we can see that system SLA has only one application server of type ABAP which runs on server 'vml2807'.
Intances of JAVA systems:

Above we can see that system SLE has only one application server of type JAVA which runs on server vmw4446.
3.1) Checking data collected by the agents in the Enterprise Manager:
After we know about the managed system landscape, that is, after know all the application servers and their types. We can check the data collected by the agents in the Introscope Enterprise Manager. Almost all data collected by the SMDAgents and ISAgents are reported to the Enterprise Manager and then collected by the Solution Manager using the extractors (EFWK). When we look the Enterprise Manager directly, we can have an overview of whether the agents are collecting the data correctly or not. Below I show some examples of SMDAgents and ISAgents and the expected data in the Introscope Enterprise Manager.
N.B.: The data collected by the SMDAgents and ISAgents differ for each Product Version, below we will see examples for a certain types of systems. The nodes available in the Enterprise Manager may differ for your managed system.
To check the data collected by the SMDAgents and ISAgent we need to use the Introscope Investigator. There are two ways to start it, one using the Introscope Webview and another using the Introscope Workstation.
a) Start Introscope Workstation --> New Invetigator
b) Start Introscope Webview --> Invetigator Tab
N.B.: The data shown in the investigator may change depending on the managed system. This post is only a guidance to check your systems.
3.1.1) Expected data in the Investigator for an ABAP Instance:
When the managed system is only ABAP stack, the system needs to be monitored only by SMDAgents. Inside of the SMDAgent there is the WilyHost application which is the responsible to connect the SMDAgent to the EM and report the performance data. For each application server of the Managed System, we must see an entry in the Introscope Investigator. The below example is for system SLS which has only one application server of type ABAP running on server 'srmbrasil'. By default the wilyhost application connects to the Enterprise Manager using Process Name 'SAP HostAgent Process' and Agent Name 'SAP HostAgent <SMDAgent Instance>'.

In the picture below we can see that host 'vml2807' is available in the Investigator Tree, we can also see the SMDagent connected using the standard process and agent names.
If the entries 'SAPHostAgent Process' + 'SAP HostAgent <SMDAgent Instance>' are NOT available in the investigator, this means that the SMDAgent (WilyHost application) could not connect to the Enterprise Manager. In this case, check the file jvm_smdagent.log which is located in the work folder of the SMDAgent. This file provides information about the connection between the SMDAgent (WilyHost application) and the Enterprise Manager. If you use the SMDagents on-the-fly feature, you need to check the corresponding file jvm_smdagent_<logicalhostname>.log.
If the entries 'SAPHostAgent Process' + 'SAP HostAgent <SMDAgent Instance>' are available, then it is possible to have a look in the data collected to have an overview about the data collected.

For all ABAP systems we must see a node with the System ID for the target managed system. The performance data of the ABAP instance is displayed under this node (SID of managed system). In the example above, the System ID is SLS and the instance name is srmbrasil_SLS_00. If there are several managed systems running in the same host name, there should be one node for each managed system.
If the node with the system ID is not available, the the SMDAgent (Wilyhost application) could not start the action. This issue might happen due to several issues. In this cases, check the log SMDAgentApplication.log. This log will provide details about the issue.
For more information about the WilyHost agent check my other allam.drebes/blog/2014/05/10/introscope-host-adapter-wilyhost-agent:
3.1.2) Expected data in the Investigator for a JAVA instance:
When the managed system is only JAVA stack, the system needs to be monitored by SMDAgents and Byte Code Adapters (ISAgents). The ISAgents are necessary to monitor the managed system JVM. The idea is the same as ABAP systems, for each application server of the Managed System, we must see an entry in the Introscope Investigator. The difference in the Wily Investigator is that there will be one entry for the SMDAgents (Wilyhost application) and one entry for the ISAgents running on the managed server.
The below example is for system SLE which has only one application server of type JAVA running on server 'vmw4371'.
- By default the WilyHost application connects to the Enterprise Manager using Process Name 'SAP HostAgent Process' and Agent Name 'SAP HostAgent <SMDAgent Instance>'.
- By default the Byte Code Adapter connects to the Enterprise Manager using Process Name 'SAP Netweaver' and Agent Name <SID_of_managed_system>_<instance>_<servernode>. The ISAgents are configured to monitor the JAVA server nodes, so the instance have more than one server node you must see one entry for each server node. In this example, the managed system SLE has only one server node.

If the entries 'SAPHostAgent Process' + 'SAP HostAgent <SMDAgent Instance>' are NOT available in the investigator, this means that the SMDAgent (WilyHost application) could not connect to the Enterprise Manager. In this case, check the file jvm_smdagent.log which is located in the work folder of the SMDAgent. This file provides information about the connection between the SMDAgent (WilyHost application) and the Enterprise Manager. If you use the SMDagents on-the-fly feature, you need to check the corresponding file jvm_smdagent_<logicalhostname>.log.
If the entries 'SAPHostAgent Process' + 'SAP HostAgent <SMDAgent Instance>' are available, then it is possible to have a look in the data collected to have an overview about the data collected.

For all JAVA systems we must see a node with the System ID for the target managed system. The performance data of the JAVA instance is displayed under this node (SID of managed system). In the example above, the System ID is SLE and the instance name is vmw4371_SLE_00. If there are several managed systems running in the same host name, there should be one node for each managed system.
If the node with the system ID is not available, the the SMDAgent (Wilyhost application) could not start the action. This issue might happen due to several issues. In this cases, check the log SMDAgentApplication.log. This log will provide details about the issue.
If the entries 'SAP Netweaver' + <SID_of_managed_system>_<instance>_<servernode> are NOT available in the invstigator, this means that the Byte Code Adapter (ISAgent) could not connected to the Enterprise Manager or it is not running. In this case, check the IntroscopeAgent.log that is usually located in the temp folder of the SMDAgent \usr\sap\SMD\SMDA97\SMDAgent\temp. If you are using SMDAgents on the fly and you selected the option "Ensure HA virtualization compatibility", the logs will be probably in the managed system path ((/usr/sap/<ManagedSID>/<InstanceID>/ByteCodeAdapter).
If the IntroscopeAgent.log does not exist or is not being updated for a long period, this means that the Byte Code Adapter (ISAgent) is not running. In this case, check the results of activity Byte Code Adapter Installation in step Configure Automatically of the Managed System Configuration for the target system. The activity Byte Code Adapter Installation is responsible to deploy the ISAgent files and configure the ISAgents parameters in the manged system. If the managed system runs on a UNIX server, ensure that the OS permissions are correctly configured as described in note 1163751. Most of the cases the ISAgent cannot start due to wrong permissions at OS level. To start the Byte Code Adapter (ISAgent) it is required to restart the managed system, there is no other way to do it. The logs dev_server* and std_server* of the managed system usually show the root cause when the Byte Code Adapter (ISAgent) cannot start.
If the entries 'SAP Netweaver' + <SID_of_managed_system>_<instance>_<servernode> are available, then it is possible to have a look in the data collected to have an overview about the data collected.

The nodes displayed for the server nodes depends on the configuration performed during the Byte Code Adapter Installation in the Managed System Configuration. The performance data to be collected is configured by the Autoprobe Directive files there are selected during the Byte Code Adapter Installation. In the example above system SLE is a Portal system, this is why we see node 'SAP Portal'.
IMPORTANT: There are some known issues with ISAgent 8 and 9 which leads to missing metrics in the Workload Analysis. Refer to the following KBAs and check whether the ISAgent release that is being used is affected by the known issues:
1793553 - Few metrics are being reported for node 'SAP Netweaver' in wily due to error "/wily/core/c...
1796399 - Few metrics are being reported for node 'SAP Netweaver' in wily due to error "AutoProbe wi...
2089621 - Few metrics being reported for node "SAP Netweaver" for PI systems
3.1.3) Expected data in the Investigator for a Dual Stack system:
When the managed system is dual stack, the system needs to be monitored by SMDAgents and ISAgents. The diagnostics setup for dual stack systems have all steps of ABAP + JAVA systems. Check the sections above for each stack to troubleshoot dual stack system.
For dual stacks systems, the WilyHost Application will show the instances data together in the Wily investigator. The ABAP and JAVA instance performance data will be available under the node for the System ID. The below example shows the WilyHost Application that is monitoring a Solution Manager system running on host 'vmw4446'.

3.1.4) Host data is missin, e.g.: CPU, DISKs
If the host data is missing from the workload analysis for EWA, e.g. CPU, Disks and Memory, it is required to check if the SMDAgent (WilyHost application) is collecting the data. The host data is collected by the SMDAgent using the SAP Host Agent. The SAP Host Agent exposes some Web Services that are called by the SMDAgent to get the host performance data. For all hosts, the SAPOscol node must be available in Wily:

If the SAPOscol node is not available for the target host, this means that the SMDAgent could not connect to the SAP Host Agent. This issue can be caused by several reasons. Check section 'SAP Host Agent' of the outside discovery troubleshooting guide attached to note 1611483.
- SAP Host Agent must have the version described in note 1365123.
- The SAP host Agent porttypes are correctly configured as per note 1611483.
- SAPHostAgent trusted connection must be enabled as per note 1611483.
To check the SAP host Agent web services for a host, it is possible to access the following URLs. These URLs will return the WSDL file.
If the SAP Host Agent configuration is correct, check the SADAgentApplication.log of the affected host, this file will provide details about the issue.
4) Check Managed System Extractors
The performance data reported to the Enterprise Manager is collected by the Solution Manager system using the extractors. If the steps shows in section 3 are ok for your managed system, that is, you see the expected data for the manged system hosts/instances in Wily. Then we must check the extractors for the managed system to serach for errors.
In Solman 7.10, the extractors can be found at:
- Tx SM_WORKCENTER
- SAP Solution Manager Administration
- Infrastructure
- Framework
- Extractor Framework
In the Extractor Framework, search for the target manged system and check the status of ALL Workload analysis extractors. They must have green lights. In tab 'Extractor Log', it is possible to see the number of collected records in collumn Records.

If you find errors in the workload analysis extractors for the managed system, check the EFWK Troubleshooting WIKI. This wiki has the solution of several known issues.
These are the first steps I check when there are workload analysis issues.
I hope you enjoy this post.
You can leave questions below, I will try to answer them as soon as possible.
Thanks / Obrigado
Allam Drebes
- SAP Managed Tags:
- SAP Solution Manager
1 Comment
You must be a registered user to add a comment. If you've already registered, sign in. Otherwise, register and sign in.
Labels in this area
-
ABAP CDS Views - CDC (Change Data Capture)
2 -
AI
1 -
Analyze Workload Data
1 -
BTP
1 -
Business and IT Integration
2 -
Business application stu
1 -
Business Technology Platform
1 -
Business Trends
1,661 -
Business Trends
85 -
CAP
1 -
cf
1 -
Cloud Foundry
1 -
Confluent
1 -
Customer COE Basics and Fundamentals
1 -
Customer COE Latest and Greatest
3 -
Customer Data Browser app
1 -
Data Analysis Tool
1 -
data migration
1 -
data transfer
1 -
Datasphere
2 -
Event Information
1,400 -
Event Information
64 -
Expert
1 -
Expert Insights
178 -
Expert Insights
267 -
General
1 -
Google cloud
1 -
Google Next'24
1 -
Kafka
1 -
Life at SAP
784 -
Life at SAP
10 -
Migrate your Data App
1 -
MTA
1 -
Network Performance Analysis
1 -
NodeJS
1 -
PDF
1 -
POC
1 -
Product Updates
4,579 -
Product Updates
315 -
Replication Flow
1 -
RisewithSAP
1 -
SAP BTP
1 -
SAP BTP Cloud Foundry
1 -
SAP Cloud ALM
1 -
SAP Cloud Application Programming Model
1 -
SAP Datasphere
2 -
SAP S4HANA Cloud
1 -
SAP S4HANA Migration Cockpit
1 -
Technology Updates
6,886 -
Technology Updates
388 -
Workload Fluctuations
1
Related Content
- Workload Analysis for HANA Platform Series - 3. Identify the Memory Consumption in Technology Blogs by SAP
- AI Foundation on SAP BTP: Q1 2024 Release Highlights in Technology Blogs by SAP
- SAP Datasphere - Space, Data Integration, and Data Modeling Best Practices in Technology Blogs by SAP
- Workload Analysis for HANA Platform Series - 1. Define and Understand the Workload Pattern in Technology Blogs by SAP
- Workload Analysis for HANA Platform Series - 0. HANA Workload Analysis Overview in Technology Blogs by SAP
Top kudoed authors
| User | Count |
|---|---|
| 18 | |
| 14 | |
| 11 | |
| 10 | |
| 9 | |
| 9 | |
| 9 | |
| 9 | |
| 9 | |
| 8 |