


- SAP Community
- Products and Technology
- Technology
- Technology Blogs by SAP
- Filtering Geo Maps
Technology Blogs by SAP
Learn how to extend and personalize SAP applications. Follow the SAP technology blog for insights into SAP BTP, ABAP, SAP Analytics Cloud, SAP HANA, and more.
Turn on suggestions
Auto-suggest helps you quickly narrow down your search results by suggesting possible matches as you type.
Showing results for
Advisor
Options
- Subscribe to RSS Feed
- Mark as New
- Mark as Read
- Bookmark
- Subscribe
- Printer Friendly Page
- Report Inappropriate Content
02-24-2020
5:56 PM
In this blog we are going to insert a Geo Map and then pass parameters to the data source to filter the data that the Geo Map is consuming. Our data source is a model based on a Live Data Connection to a HANA model.
First, we will insert the following widgets:
If the mouse cursor is placed over the geo-map control, as shown below, you will see that there are no methods associated with the geo-map. This means that there may be limited interaction directly with the geo-map.
Lets assign a data source to the geo-map. I know that it is difficult to use the same source as me, but hopefully you have access to a SAC model based on a live connection to a HANA data model. In addition, you will need a model located in the SAP_BOC_SPATIAL package on the HANA server. The SAP_BOC_SPATIAL package is a special package where SAP Analytics Cloud looks for Geo Models that will supply geoCoordinates.
Now, let set the geo-map options. We start by first selecting the GMItems (geo-map), and then by clicking the Add Layer option in the Builder pane for GMItems, as shown below.
To add a data source, we will click the pencil button to the right of the No Model text in the Builder for GMItems.
Locate the SAC model that has the data for the geo-map, in my case the model is called OLR_GEO_LIFT. OLR stands for Online Retail, and LIFT is a measure of probability of the items being sold together.
Next, if the data source has Input Parameters, then you should be presented with a dialog displaying the input parameters and their default values, as shown below.
This blog is about filtering data supplied using Live Data Connection for HANA. If you did not get these dialog boxes after selecting the data source for your geo-map, then you may not be using a Live Data Connection for HANA, or the model that was selected did not have any Input Parameters. If you are unsure about parameters in Live Data Connections for HANA then, please see my blog: https://blogs.sap.com/?p=1047444 .
We will keep these default values, as they will allow the model to return data while we work on the application. Therefore, we will simply click Set.
After selecting the data source, we still won't see any action on our geo-map, because we have not assigned the Location Dimension or the measures. For the Location Dimension, in this example, we will select COUNTRY_GEO. This is basically the label that will be placed next to the bubble on the geo-map. Without this dimension, none of the bubbles will be identified.
In a bubble layer, we have two types ob bubble attributes that can reflect the measure magnitude. Bubble color and bubble size. In this example, we will select SUPPORT for bubble size. Support is a number that is less than or equal to one, and it represents the percentage of carts in the sample that contain the selected items. Bubble size will be defined by LIFT, which represents the likelihood that the items will all be placed in a cart. Please see below.
We now have data represented in GMItems.
We now want to place item descriptions in the Input Fields and filter the geo-map to display the support and lift for the inputted items. To do this, we will insert code for the third item input. We will put the code here, because three items must be entered and we will apply the filter after the third item is entered. To enter the code for the third input field, we will click the fx button that is located to the right of the InpItem_3 control in the Canvas outline.
In the onChange method, enter the following code:
When working with charts and tables, we type the name of the object, follow it by a dot, and then press the [ctrl] + [space] key combination. Then, we select get the getDataSource method that we can use to set the input parameter values, as shown below:
However, with the geo-map, we only get a few methods, and none of them are related to data sources. A person may think that since the data is related to the layer that maybe if we searched the layers methods we can find the data source there, but again we are presented with a limited number of options:
Since this is true, we will add an additional chart widget that will utilize the same data source as our geo-map. After assigning data to the chart, we will then hide the object.
Now, instead of directly manipulating the geo-map's data, we will manipulate the chart's data source, and since they are the same data source, the geo-map will also reflect the filter modifications. Modify the code in the onChange method to the following:
Let's run the application and see how it works:
As we can see from the above screenshots our filters are working great. Now, we can allow people to select filter values, and then pass those values to a Live Data Connection for HANA.
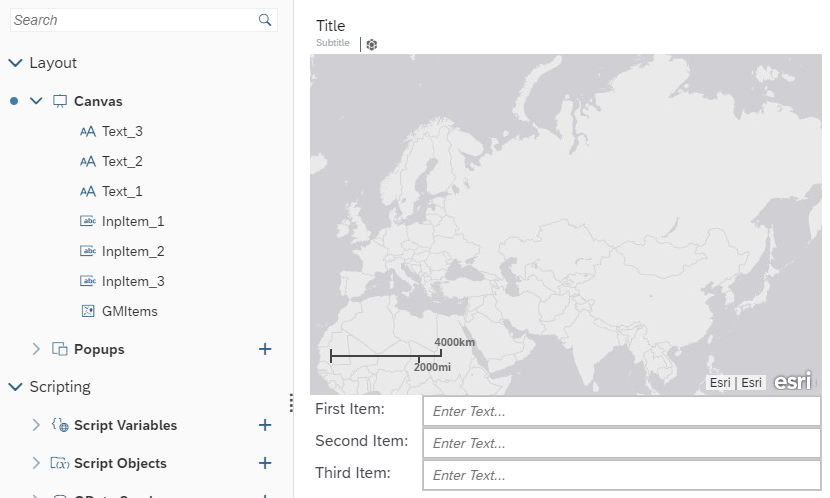
First, we will insert the following widgets:
A Geo Map
An Input Field for first filter
A second and third input field for additional filters.
Note: I also placed some text boxes for labels to identify the input fields.
If the mouse cursor is placed over the geo-map control, as shown below, you will see that there are no methods associated with the geo-map. This means that there may be limited interaction directly with the geo-map.
Note: There is no fx button that allows access to methods for geo-maps.
Lets assign a data source to the geo-map. I know that it is difficult to use the same source as me, but hopefully you have access to a SAC model based on a live connection to a HANA data model. In addition, you will need a model located in the SAP_BOC_SPATIAL package on the HANA server. The SAP_BOC_SPATIAL package is a special package where SAP Analytics Cloud looks for Geo Models that will supply geoCoordinates.
Now, let set the geo-map options. We start by first selecting the GMItems (geo-map), and then by clicking the Add Layer option in the Builder pane for GMItems, as shown below.
Note: Geo-maps can have multiple layers, but we will simply add a single layer.
To add a data source, we will click the pencil button to the right of the No Model text in the Builder for GMItems.
Locate the SAC model that has the data for the geo-map, in my case the model is called OLR_GEO_LIFT. OLR stands for Online Retail, and LIFT is a measure of probability of the items being sold together.
Next, if the data source has Input Parameters, then you should be presented with a dialog displaying the input parameters and their default values, as shown below.
Note: These default values are assigned in the Input Parameter definitions, in the HANA model.
This blog is about filtering data supplied using Live Data Connection for HANA. If you did not get these dialog boxes after selecting the data source for your geo-map, then you may not be using a Live Data Connection for HANA, or the model that was selected did not have any Input Parameters. If you are unsure about parameters in Live Data Connections for HANA then, please see my blog: https://blogs.sap.com/?p=1047444 .
We will keep these default values, as they will allow the model to return data while we work on the application. Therefore, we will simply click Set.
After selecting the data source, we still won't see any action on our geo-map, because we have not assigned the Location Dimension or the measures. For the Location Dimension, in this example, we will select COUNTRY_GEO. This is basically the label that will be placed next to the bubble on the geo-map. Without this dimension, none of the bubbles will be identified.
In a bubble layer, we have two types ob bubble attributes that can reflect the measure magnitude. Bubble color and bubble size. In this example, we will select SUPPORT for bubble size. Support is a number that is less than or equal to one, and it represents the percentage of carts in the sample that contain the selected items. Bubble size will be defined by LIFT, which represents the likelihood that the items will all be placed in a cart. Please see below.
Note: We will not add filters in this dialog, as we are going to apply them through the data source. This is more efficient, because we only have the data that is needed to populate our geo-map in our application.
We now have data represented in GMItems.
We now want to place item descriptions in the Input Fields and filter the geo-map to display the support and lift for the inputted items. To do this, we will insert code for the third item input. We will put the code here, because three items must be entered and we will apply the filter after the third item is entered. To enter the code for the third input field, we will click the fx button that is located to the right of the InpItem_3 control in the Canvas outline.
Note: For many controls when the fx button is clicked, you will be presented with a list of available methods. However, since there is only one function available for input controls, onChange, clicking the fx button will bring you into the onChange method.
In the onChange method, enter the following code:
Code: var strItem01 = InpItem_1.getValue();
var strItem02 = InpItem_2.getValue();
var strItem03 = InpItem_3.getValue();
GMItems.
Screenshot:
Note: We entered GMItems to explore the available methods for geo-maps. To see the methods, we pres [ctrl]+[space] after typing a dot after the geo-map name.
When working with charts and tables, we type the name of the object, follow it by a dot, and then press the [ctrl] + [space] key combination. Then, we select get the getDataSource method that we can use to set the input parameter values, as shown below:
However, with the geo-map, we only get a few methods, and none of them are related to data sources. A person may think that since the data is related to the layer that maybe if we searched the layers methods we can find the data source there, but again we are presented with a limited number of options:
Since this is true, we will add an additional chart widget that will utilize the same data source as our geo-map. After assigning data to the chart, we will then hide the object.
Note: The chart to the right of the geo-map utilizes the same data source as the geo-map. We will make it small, place it in a convenient location on the canvass, and then hide it.
Now, instead of directly manipulating the geo-map's data, we will manipulate the chart's data source, and since they are the same data source, the geo-map will also reflect the filter modifications. Modify the code in the onChange method to the following:
Code:
var strItem01 = InpItem_1.getValue();
var strItem02 = InpItem_2.getValue();
var strItem03 = InpItem_3.getValue();
Chart_1.getDataSource().setVariableValue("IP_SELECTED_ITEM_1", strItem01);
Chart_1.getDataSource().setVariableValue("IP_SELECTED_ITEM_2", strItem02);
Chart_1.getDataSource().setVariableValue("IP_SELECTED_ITEM_3", strItem03);
Let's run the application and see how it works:
Default View
Modified Filters
As we can see from the above screenshots our filters are working great. Now, we can allow people to select filter values, and then pass those values to a Live Data Connection for HANA.
- SAP Managed Tags:
- SAP Analytics Cloud, analytics designer
Labels:
6 Comments
You must be a registered user to add a comment. If you've already registered, sign in. Otherwise, register and sign in.
Labels in this area
-
ABAP CDS Views - CDC (Change Data Capture)
2 -
AI
1 -
Analyze Workload Data
1 -
BTP
1 -
Business and IT Integration
2 -
Business application stu
1 -
Business Technology Platform
1 -
Business Trends
1,658 -
Business Trends
91 -
CAP
1 -
cf
1 -
Cloud Foundry
1 -
Confluent
1 -
Customer COE Basics and Fundamentals
1 -
Customer COE Latest and Greatest
3 -
Customer Data Browser app
1 -
Data Analysis Tool
1 -
data migration
1 -
data transfer
1 -
Datasphere
2 -
Event Information
1,400 -
Event Information
66 -
Expert
1 -
Expert Insights
177 -
Expert Insights
297 -
General
1 -
Google cloud
1 -
Google Next'24
1 -
Kafka
1 -
Life at SAP
780 -
Life at SAP
13 -
Migrate your Data App
1 -
MTA
1 -
Network Performance Analysis
1 -
NodeJS
1 -
PDF
1 -
POC
1 -
Product Updates
4,577 -
Product Updates
342 -
Replication Flow
1 -
RisewithSAP
1 -
SAP BTP
1 -
SAP BTP Cloud Foundry
1 -
SAP Cloud ALM
1 -
SAP Cloud Application Programming Model
1 -
SAP Datasphere
2 -
SAP S4HANA Cloud
1 -
SAP S4HANA Migration Cockpit
1 -
Technology Updates
6,873 -
Technology Updates
420 -
Workload Fluctuations
1
Related Content
- How can I use view permissions to link a dashboard filter to a specific user? in Technology Q&A
- CPI Mapping condition issue in Technology Q&A
- HANA DB usage of JSON embedded functions in Technology Q&A
- Infix filters in CAP Node.js not working in Technology Q&A
- RAP: VH filter on child lvl based on value from parent entity in Technology Q&A
Top kudoed authors
| User | Count |
|---|---|
| 37 | |
| 25 | |
| 17 | |
| 13 | |
| 7 | |
| 7 | |
| 7 | |
| 6 | |
| 6 | |
| 6 |