
- SAP Community
- Products and Technology
- Technology
- Technology Blogs by SAP
- SAP Datasphere Analytic Model Series Blog Post # 1...
Technology Blogs by SAP
Learn how to extend and personalize SAP applications. Follow the SAP technology blog for insights into SAP BTP, ABAP, SAP Analytics Cloud, SAP HANA, and more.
Turn on suggestions
Auto-suggest helps you quickly narrow down your search results by suggesting possible matches as you type.
Showing results for
Product and Topic Expert
Options
- Subscribe to RSS Feed
- Mark as New
- Mark as Read
- Bookmark
- Subscribe
- Printer Friendly Page
- Report Inappropriate Content
05-24-2023
7:51 AM
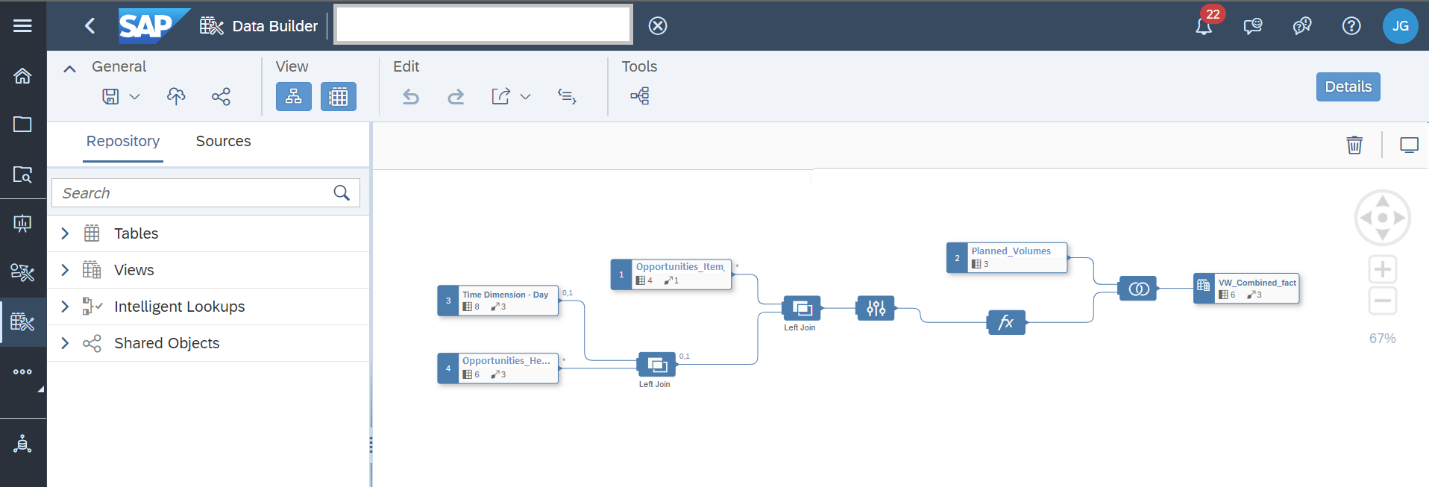
Figure 1: Multi-fact Model Overview

Introduction
The SAP Datasphere Analytic Model Series is intended to provide you with useful guidance on how to utilize the new Analytic Model to leverage the potential of your data landscape. The Analytic Model allows for rich analytical modelling in a targeted modelling environment and will be THE go-to analytic consumption entity for SAP Datasphere.
This article shows the alternative way of creating and using Multi fact dimensions in Analytic model within Datasphere. Currently, multi-fact is supported within fact models in Business Layer in Datasphere and we plan to have the similar functionality available for Analytic models in future as well.
For time being, users waiting for this functionality in Analytic Models, can follow the alternate approach highlighted in this article.
This article is part of the blog post series listed below:
- Blog Post #1: Introducing the Analytic Model in SAP Datasphere
- Blog Post #2: Data Model Introduction
- Blog Post #3: Motivation & Comparison with the Analytical Dataset
- Blog Post #4: SAP Datasphere Analytic Model Series – Calculated and Restricted Measures
- Blog Post #5: Exception Aggregation
- Blog Post #6: Using Variables in Analytic Model
- Blog Post #7: Time Dependency for Dimensions and Texts in Analytic Model
- Blog Post #8:SAP Datasphere Analytic Model Series – Data Preview
- Blog Post #9:SAP Datasphere Analytic Model Series – User Experience and Navigation Paradigm | SAP Blogs
- Blog Post #10: SAP Datasphere Analytic Model Series Blog 10– Design Multi Fact in Analytic Model (Current Blog)
What is Multi-fact?
In layman's terms, the concept of multi-fact is to combine 2 or more facts with the same dimensions for reporting in the data warehouse.
The concept is similar to Multi-provider in Business Warehouse. Now if you are not familiar with BW, then don’t panic. In simple terms, here, we will do a union on two datasets having different facts and then associate the union output to the same dimensions.
The advantage of using multi-fact is that it helps us in streamlining reporting KPI from different facts by linking them to the same dimension. A classic example is to report on Plan and Actuals data at the same time. These always reside in different data sources, but they can obviously be brought together over some albeit not all their dimensions. So, Planning might happen by country, quarter & product category, but Actuals might be daily sales of products within those product categories in stores located within those countries.
As a more complex example, you can picture headcount reporting in HR. While current and last year’s personnel details might be in the same sources (but don’t have to be), you still might want to include data on hires & terminations, open positions, and internal movements to get a wholistic picture.
Currently, the business layer of SAP Datasphere allows you to model these facts independently and then bring them together in an entirely model-driven approach.

Figure 2 : Multi-Fact Model with Plans and Actuals in the Business Layer
While, we don’t have this functionality yet in the Analytic Model, you can still achieve the same through sql view modelling in graphical or SQL views of the Data Layer
Modelling Scenario
Let say, I am a consultant looking for insights on how my product forecast is behaving in comparison to the revenue generated by the sales opportunities across products within a company. For my requirements, I would like to combine the Opportunity Actuals data from the ERP system with the Plan data for the Targets maintained in the CSV files.
My Actuals data consists of tables – Opportunities_Item, Opportunities_Header table and Plan data consists of file Planned_Volumes, which is loaded into the Datasphere in the form of tables.
- Opportunities_Item
Columns: ID -> This is line-item ID, Opportunity-> This is Opportunity ID, ProductId, Value.
- Opportunities_Header
Columns: ID -> This is Opportunity ID , SalesOrg, ExpectedClosingDate, Status, Responsible, Customer
- Planned_Volumes
Columns: ID -> This is ProductID, Quarter, Target_Volume.
The Actuals tables relationship will look like as something shown below.
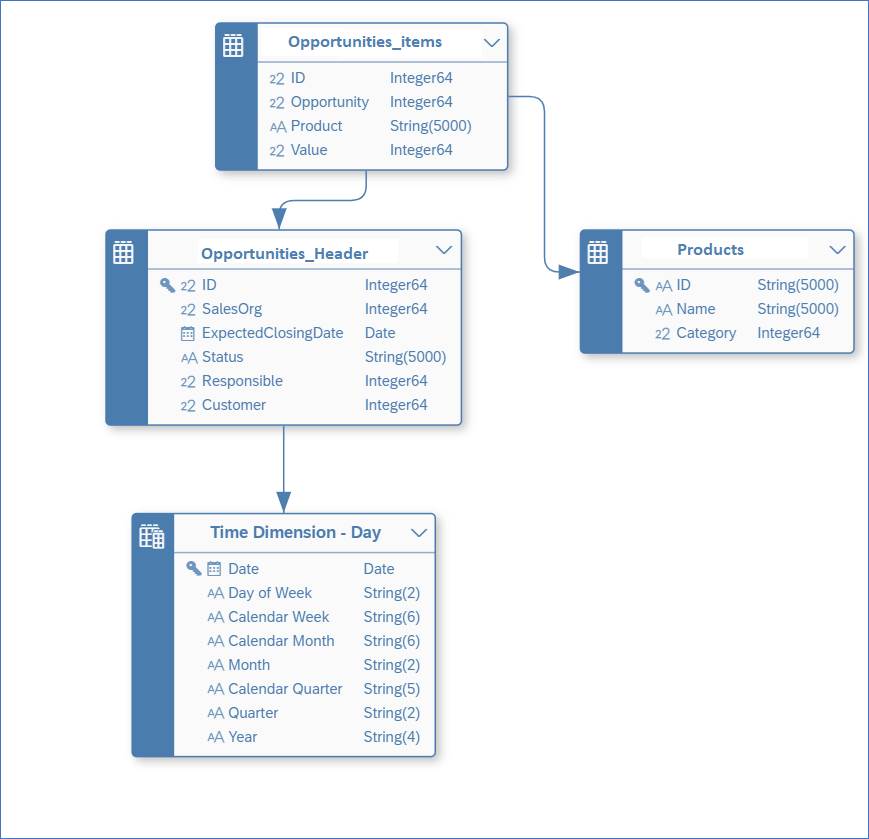
Figure 3: Actuals Tables Relationship
Here, I have associated Actuals, with Time dimension to get the quarter information . I need this as Plan data is showing target volumes across quarter for each product, whereas, in my Actuals, booking is happening for product at date level. Further, I have linked product dimension to both my Actuals and Plans to get more details regarding the Product.
The Plan tables relationship will look like below:

Figure 4: Plan Tables Relationship
From above table relationships, we can use Productid and Quarter to link Plan and Actuals to common dimensions Product and Time respectively for building a Multi-fact in DS, as shown below.

Figure 5: Multi-Fact Tables Relationship
In next section, I will describe the steps on how we can build a Multi-fact.
Modelling Steps
1. As a first step, I choose to Create Time Tables and Dimensions using default options at space level, as shown The time dimension will be used later in step 3&4 to join it with the Actuals data and retrieve the Quarter information.
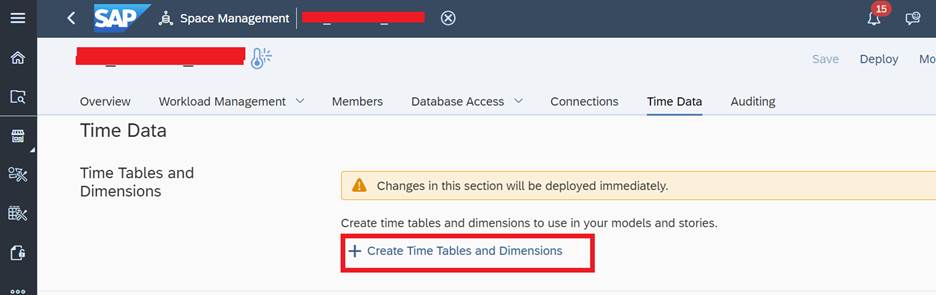
Figure 6: Enable Time dimensions in the space
2. Next, I went to graphical view designer in the Data builder layer and clicked on New Graphical view.

Figure 7: Create Graphical View
3. In my new view, first I did a left join between my table Opportunities_Header with the generated ‘Time Dimension – Day’ view, generated from step 1 using columns ‘Expected closing date’ and ‘Date’ to get the Quarter information.

Figure 8: Actuals Data Modelling 1
4. Then, I did a left join between table Opportunities_Item and the intermediate result from step 3 on column OpportunityID to add the Calendar Quarter attribute and make it available alongside product from the Opportunities_Item table.

Figure 9: Actuals Data Modelling 2
5. Afterwards, I did a union and combine the output from above step with the Planned_Volumes table, as shown below.

Figure 10: Union Plan Mapping

Figure 11: Union Actuals Mapping
6. Subsequently, I changed the view semantic type to Analytical Dataset(ADS) and changed the columns - Value and TargetVolume semantics to Measures.

Figure 12: Change View to ADS
7. Then I created the associations in the ADS to link the related dimensions Products and Time Dimension – Quarter view.

Figure 13: Associate Product and Time dimension Quarter
8. Finally, I created the Analytic Model on top of the ADS.

Figure 14: AM Design
9. Finally, I can compare the Planned Targets data with Actuals for each quarter in AM Data preview, as shown below.
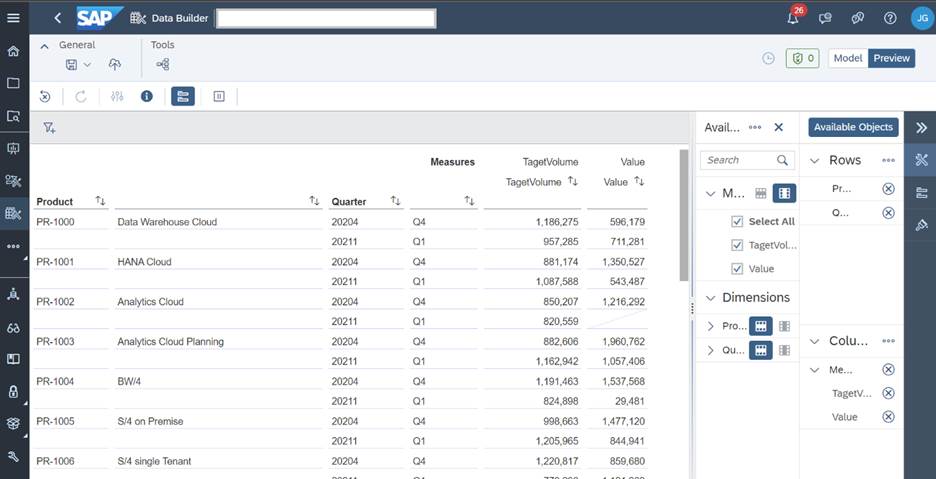
Figure 15: AM Data preview
Also, I could have created a Calculated measure in AM to calculate the variance between my Plan and Actuals but that is something I would like you to explore on your own. If needed, please refer the blog SAP Datasphere Analytic Model Series – Calculated and Restricted Measures.
Conclusion
This blog introduced you to the alternate way of building the Multi-fact scenario in Datasphere using the Data Builder.
Thanks for reading! I hope you find this blog helpful. For any questions or feedback just leave a comment below this post. Feel free to also check out the other blog posts in the series.
Best wishes,
Jai Gupta
Further Links

Find more information and related blog posts on the topic page for SAP Datasphere .
- SAP Managed Tags:
- SAP Datasphere
Labels:
2 Comments
You must be a registered user to add a comment. If you've already registered, sign in. Otherwise, register and sign in.
Labels in this area
-
ABAP CDS Views - CDC (Change Data Capture)
2 -
AI
1 -
Analyze Workload Data
1 -
BTP
1 -
Business and IT Integration
2 -
Business application stu
1 -
Business Technology Platform
1 -
Business Trends
1,661 -
Business Trends
88 -
CAP
1 -
cf
1 -
Cloud Foundry
1 -
Confluent
1 -
Customer COE Basics and Fundamentals
1 -
Customer COE Latest and Greatest
3 -
Customer Data Browser app
1 -
Data Analysis Tool
1 -
data migration
1 -
data transfer
1 -
Datasphere
2 -
Event Information
1,400 -
Event Information
65 -
Expert
1 -
Expert Insights
178 -
Expert Insights
280 -
General
1 -
Google cloud
1 -
Google Next'24
1 -
Kafka
1 -
Life at SAP
784 -
Life at SAP
11 -
Migrate your Data App
1 -
MTA
1 -
Network Performance Analysis
1 -
NodeJS
1 -
PDF
1 -
POC
1 -
Product Updates
4,577 -
Product Updates
330 -
Replication Flow
1 -
RisewithSAP
1 -
SAP BTP
1 -
SAP BTP Cloud Foundry
1 -
SAP Cloud ALM
1 -
SAP Cloud Application Programming Model
1 -
SAP Datasphere
2 -
SAP S4HANA Cloud
1 -
SAP S4HANA Migration Cockpit
1 -
Technology Updates
6,886 -
Technology Updates
408 -
Workload Fluctuations
1
Related Content
- SAP Analytics Cloud - Performance statistics in Technology Blogs by SAP
- SAP Analytics Cloud for planning - Resource Issue for Data Action in Technology Q&A
- I cannot cancel an import in SAP Analytics Cloud from SAP Hana. in Technology Q&A
- Consolidation Extension for SAP Analytics Cloud – Automated Eliminations and Adjustments (part 1) in Technology Blogs by Members
- 10+ ways to reshape your SAP landscape with SAP Business Technology Platform – Blog 4 in Technology Blogs by SAP
Top kudoed authors
| User | Count |
|---|---|
| 13 | |
| 10 | |
| 10 | |
| 9 | |
| 8 | |
| 7 | |
| 6 | |
| 5 | |
| 5 | |
| 5 |