
- SAP Community
- Products and Technology
- Enterprise Resource Planning
- ERP Blogs by SAP
- Analyze the Processing of Outgoing Payment Files f...
Enterprise Resource Planning Blogs by SAP
Get insights and updates about cloud ERP and RISE with SAP, SAP S/4HANA and SAP S/4HANA Cloud, and more enterprise management capabilities with SAP blog posts.
Turn on suggestions
Auto-suggest helps you quickly narrow down your search results by suggesting possible matches as you type.
Showing results for
Advisor
Options
- Subscribe to RSS Feed
- Mark as New
- Mark as Read
- Bookmark
- Subscribe
- Printer Friendly Page
- Report Inappropriate Content
05-15-2023
8:04 AM

Payment formats requirements can vary across different banks. In order to meet these requirements, customers are generally expected to either customize an existing SAP pre-delivered format mapping template or create a new format mapping from scratch.
When an error arises in the output file, identifying the cause of the error can be challenging. However, a solution is now available. With the launch of SAP S/4HANA Cloud 2302, we are introducing a new application called "Trace Outgoing Format Mappings".
More information about Trace Outgoing Format Mappings can be found on SAP Help Portal.
Trace Outgoing Format Mappings
"Trace Outgoing Format Mappings" is designed to assist you in analyzing common issues encountered during format mapping creation or modification. Are you puzzled about missing nodes or levels in the output file? Perplexed by mapped values being in an unexpected format? Curious to understand the internal processing of conditions? "Trace Outgoing Format Mappings" is the solution that can provide you with the answers you seek.
How It Works in a Nutshell
As you may be aware, the inner workings of the output file generation process in "Map Format Data" engine remain hidden from the user's view. Users are only aware of the inputs (structures) and outputs (files). However, we opened the process with the "Trace Outgoing Format Mappings".
With this tool, users now have the ability to designate specific nodes or the entire format mapping for tracing. By doing so, an extensive XML-formatted "Trace Log" is generated alongside the output file. Once the file generation process ends, the "Trace Log" is stored in the database. But we didn't stop there.
"Trace Outgoing Format Mappings" app interprets the XML "Trace Log", presenting it to the user in an interactive and user-friendly manner.
1. Set - Enabling Tracing for Your Format Mapping
To enable tracing functionality:
- Go to Map Format Data for Payments* via CBC or Manage Your Solution.
- In the list, select a format mapping you want to trace.
- In the detail, right click either on the "Format Mapping Properties" to enable tracing for whole format mapping or right click on a certain node to enable tracing of the selected node only. Click on "Set Tracepoint" button in the context menu to activate the tracing.
*Tracing is also available in Map Format Data for Treasury Correspondence and Map Format Data for Advanced Payment Management
Tracepoint will be active for 5 days for the user who set it.


You can set Tracepoint for the entire format mapping (left) or for a single node (right).
2. Run - Execution
Tracing is a user specific feature. Next time the same user executes the payment run (or generally speaking - when the format mapping is used to generate a file) the "Trace Log" is generated alongside the output file.
3. Analyze - Use the "Trace Outgoing Format Mappings" app
In this part of the article, you will learn how to access the app and how you can use it to analyze the file generation process of the Map Format Data.
Accessing the App
You can access the application via Map Format Data either directly from the list or from a certain format mapping's detail.

To access the app from the list select the format mapping and click the "Trace" button above the table.

To access the app from the detail, use the "Trace" button in the top right corner.
The Initial Screen of "Trace Outgoing Format Mappings"
The initial screen of the app contains all the logs that were generated for the selected format mapping and on behalf of the logged in user.
As a user you can display certain log by selecting it from the list and by using the "Display" button above the table. You can also perform deletion of "Trace Logs" as well as import "Trace Log" from another system/client.
Table records themselves contain general data about stored "Trace Logs" like Mapping Type ID, Format Mapping Name, date and time of the log creation, etc.

The initial screen of Trace Outgoing Format Mappings.
The Detail
Once a specific "Trace Log" is opened, the user is presented with its detail. This view closely resembles the layout of the Map Format Data, but instead of displaying the format mapping definition, it showcases a comprehensive log of the mapping performed within the "Map Format Data" engine.
The left side of the screen presents a tree structure that showcases all the nodes marked with tracepoints, precisely reflecting the order in which they were processed by the engine. Additionally, it displays any repeated occurrences (loops) within the format mapping processing.
On the right side of the screen, you can see the captured data from the engine run. The content varies depending on the specific node type being selected on the left side, providing tailored information about selected node.

The detail of Trace Outgoing Format Mappings.
The Main Node

Tracing General Data node provides basic information about the trace (engine run).
In addition to providing essential details such as Mapping Type ID and Format Mapping Name, users can also access the "Statistics" section to evaluate the efficiency of file generation using "Map Format Data" engine.
Below the statistics, you can find a table called "Skipped Data", which shows the skipped keys of input data. In Map Format Data, users can define key fields for specific levels, enabling the generation of iterations over these levels. The number of unique keys corresponds to the number of repetitions of the level in the output file.
Based on customer feedback, we have observed instances where certain iterations are missing in the output file. In the majority of cases, this issue stems from incorrectly defined key fields, often associated with length and offset configurations. When the "Map Format Data" engine iterates more than once over the same key, the extra occurrence is skipped. This event is reflected in the "Trace Outgoing Format" by the red highlight of the "Trace General Data" node and it is presented in the respective "Skipped Data" table as on the screenshot below.
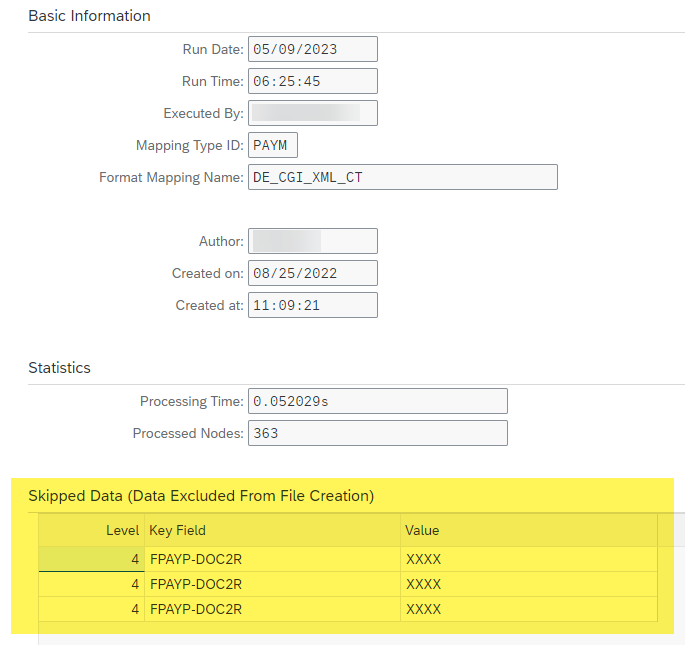
Skipped Data Table displays three repetitions of the same key.
Analyzing Conditions
The engine processes the conditions in a recursive manner, and the application provides visibility into this process through a condition evaluation tree. Each line in the tree begins with a green or red icon, signifying the result of the partial expression. Logical operators such as AND or OR evaluate two expressions beneath them in the hierarchy.
Continuing along each line, the data sources being compared are displayed, for example, "Constant = Structure Field." Finally, the line concludes with the actual values of the data sources being compared, such as "1 = 2." This detailed breakdown allows you to analyze the condition evaluation in a clear and informative manner.
Let's use SAP delivered template DE_CGI_XML_CT as an example. On the node Othr (N_8655981910) there is a following condition defined (please note: Type 2 is a Structure Field, Operator (<>) means Not equal to and Type 1 is a Constant):

Condition on Othr node (N_8655981910) in the format mapping DE_CGI_XML_CT
Let's assume that in our payment run we won't provide Additional Company code parameter - CGIIR (FPAYHX-REF12+030(10)), but we will provide "Customer ID at House Bank" (FPAYHX-DTKID). In such case the condition will be evaluated as "true". You can see the breakdown in the picture bellow.

Example of condition evaluation that was successful.
Another case might be that we will provide "SWIFT" constant in Additional Company code parameter - CGIIR (FPAYHX-REF12+030(10)). As you can see in the picture below, the first part of the condition fails, because it accepts everything, but SWIFT, hence the whole condition is evaluated as "false".

Example of condition evaluation that failed.
Analyzing Mapping
The mapping section is visible on all nodes that perform mapping – Element, Technical Node, XML Attribute, and Atom. It provides you with an insight on how the value was processed internally. It all starts with the value of the source field (Input Value). Then, as you can see from the screenshot below, Trace Outgoing Format Mappings app provides you with all important values from the value conversion perspective – length, target offset, and conversion function. Also, it can show you the internal type in which the value was processed (Output Value).
The last field in this section is “Output Value”, which is the input value after applying all conversions (length, target offset, conversion function).

Mapping Information: Conversion of the input value according to the conversion function
Analyzing Aggregations
From the standpoint of the Map Format Data engine, aggregations are calculated on the node where the value is being mapped from the input data (source node for aggregation). The value is then referred on the node where the user selected the aggregation to be outputted (target node for aggregation). In the "Trace Outgoing Format Mappings" you can see how the aggregation was calculated on every so-called source node for aggregation.

Example of aggregations in Trace Outgoing Format Mappings
Wrap-up
Configuration of a format mapping in Map Format Data can be tricky but the "Trace Outgoing Format Mappings" app is here to help you with the analysis of the format mapping behavior. As we have learned above, the application can be used for the analysis of conditions, aggregations, mapping procedures, and the overall process of file generation (loops, missing data, etc.).
If you have any questions about this new tool, you can use the Q&A area. You are welcome to provide feedback in the comment section below.
- SAP Managed Tags:
- SAP S/4HANA Cloud Localization,
- SAP Payment Engine,
- SAP S/4HANA Finance,
- SAP S/4HANA Public Cloud,
- Localization
Labels:
You must be a registered user to add a comment. If you've already registered, sign in. Otherwise, register and sign in.
Labels in this area
-
Artificial Intelligence (AI)
1 -
Business Trends
363 -
Business Trends
21 -
Customer COE Basics and Fundamentals
1 -
Digital Transformation with Cloud ERP (DT)
1 -
Event Information
461 -
Event Information
24 -
Expert Insights
114 -
Expert Insights
152 -
General
1 -
Governance and Organization
1 -
Introduction
1 -
Life at SAP
415 -
Life at SAP
2 -
Product Updates
4,685 -
Product Updates
206 -
Roadmap and Strategy
1 -
Technology Updates
1,502 -
Technology Updates
87
Related Content
- The Role of SAP Business AI in the Chemical Industry. Overview in Enterprise Resource Planning Blogs by SAP
- Introducing the market standard of electronic invoicing for the United States in Enterprise Resource Planning Blogs by SAP
- How to track exchange rates for outgoing payment in different currency? in Enterprise Resource Planning Q&A
- How to Set Up Approval Workflows for Supplier Down Payment Requests in Enterprise Resource Planning Blogs by SAP
- Deep Dive into SAP Build Process Automation with SAP S/4HANA Cloud Public Edition - Retail in Enterprise Resource Planning Blogs by SAP
Top kudoed authors
| User | Count |
|---|---|
| 7 | |
| 5 | |
| 4 | |
| 3 | |
| 3 | |
| 3 | |
| 3 | |
| 2 | |
| 2 | |
| 2 |