
- SAP Community
- Products and Technology
- Technology
- Technology Blogs by SAP
- GC analysis and troubleshooting with SapMachine
Technology Blogs by SAP
Learn how to extend and personalize SAP applications. Follow the SAP technology blog for insights into SAP BTP, ABAP, SAP Analytics Cloud, SAP HANA, and more.
Turn on suggestions
Auto-suggest helps you quickly narrow down your search results by suggesting possible matches as you type.
Showing results for
Advisor
Options
- Subscribe to RSS Feed
- Mark as New
- Mark as Read
- Bookmark
- Subscribe
- Printer Friendly Page
- Report Inappropriate Content
05-05-2023
3:44 PM
There are several possibilities to analyze and troubleshoot GC issues. You can activate the gc log via Unified JVM logging(-Xlog:gc) to get a textual log output. This can be also set for detailed GC phases and to specific levels. The analysis can be done on the textual log file or with available open source tools like JIFA or commercial tools like GCeasy to parse and analyze the log and visualize the findings.
Another possibility is to use the Java Flight Recorder (JFR) to profile your Java application and analyze this with Java Mission Control (JMC).
We, from SapMachine development team, build and provide also a JMC version on SapMachine.
The SapMachine starting with 11.0.19 and 17.0.7 provides two additional Flight Recording configurations(located in the directory lib/jfr of the JDK/JRE), especially for GC profiling.
The gc.jfc, which is a lightweight GC profiling. This can be used also for longer profiling runs and will provide general GC profiling data with limited details and small recording size.
The gc_details.jfc will record all GC events and details. This will have a higher impact caused by heap inspection initiated GCs to get e.g. heap statistics and have a large recording size.
In general there are three ways to do the recording:
In addition JMC is providing specific Outlines e.g. Java Application, JVM Internals, Environment and the Event Browser. The Outlines will show the specific data in tables or graphs.
With the additional JFR configurations the SapMachine provides, general GC analysis with low overhead and also details GC analysis is possible out of the box as the configurations are delivered with the SapMachine.
In case of questions about the usage of JFR and JMC for GC analysis or other profiling don't hesitate to contact me and any feedback about this post is very welcome.
References:
Ask questions about SAP Java Virtual Machine and follow (https://answers.sap.com/tags/01200615320800003576)
Read other SAP Java Virtual Machine blog posts and follow (https://blogs.sap.com/tags/01200615320800003576/)
Another possibility is to use the Java Flight Recorder (JFR) to profile your Java application and analyze this with Java Mission Control (JMC).
We, from SapMachine development team, build and provide also a JMC version on SapMachine.
SapMachine will provide two additional Flight Recording configurations
The SapMachine starting with 11.0.19 and 17.0.7 provides two additional Flight Recording configurations(located in the directory lib/jfr of the JDK/JRE), especially for GC profiling.
The gc.jfc, which is a lightweight GC profiling. This can be used also for longer profiling runs and will provide general GC profiling data with limited details and small recording size.
The gc_details.jfc will record all GC events and details. This will have a higher impact caused by heap inspection initiated GCs to get e.g. heap statistics and have a large recording size.
How to do the JFR profiling:
In general there are three ways to do the recording:
- The Flight Recording can be enabled by JVM parameter to start this with the startup already(-XX:StartFlightRecording). Per option you can specify the filename to be used to save the recording and you can specify the settings/configuration file.
E.g. -XX:StartFlightRecording,filename=./my_recording.jfr,settings=gc_details.jfc - Start the Flight Recorder via jcmd. Connect to the running Java application(jcmd <main class|PID>) and start/dump/stop the recording by specific command(JFR.start, JFR.dump, JFR.stop). You can specify the recording name, settings(configuration), etc. Check the help of the commands to get all available options.
In SAP BTP you have to enable ssh in CF first to call the jcmd via cf ssh.
E.g.:
cf ssh <your app name> -c "app/META-INF/.sap_java_buildpack/sap_machine_jre/bin/jcmd $(pgrep java) JFR.start name=gc_recording settings=gc_details.jfc filename=/home/vcap/tmp/gc.jfr"
- Connect with JMC to a running local or remote Java application to start/dump/stop the recording without restart. You have to open JMX protocol listener. This can be done with e.g. jcmd <main class|PID> ManagementAgent.start jmxremote.authenticate=false jmxremote.ssl=false jmxremote.port=5555.
If you want to profile a Java application running behind a firewall you may need port forwarding.
In SAP BTP you have to start your app with -Djava.rmi.server.hostname=127.0.0.1 and start the Management Agent via cf ssh and use a ssh tunnel. E.g.:
cf ssh <your app name> -c "app/META-INF/.sap_java_buildpack/sap_machine_jre/bin/jcmd $(pgrep java) ManagementAgent.start jmxremote.authenticate=false jmxremote.ssl=false jmxremote.port=5555 jmxremote.rmi.port=5555"
cf ssh <your app name> -N -T -L 5555:127.0.0.1:5555
Connect with JMC to 127.0.0.1:5555 to get the JMX Console or starting the Flight Recording.
Note:
Depending on what your SapMachine is using (JRE or JDK), specify the path accordingly (sap_machine_jre or sap_machine_jdk). To learn more, see: SapMachine.
How to analyze the JFR recording:
The collected jfr recording can be analyzed with JMC. Open the JFR recording file to get the Automated Analysis Results as a first overview.
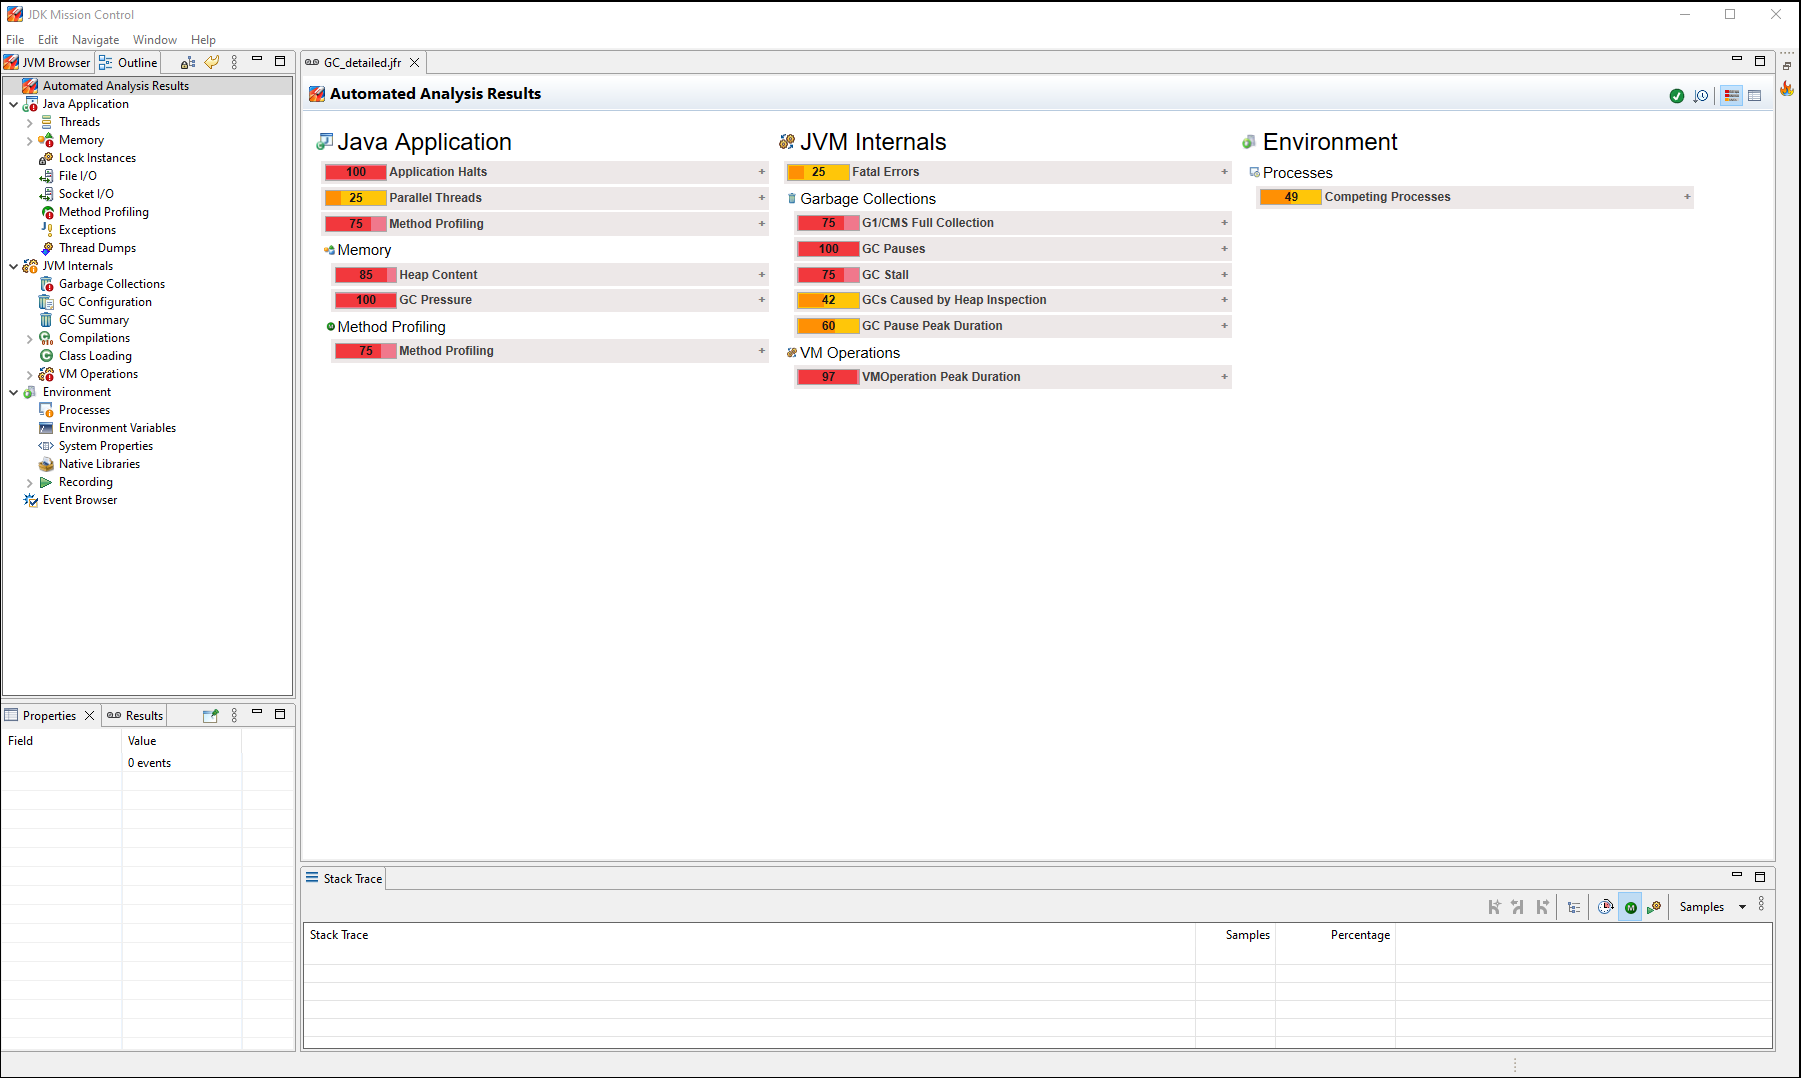
Figure 1: Analysis overview
The provided findings can be expanded to get more details with hints for optimization.

Figure 2: Expanded analysis details with hints for optimization
In addition JMC is providing specific Outlines e.g. Java Application, JVM Internals, Environment and the Event Browser. The Outlines will show the specific data in tables or graphs.
In JVM Internals you will find the GC Summary with average, maximum, total GC times of the collections:

Figure 3: GC summary
The GC configuration details:
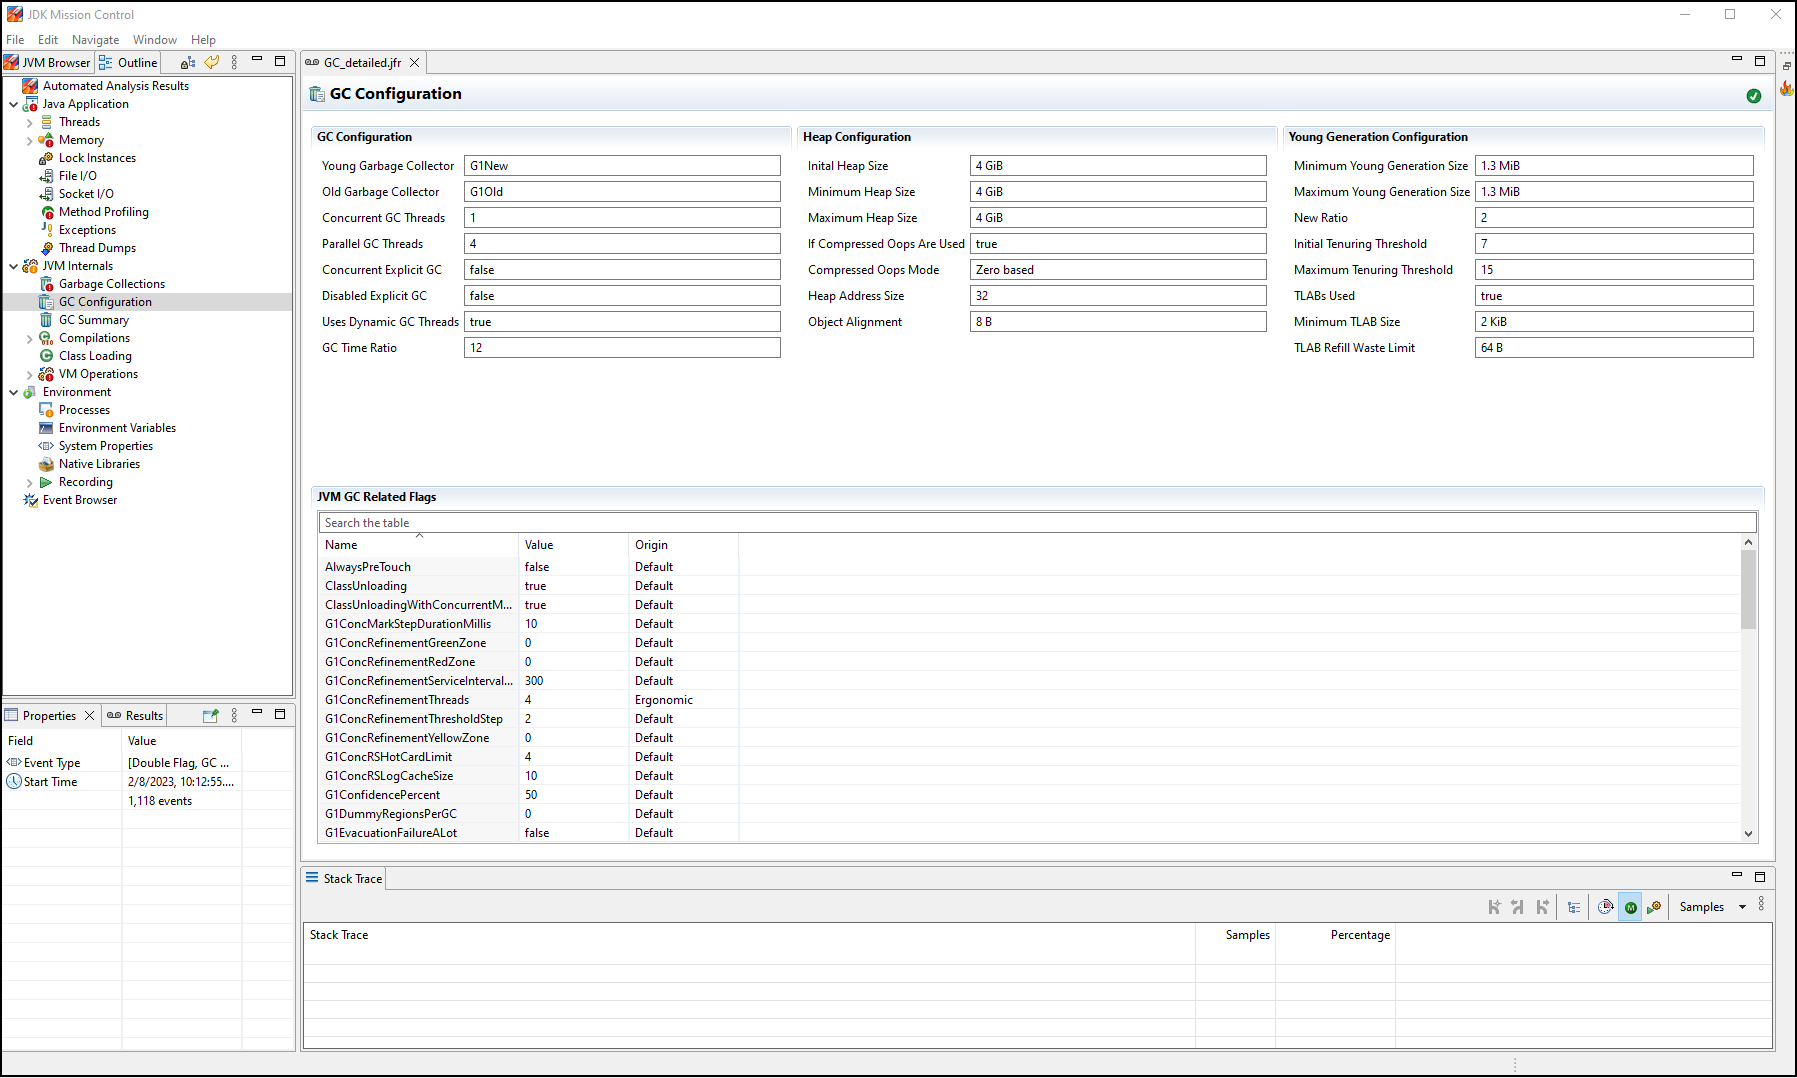
Figure 4: The GC configuration details
The Garbage Collections with the GC details:

Figure 5: Garbage collection details
Depending of the enabled events in the used JFR configuration, the table will show some or all the GC Phase Pause Levels with detailed pause time.
All collected events can be found in the Event Browser:

Figure 6: Event Browser
There you can also create your own specific outlines/pages for events your are interested in and no outline exists already. In addition you can create outlines/pages for your own custom events.
Conclusion
With the additional JFR configurations the SapMachine provides, general GC analysis with low overhead and also details GC analysis is possible out of the box as the configurations are delivered with the SapMachine.
In case of questions about the usage of JFR and JMC for GC analysis or other profiling don't hesitate to contact me and any feedback about this post is very welcome.
References:
Ask questions about SAP Java Virtual Machine and follow (https://answers.sap.com/tags/01200615320800003576)
Read other SAP Java Virtual Machine blog posts and follow (https://blogs.sap.com/tags/01200615320800003576/)
- SAP Managed Tags:
- SAP Java Virtual Machine
Labels:
You must be a registered user to add a comment. If you've already registered, sign in. Otherwise, register and sign in.
Labels in this area
-
ABAP CDS Views - CDC (Change Data Capture)
2 -
AI
1 -
Analyze Workload Data
1 -
BTP
1 -
Business and IT Integration
2 -
Business application stu
1 -
Business Technology Platform
1 -
Business Trends
1,661 -
Business Trends
88 -
CAP
1 -
cf
1 -
Cloud Foundry
1 -
Confluent
1 -
Customer COE Basics and Fundamentals
1 -
Customer COE Latest and Greatest
3 -
Customer Data Browser app
1 -
Data Analysis Tool
1 -
data migration
1 -
data transfer
1 -
Datasphere
2 -
Event Information
1,400 -
Event Information
65 -
Expert
1 -
Expert Insights
178 -
Expert Insights
280 -
General
1 -
Google cloud
1 -
Google Next'24
1 -
Kafka
1 -
Life at SAP
784 -
Life at SAP
11 -
Migrate your Data App
1 -
MTA
1 -
Network Performance Analysis
1 -
NodeJS
1 -
PDF
1 -
POC
1 -
Product Updates
4,577 -
Product Updates
330 -
Replication Flow
1 -
RisewithSAP
1 -
SAP BTP
1 -
SAP BTP Cloud Foundry
1 -
SAP Cloud ALM
1 -
SAP Cloud Application Programming Model
1 -
SAP Datasphere
2 -
SAP S4HANA Cloud
1 -
SAP S4HANA Migration Cockpit
1 -
Technology Updates
6,886 -
Technology Updates
408 -
Workload Fluctuations
1
Related Content
- ABAP Cloud Developer Trial 2022 Available Now in Technology Blogs by SAP
- SAP Datasphere - Space, Data Integration, and Data Modeling Best Practices in Technology Blogs by SAP
- Comparing Workflow Templates in SAP in Technology Blogs by Members
- Real-Time Scenario Challenges and Solutioning for Action within Automation using S/4HANA On-Premise in Technology Blogs by Members
- sap system issue analysis by kernel snapshot analyzer tool in Technology Blogs by Members
Top kudoed authors
| User | Count |
|---|---|
| 13 | |
| 11 | |
| 10 | |
| 9 | |
| 9 | |
| 7 | |
| 6 | |
| 5 | |
| 5 | |
| 5 |