Introduction
User adoption is a hot topic where I am working. We are following the usual user adoption metrics but we wanted to take it one step further. The data source Response Time Analysis [COD_RESP_TIME_ANA] is only containing the last 30 days data. If you have a high number of usage or a large number of interactions (>250k records) it can be challenging to do any meaningful analysis on usage of the system.
Understanding not just what objects users are creating (opportunities, Leads, Visits) but HOW they are using the system can give us some great insight into areas of improvement or help us prioritise where we put our efforts.
Objective of this blog
Show how to Expose this data source to an external BI Solution (example: Snowflake).
Show examples of reports built in Power BI.
Expose the Data source to your external BI Solution
Navigate to Business Analytics > Design Data Sources. Select the data source COD_RESP_TIME_ANA and click on expose. Now you can start to consume the data source in your chosen BI solution. In the examples shown we are taking a daily snapshot of data for the last six months. Since we are using a data lake you can also enhance the data by joining with other external HR information (Country, role type etc) or other C4C data (business role, Sales Org etc.)
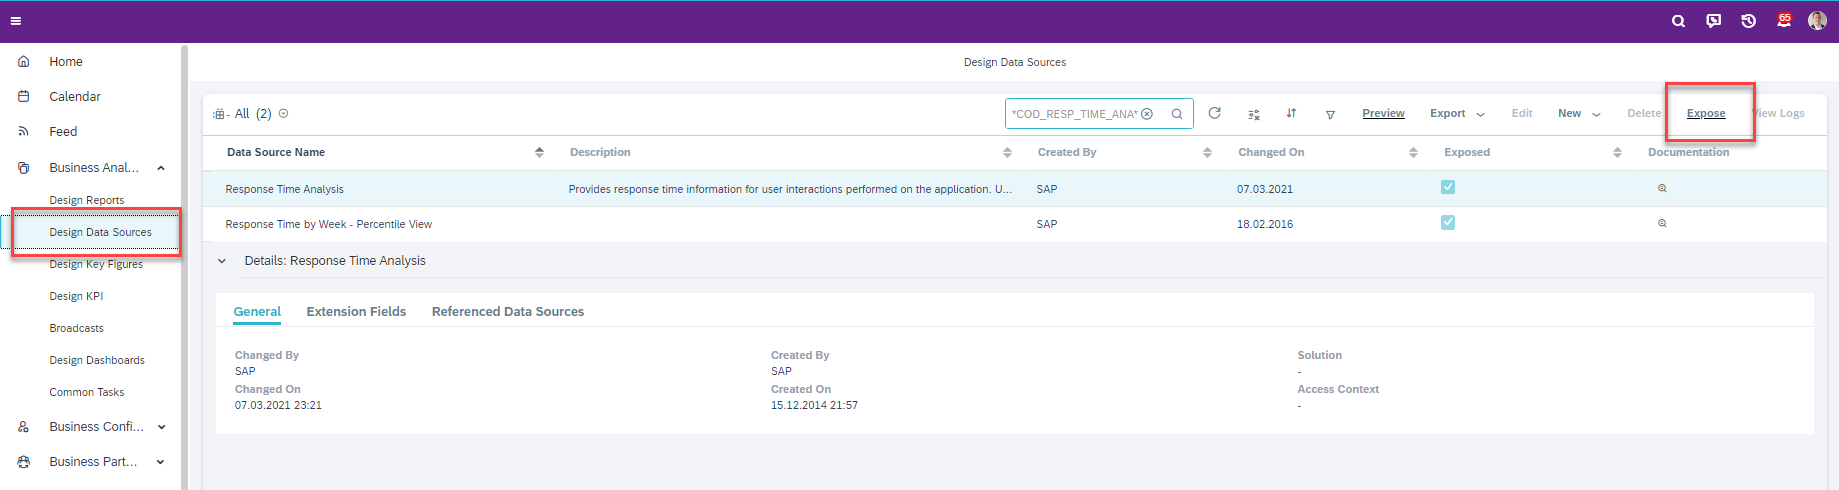
Expose Data Source in C4C
Examples of reports built in Power BI
With this example you can get details of a system usage over time. In the example we look at 'Work Center' displayed over the day. Where our peak system usage is and in which objects in C4C whilst also summarizing the most used Interaction steps and which clients are used.

With this example you can get details of a feature usage over time. In the example we look at 'Export to Microsoft Excel'. Since this tracks the user ID we can also include the business role of the user executing the interaction step.

In the below example we look at 'OVSValueSelect' interaction step. Users selecting values in a click box. We can see large usage in the Service Ticket area where users are categorising tickets. Could this be something to be improved? Since we are using machine learning for ticket categorisation could this indicate the model needs to be retrained?

Summary
Analysing this data raises a lot of interesting discussions with users, stakeholders and development teams. Also check out this other user adoption metric
blog. Something to consider is security and who is able to analyse this type of data. Check in your local region if you are able to track this type of usage data or consider anonymising the user data.
I encourage you to share your thoughts on this blog, share the metrics, KPIs and reports that you already track or want to track within your organization, how the metrics help you in driving adoption and what more you’d like to see as additional content in later blogs
Ben
