
- SAP Community
- Products and Technology
- Technology
- Technology Blogs by Members
- Exploring the New Capabilities of SAP Datasphere f...
Technology Blogs by Members
Explore a vibrant mix of technical expertise, industry insights, and tech buzz in member blogs covering SAP products, technology, and events. Get in the mix!
Turn on suggestions
Auto-suggest helps you quickly narrow down your search results by suggesting possible matches as you type.
Showing results for
carlos_basto2
Explorer
Options
- Subscribe to RSS Feed
- Mark as New
- Mark as Read
- Bookmark
- Subscribe
- Printer Friendly Page
- Report Inappropriate Content
03-15-2023
5:27 PM
Context and Introduction
In today's fast-paced business world, making sense of data can be a daunting task. But don't worry, SAP has got your back with their latest innovation: SAP Datasphere. This technology is designed to make your life easier by seamlessly integrating, cataloging, modeling, and virtualizing data from various sources, including SAP and non-SAP systems.
In this article, we'll take a closer look at three exciting features of SAP Datasphere:
- Application and Data Integration
- Semantic Modeling
- Data Cataloging and Quality
… and explain how they can help businesses to unleash the power of data.
1. Application and Data Integration
Integrating data can be a challenge, especially when it comes to bringing together SAP and non-SAP data. However, with SAP Datasphere, you can seamlessly integrate data from both sources.
SAP Datasphere can help you to reduce integration complexity and get an integrated view of information, regardless of where it's stored or how it was designed. This means you can spend less time worrying about the technical aspects of integration and more time using your data to make informed decisions for your business.
So why not get started on our exciting journey by creating a Replication Flow today? The first step is to establish a connection to your source system. Once you've done that, you'll be well on your way to simplifying your data replication process and saving time and effort.
1.1. Gathering SAP HANA Cloud Information and Initial Setup
In our example, we'll need to work with the SAP HANA Cloud Instance (HCD). And the best part? Getting everything you need is super easy! All you need to do is "Copy SQL Endpoint". This nifty feature will provide you the host and port information required to connect to SAP HANA Cloud.

SAP HANA Cloud SQL Endpoint
The next piece of the puzzle is your user and password. Simply add these details to your connection settings in SAP Datasphere, and you're good to go!

User Management
To start, click on "User Management" and create your user. If you already have one, you can use it, just like in my case. For this article, you only need access to your own schema, but you can manage the privileges as you desire.

DEVELOPER user
Now, let's look at what you can use in SAP HANA Cloud:

SAP HANA Database Explorer
Our scope will be comprised of three (3) tables as follows:
- ACTUAL_DEMAND: This table contains all historical demand units. This is the actual data I have.
- DEMAND_CHANNEL: This table contains all the demand channels descriptions.
- DEMAND_PREDICTIONS: This table provides predictions for a horizon of 15 days (note that this table will be used only for replication part of this blog, it could be used in further analytics developments but the idea was to demonstrate that you may compose a strategy for long-term modeling from the replication capabilities we'll experiment here).
1.2. Creating SAP HANA Cloud Connection in SAP Datasphere
Before we proceed, it's important to note that at the time of writing, replication flows are only able to copy certain source objects. Please keep this in mind as you begin using this feature.
- CDS views (in ABAP-based SAP systems) that are enabled for extraction.
- Tables that have a unique key (primary key)
- Objects from ODP providers, such as extractors or SAP BW artifacts.
Now, let's move into SAP Datasphere and Create a Connection to the SAP HANA Cloud. Simply use the information you have and you're good to go!

SAP Datasphere Connection
Here you just use the information you already got and that’s it. Pretty simple, hun?
1.3. Creating a Replication Flow in SAP Datasphere
The next step is to create a Replication Flow for copying the data from those 3 tables into SAP Datasphere. To do this, go to the "Data Builder."

Data Builder
Notice that I don’t have any file in my environment! We’ll see new artifacts very soon in there. But for now, you may click on “Replication Flow” and the following screen will show up:

New Replication Flow
Note: If you cannot see the "Replication Flow," check if you have the "SAP Datasphere Integrator" role.
To choose the SAP HANA Cloud connection, click on "Select Source Connection."

Select Source Connection
When you select it, you'll need to choose the Source Container.

Select Container
Select your own schema "DEVELOPER," and finally, by clicking on "Add Source Objects," pick the tables you want.

Select Source Objects
In the next screen, select all the objects and "Add Selection."

Add Selection

Replication flow and Target Connection
Next, configure the target ("Select Target Connection"). Also, note that you should choose "SAP Datasphere" as your target when you want to replicate data from SAP HANA Cloud into it.

Select Target Connection
We did it!

Checking the settings
Let’s change the name of the replicated tables in SAP Datasphere.
RenameTarget Tables
You may choose the "Settings" to set the replication behavior for your tables:

Load Type Options
The load type can be:
- Initial Only: Load all selected data once.
- Initial and Delta: After the initial load, the system checks for source data changes (delta) once every 60 minutes and copies the changes to the target.

Chose Load Type
First things first, let's give a good name for this replication flow - let's call it "Demand Data Replica". Although I'll be using "Initial and Delta" in this article, you can choose any option you prefer.

Name the Replication Flow
Once you select the row related to any table, the replication properties will show you a very good set of information about it. It's important to note that the functionality is still pretty new, so it's worth taking a closer look at it.

Replication Properties
In my case, I noticed that it was also showing the fields I didn't want to replicate (the weekday_*).

No Weekday Features
To avoid replicating these fields, we can use the "Add Projection" option. Just remember that it won't show up if you don't click on any row.

Filter Page in Projection

Filter Page in Projection: Options
You can create filters based on the available fields and/or map the fields you want (which is what I’ll do in this case).

Create Projection
As you can see, it's easy to not select the fields you want. Once you've made your selections, don't forget to give your replication flow a name. In my case, I named it "No Weekday Features".

Successfully Deployed
Now that we've completed our replication flow, let's save it and deploy it.
Let’s see what happened in our Data Builder home page.

Data Builder Home Page
When we created our replication flow, all the tables (physical ones) were automatically created in SAP Datasphere. So now you may be thinking, "Well, let's see the replicated data!!". Ok, let’s do this!

Data Preview
1.4. Running a Replication Flow in SAP Datasphere
OMG! The data is not there. But hold on, we missed one important step: executing the replication flow. If you go back to the replication flow you created, you will find the "Run" button:.

Replication Flow Page

Tool Bar
In “Tools”, you can then select the monitor.

Replication Monitor
Looks like we have a lot of things in here, but don't worry, it'll only take a few seconds to figure it out. Once the loading is complete, the message will show up like this:

Replication Message
Now, let's take a look at the tables and see if we can spot some data.

Actual Demand Table Preview

Predicted Demand Table Preview

Channel Table Preview
Great news, we got it!
You should be proud of yourself; you got all the source tables you need to do some Analytics stuff! But here comes the question: is there an easy way to make your data more accessible and insightful for consumption in SAP Analytics Cloud?
2. Semantic Modeling: Analytic Models
The answer is Analytic Models!!!
Analytic models in SAP Datasphere are the perfect solution for that! It’s the foundation for making data ready for consumption in SAP Analytics Cloud. These models provide a multi-dimensional framework that enables you to answer different business questions and create meaningful insights.
To create an analytic model, you need to use an Analytical Dataset as a source. These datasets contain dimensions, texts, and hierarchies, and form the basis for building models. Fields with semantic type "Amount with Currency" and "Quantity with Unit" can have measures added to the model, which automatically include quantity or unit information.
To create an analytical dataset, we will use a Graphical View based on the tables we had replicated. It's important to note the differences between an analytic model and an analytical dataset, which you can find in our "Comparison of Analytic Model and Analytical Dataset" help page.
If you understand analytic models and analytical datasets, you can build a strong foundation for data analysis and make informed decisions.
Well, let’s create a graphical view then.
2.1. Creating a Graphical View
Let’s drag and drop the table with actual demand data to Add a Source.

Back to Data Builder

Add a Source
Here you will be able to customize your view. You can rename columns, add semantics, and labels as needed. Choose the options that work best for your use case.

Attribute Settings

Adjust Semantics
As it is analytical, at least one measure must be defined.

Measure Settings

Change to Measure
And for our purposes, using the "Change to Measure" option is enough.
To create an association between two data entities, go to the Associations section of the side panel in your table or view and click on the Create button. This will allow you to create a relationship between the current table or view and another table or view in your data layer.

Create Association
You can create an association between any two tables or views, regardless of their level in the data layer. This means that you can define relationships between analytical datasets and dimensions, among other consumable views.
Let's create an association together by selecting "Channel" as our association!

Select Association Target

Maintain Association Properties
To make things more interactive for the user when running a view, we can add an input parameter that prompts them to enter a value. This value can then be used to filter or perform other calculations.
If the view is used in an SAP Analytics Cloud story, the user will be asked to enter a value for the input parameter in the "Set Variables" dialog.
Just for fun, let's create an input parameter together!

Create Input Parameter

Input Parameter Settings
Creating an input parameter is great, but if you don't use it within your model, it won't be very helpful. So, we need to make sure to utilize the input parameter somewhere in the graphical view. One way to do this is to create a filter that uses the input parameter as a value.

Ensure Successful Deployment Message
This will allow you to apply the filter based on the user's input and make your view more dynamic and interactive. So, let's get started and create a filter that makes use of the input parameter!

Add a Filter
Channel should be equals to the Input Parameter in this case, so:

Define a Filter
It seems like we've made all the necessary changes to our model, and it's looking good so far. Now, we can go ahead and save and deploy the graphical view.
Before we do that, it's always a good idea to double-check everything to ensure that we haven't missed anything important. Once we're confident that everything is in order, we can proceed with saving the model and deploying it.
Great job so far!
Graphical View Data Preview
2.2. Checking Impact and Lineage for Graphical View
Additionally, let me just call you attention for “Impact and Lineage Analysis”.
Have you heard about Impact and Lineage Analysis? It's a really useful diagram that can help you understand the lineage (or data provenance) of a specific object, as well as its impacts - the objects that depend on it and that will be affected by any changes made to it.

Data Analysis Perspective
When you're in Dependency Analysis mode, you'll also see objects that are connected to the analyzed object by associations and data access controls.
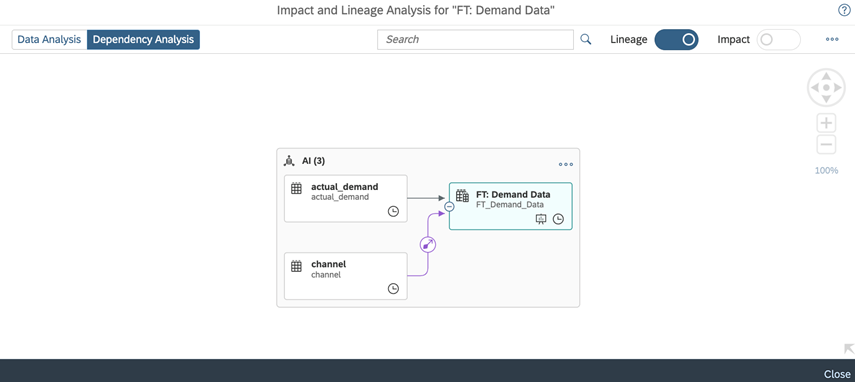
Dependency Analysis Perspective
This feature can be really helpful in understanding the relationships between different objects and can be a valuable tool in ensuring the accuracy and consistency of your data. So, give it a try and see the benefits for yourself!
2.3. Creating Analytic Model in SAP Datasphere
Now that we have created our analytical dataset, the next step is to create an Analytic model. Think of Analytic models as the foundation for making data ready for consumption in SAP Analytics Cloud. They enable you to create and define multi-dimensional models that provide data for analytical purposes, helping to answer different business questions.

Create an Analytic Model

New Analytic Model
Just drag and drop our view (just created). Note that when we set our analytical dataset, an option for creating the Analytic Model directly appeared, we are bringing here just another option to create it.

Select Properties to be Copied
On this screen, we can choose all the measures and attributes we want to include in our Analytic model, just as we can for associations. Remember, we had created an input parameter earlier, so we will have to map it later within our Analytic model.

Review Settings
Now that we have selected our measures and attributes, let's continue building our Analytic model. And that's what we've got - a powerful tool that will help us to make data-driven decisions and drive business success. You may save it, deploy it and preview it.

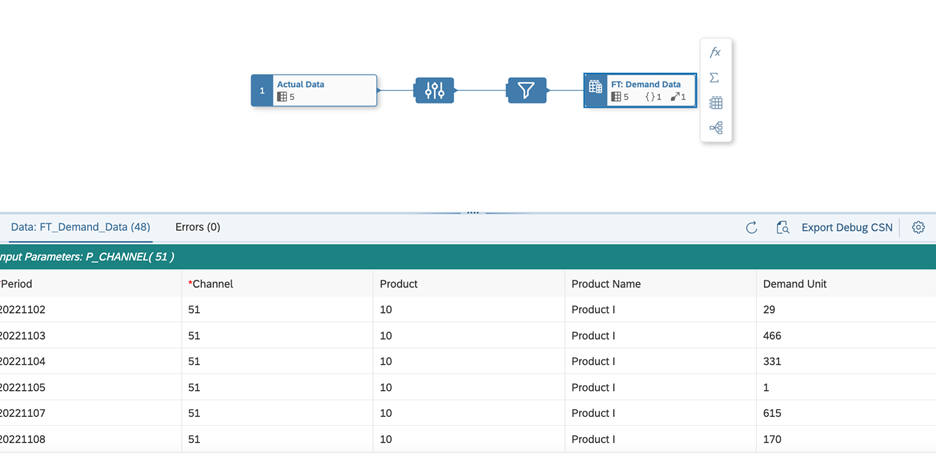
Fill the Prompt (Input Parameter)
Analytic Model Data Preview
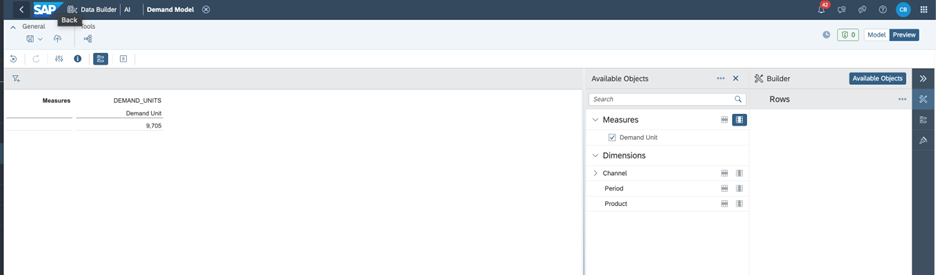
Now it’s up to you (be creative):

Data Preview Options
We've made amazing progress in the field of data analytics, and as a result, we can now accomplish a variety of powerful analytics tasks. But with SAP Datasphere, we can take things to the next level by leveraging its enterprise-wide data catalog to ensure proper governance over multiple systems.
This is particularly important when it comes to creating Analytic Models, as the catalog helps us manage and maintain metadata for the data assets used to build these models. By classifying, labeling, and documenting our data, we can ensure that our insights are accurate and trustworthy. This means that utilizing the SAP Datasphere catalog is not just a smart choice - it's a necessary one. By providing important context for the assets we create, the catalog enables us to take full advantage of the insights that data analytics can provide.
So why wait? Let's dive in and start exploring the full potential of SAP Datasphere Catalog!
3. Catalog
The Catalog is a powerful tool that provides an effective data governance strategy by bringing together an organized inventory of business metadata and data assets. This enables both business and technical users to unlock the full potential of their enterprise data. As a central location to discover, classify, understand, and prepare all the data in your enterprise, the catalog provides a comprehensive solution to manage your data assets.
Using the catalog, you can find the single source of truth for your data domain and build reusable business models. With the ability to discover which stories are impacted by your changes, the catalog helps you to streamline your workflow and ensure data accuracy.

Catalog Access
When you're searching for data assets within the catalog, you'll typically start by browsing the catalog home page. From there, you can open an individual asset to see more detailed information about it. The details page for a catalog asset is a rich source of information, presenting a range of metadata extracted from the underlying source system, as well as additional information added by catalog administrators. This may include descriptions, glossary terms, tags, key performance indicators (KPIs), and more.
Note that you’ll need the role “Catalog Administrator” and “Catalog User” to perform the next steps, ok? Make sure you got them previously. If you get all the roles, you should see something like this:

Catalog Home Page
3.1. Synchronizing and Setting up Systems for the Catalog
The catalog automatically extracts and keeps in sync new or updated metadata from your system. Only manually resynchronize under certain conditions:
- After adding a new system that has existing assets.
- After deleting and later restoring a system connection to capture object changes that occurred while the connection was deleted.
- If the error logs show missing metadata that failed to extract automatically.
When you synchronize “SAP Data Warehouse Cloud”, it may take some time to complete. You can continue working on other tasks while the synchronization is in progress, and you will be notified when it is finished. If you want to monitor a system, you will need to create a connection to it first (for DWC source it should be created automatically, but if it doesn’t, go ahead and create it yourself).

Catalog Monitor
And now you should be able to see all available assets within the system:

Catalog Overview
3.2. Meeting the Asset Overview Page
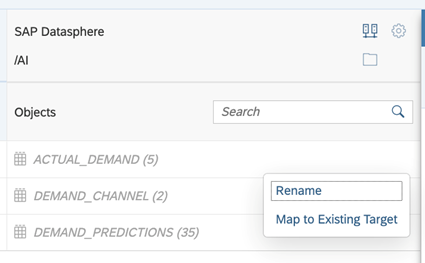
In our case, we’re interested in “Demand*” assets. Thus, we can just filter by “demand”. Simple, hun?

Search for Assets
Choosing the “Demand Model” – the Analytic Model that we created before – you’ll see the overview page. It gives you a detailed overview of an asset and its glossary terms, tags, and KPIs. The tab has three sections: Overview, Asset Overview Details, and Asset Terms, Tags, and KPIs.

Demand Model Catalog Overview
The Properties section shows read-only asset property information extracted from the data source, including the asset name, creation and change dates, source business name, semantic usage, and whether it's exposed for consumption and the Descriptions section shows both the source description and catalog description of the asset. The Asset Terms, Tags, and KPIs section displays the glossary terms, tags, and KPIs linked to the asset, which only catalog administrators can link.
3.3. Creating Tag and Tag Hierarchies
To better organize your assets in the catalog, you can create tags and tag hierarchies. To do this, you need to have the Catalog Administrator role.

Create a Tag Hierarchy
Once you have created the tag hierarchies, you can create and add tags to your assets, which will make it easier to search for them. However, if a hierarchy has the Multiselect option disabled, you can only add one tag from that hierarchy to an asset.
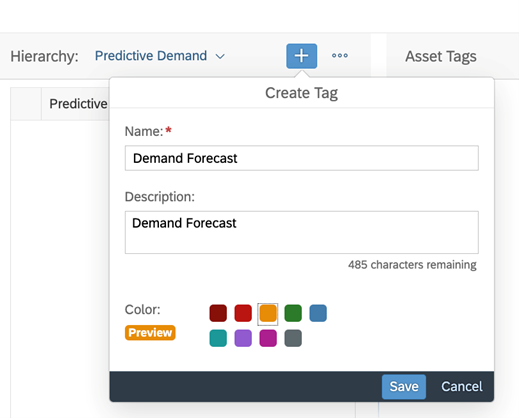
Create a Tag
Select (check box) then click on “Save” and that’s it.

Apply Tags
3.4. Analyzing Lineage and Impact of your Assets
One particularly useful feature of the Catalog is the lineage diagram, which shows you how the asset is related to other assets within the catalog. By reviewing the lineage diagram, you can gain insight into how the asset fits into your larger data ecosystem, and which assets are impacted by changes to this asset.

Lineage Diagram
You can also check the impact chain by drilling down on the assets which are dependency for the Analytic Model.

Impact Diagram
3.5. Creating Glossary and Terms
We still have many capabilities to see, but first, we will create a business glossary which provides a central and shared repository for defining terms and describing how and where they are used in the business.

Create a Glossary
Now we have a glossary, let’s create a term. Terms are contained in a business glossary and provide meaning to your data.
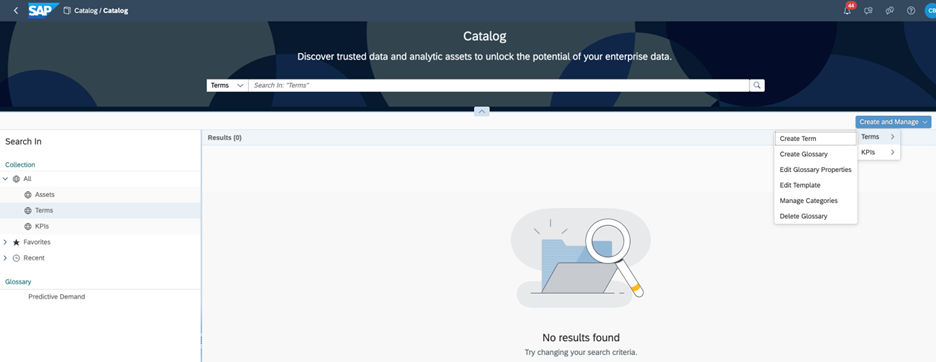
Create a Term
You’ll need to choose the glossary and, additionally, if you want, you may create a Template to speed up your next developments in Catalog.

Select a Glossary
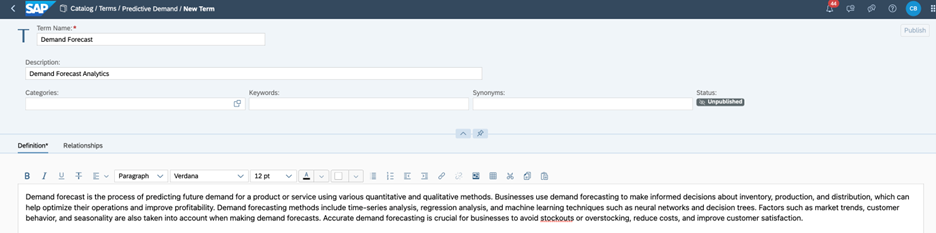
Define the Term
It's a straightforward tip! However, it's essential to provide detailed information about your assets to help others find what they're looking for quickly and easily. By doing so, you can optimize the search process and enhance user experience. So, remember it when you are using the Catalog.
The next step is to assign this term to the Asset by clicking on “Relationships” and “Manage Relationships”:

Manage Relationships
Select your asset and then click on “Add to Related Objects”.
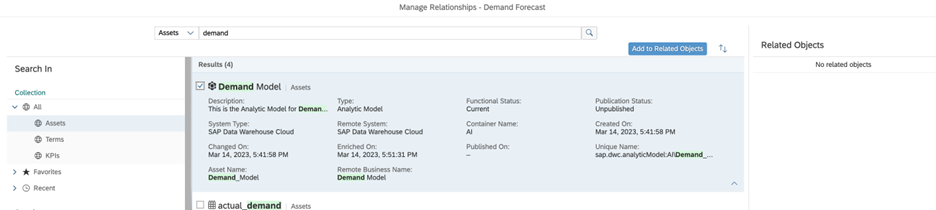
Add Term to Related Objects
3.6. Creating KPIs
Good! Let’s create a KPI. They will help business to measure the progress towards a result such as a goal or objective. It allows for performance tracking and provide an analytical basis for decision-making as well.

Create a KPI
To create a KPI that's actually helpful, start by setting a goal that can be measured quantitatively or qualitatively. The interface is easy to be understood, but please consider the relationship to other assets do not perform any calculations on those assets.
Here's an example: let's say you want to improve the accuracy of your demand forecasting. You can create a KPI for this and link it to all the source assets that contribute to providing this kind of information.
When defining the KPI, you can specify the calculation as "some formula", and then create detailed documentation that includes the steps for finding the source systems and creating a workflow to gather the data needed for tracking each month. It's important to note that you'll need to perform these steps separately from the KPI, but the KPI will provide all the information you need to track your progress towards your goal.

Define the KPI

Add KPI to Related Objects
By following these steps, you'll be able to create a KPI that's truly helpful and effective in helping you work towards your objectives.
3.7. Determining Visibility for Catalog Artifacts
Finally, let's talk about governance: as a catalog administrator, it's your responsibility to determine which content is discoverable and visible to users who are searching in the catalog. Once you've enriched asset metadata, applied appropriate classifications, and ensured the overall quality of the asset, it's time to publish it!
When you publish an asset, you're making it available for everyone to discover. This includes associated terms and KPIs that help users understand the asset and its performance.

Publish Artifacts
By publishing your assets, you're opening the door (or “eyes”) for others to benefit from your hard work and insights. So go ahead and hit that publish button once you've ensured that your asset is of high quality and provides value to your organization!

Visibility Icon
Final Considerations
Thanks for taking the time to read this article on SAP Datasphere. I am excited to have explored three of the innovative features that this technology offers - Application and Data Integration, Semantic Modeling, and Data Cataloging and Quality.
I believe that these features can be developed and used in a business context to unlock the true power of data. I also want to note that as SAP continues to innovate and improve their products, some of the functionalities we discussed may change or look different in the future.
So, I may conclude that SAP Datasphere is an exciting innovation that can help businesses make sense of their data. With its ability to integrate, catalog, model, and virtualize data from various sources, SAP Datasphere promises to be a game-changer.
Hopefully, this article has provided you a better understanding of these key features and how they can help businesses unleash the full potential of their data.
Thanks for reading!
- SAP Managed Tags:
- SAP Datasphere
9 Comments
You must be a registered user to add a comment. If you've already registered, sign in. Otherwise, register and sign in.
Labels in this area
-
"automatische backups"
1 -
"regelmäßige sicherung"
1 -
"TypeScript" "Development" "FeedBack"
1 -
505 Technology Updates 53
1 -
ABAP
14 -
ABAP API
1 -
ABAP CDS Views
2 -
ABAP CDS Views - BW Extraction
1 -
ABAP CDS Views - CDC (Change Data Capture)
1 -
ABAP class
2 -
ABAP Cloud
2 -
ABAP Development
5 -
ABAP in Eclipse
1 -
ABAP Platform Trial
1 -
ABAP Programming
2 -
abap technical
1 -
absl
2 -
access data from SAP Datasphere directly from Snowflake
1 -
Access data from SAP datasphere to Qliksense
1 -
Accrual
1 -
action
1 -
adapter modules
1 -
Addon
1 -
Adobe Document Services
1 -
ADS
1 -
ADS Config
1 -
ADS with ABAP
1 -
ADS with Java
1 -
ADT
2 -
Advance Shipping and Receiving
1 -
Advanced Event Mesh
3 -
AEM
1 -
AI
7 -
AI Launchpad
1 -
AI Projects
1 -
AIML
9 -
Alert in Sap analytical cloud
1 -
Amazon S3
1 -
Analytical Dataset
1 -
Analytical Model
1 -
Analytics
1 -
Analyze Workload Data
1 -
annotations
1 -
API
1 -
API and Integration
3 -
API Call
2 -
Application Architecture
1 -
Application Development
5 -
Application Development for SAP HANA Cloud
3 -
Applications and Business Processes (AP)
1 -
Artificial Intelligence
1 -
Artificial Intelligence (AI)
5 -
Artificial Intelligence (AI) 1 Business Trends 363 Business Trends 8 Digital Transformation with Cloud ERP (DT) 1 Event Information 462 Event Information 15 Expert Insights 114 Expert Insights 76 Life at SAP 418 Life at SAP 1 Product Updates 4
1 -
Artificial Intelligence (AI) blockchain Data & Analytics
1 -
Artificial Intelligence (AI) blockchain Data & Analytics Intelligent Enterprise
1 -
Artificial Intelligence (AI) blockchain Data & Analytics Intelligent Enterprise Oil Gas IoT Exploration Production
1 -
Artificial Intelligence (AI) blockchain Data & Analytics Intelligent Enterprise sustainability responsibility esg social compliance cybersecurity risk
1 -
ASE
1 -
ASR
2 -
ASUG
1 -
Attachments
1 -
Authorisations
1 -
Automating Processes
1 -
Automation
2 -
aws
2 -
Azure
1 -
Azure AI Studio
1 -
B2B Integration
1 -
Backorder Processing
1 -
Backup
1 -
Backup and Recovery
1 -
Backup schedule
1 -
BADI_MATERIAL_CHECK error message
1 -
Bank
1 -
BAS
1 -
basis
2 -
Basis Monitoring & Tcodes with Key notes
2 -
Batch Management
1 -
BDC
1 -
Best Practice
1 -
bitcoin
1 -
Blockchain
3 -
bodl
1 -
BOP in aATP
1 -
BOP Segments
1 -
BOP Strategies
1 -
BOP Variant
1 -
BPC
1 -
BPC LIVE
1 -
BTP
12 -
BTP Destination
2 -
Business AI
1 -
Business and IT Integration
1 -
Business application stu
1 -
Business Application Studio
1 -
Business Architecture
1 -
Business Communication Services
1 -
Business Continuity
1 -
Business Data Fabric
3 -
Business Partner
12 -
Business Partner Master Data
10 -
Business Technology Platform
2 -
Business Trends
4 -
CA
1 -
calculation view
1 -
CAP
3 -
Capgemini
1 -
CAPM
1 -
Catalyst for Efficiency: Revolutionizing SAP Integration Suite with Artificial Intelligence (AI) and
1 -
CCMS
2 -
CDQ
12 -
CDS
2 -
Cental Finance
1 -
Certificates
1 -
CFL
1 -
Change Management
1 -
chatbot
1 -
chatgpt
3 -
CL_SALV_TABLE
2 -
Class Runner
1 -
Classrunner
1 -
Cloud ALM Monitoring
1 -
Cloud ALM Operations
1 -
cloud connector
1 -
Cloud Extensibility
1 -
Cloud Foundry
4 -
Cloud Integration
6 -
Cloud Platform Integration
2 -
cloudalm
1 -
communication
1 -
Compensation Information Management
1 -
Compensation Management
1 -
Compliance
1 -
Compound Employee API
1 -
Configuration
1 -
Connectors
1 -
Consolidation Extension for SAP Analytics Cloud
2 -
Control Indicators.
1 -
Controller-Service-Repository pattern
1 -
Conversion
1 -
Cosine similarity
1 -
cryptocurrency
1 -
CSI
1 -
ctms
1 -
Custom chatbot
3 -
Custom Destination Service
1 -
custom fields
1 -
Customer Experience
1 -
Customer Journey
1 -
Customizing
1 -
cyber security
3 -
Data
1 -
Data & Analytics
1 -
Data Aging
1 -
Data Analytics
2 -
Data and Analytics (DA)
1 -
Data Archiving
1 -
Data Back-up
1 -
Data Governance
5 -
Data Integration
2 -
Data Quality
12 -
Data Quality Management
12 -
Data Synchronization
1 -
data transfer
1 -
Data Unleashed
1 -
Data Value
8 -
database tables
1 -
Datasphere
2 -
datenbanksicherung
1 -
dba cockpit
1 -
dbacockpit
1 -
Debugging
2 -
Delimiting Pay Components
1 -
Delta Integrations
1 -
Destination
3 -
Destination Service
1 -
Developer extensibility
1 -
Developing with SAP Integration Suite
1 -
Devops
1 -
digital transformation
1 -
Documentation
1 -
Dot Product
1 -
DQM
1 -
dump database
1 -
dump transaction
1 -
e-Invoice
1 -
E4H Conversion
1 -
Eclipse ADT ABAP Development Tools
2 -
edoc
1 -
edocument
1 -
ELA
1 -
Embedded Consolidation
1 -
Embedding
1 -
Embeddings
1 -
Employee Central
1 -
Employee Central Payroll
1 -
Employee Central Time Off
1 -
Employee Information
1 -
Employee Rehires
1 -
Enable Now
1 -
Enable now manager
1 -
endpoint
1 -
Enhancement Request
1 -
Enterprise Architecture
1 -
ETL Business Analytics with SAP Signavio
1 -
Euclidean distance
1 -
Event Dates
1 -
Event Driven Architecture
1 -
Event Mesh
2 -
Event Reason
1 -
EventBasedIntegration
1 -
EWM
1 -
EWM Outbound configuration
1 -
EWM-TM-Integration
1 -
Existing Event Changes
1 -
Expand
1 -
Expert
2 -
Expert Insights
2 -
Fiori
14 -
Fiori Elements
2 -
Fiori SAPUI5
12 -
Flask
1 -
Full Stack
8 -
Funds Management
1 -
General
1 -
Generative AI
1 -
Getting Started
1 -
GitHub
8 -
Grants Management
1 -
groovy
1 -
GTP
1 -
HANA
6 -
HANA Cloud
2 -
Hana Cloud Database Integration
2 -
HANA DB
2 -
HANA XS Advanced
1 -
Historical Events
1 -
home labs
1 -
HowTo
1 -
HR Data Management
1 -
html5
8 -
HTML5 Application
1 -
Identity cards validation
1 -
idm
1 -
Implementation
1 -
input parameter
1 -
instant payments
1 -
Integration
3 -
Integration Advisor
1 -
Integration Architecture
1 -
Integration Center
1 -
Integration Suite
1 -
intelligent enterprise
1 -
iot
1 -
Java
1 -
job
1 -
Job Information Changes
1 -
Job-Related Events
1 -
Job_Event_Information
1 -
joule
4 -
Journal Entries
1 -
Just Ask
1 -
Kerberos for ABAP
8 -
Kerberos for JAVA
8 -
KNN
1 -
Launch Wizard
1 -
learning content
2 -
Life at SAP
5 -
lightning
1 -
Linear Regression SAP HANA Cloud
1 -
local tax regulations
1 -
LP
1 -
Machine Learning
2 -
Marketing
1 -
Master Data
3 -
Master Data Management
14 -
Maxdb
2 -
MDG
1 -
MDGM
1 -
MDM
1 -
Message box.
1 -
Messages on RF Device
1 -
Microservices Architecture
1 -
Microsoft Universal Print
1 -
Middleware Solutions
1 -
Migration
5 -
ML Model Development
1 -
Modeling in SAP HANA Cloud
8 -
Monitoring
3 -
MTA
1 -
Multi-Record Scenarios
1 -
Multiple Event Triggers
1 -
Neo
1 -
New Event Creation
1 -
New Feature
1 -
Newcomer
1 -
NodeJS
2 -
ODATA
2 -
OData APIs
1 -
odatav2
1 -
ODATAV4
1 -
ODBC
1 -
ODBC Connection
1 -
Onpremise
1 -
open source
2 -
OpenAI API
1 -
Oracle
1 -
PaPM
1 -
PaPM Dynamic Data Copy through Writer function
1 -
PaPM Remote Call
1 -
PAS-C01
1 -
Pay Component Management
1 -
PGP
1 -
Pickle
1 -
PLANNING ARCHITECTURE
1 -
Popup in Sap analytical cloud
1 -
PostgrSQL
1 -
POSTMAN
1 -
Process Automation
2 -
Product Updates
4 -
PSM
1 -
Public Cloud
1 -
Python
4 -
Qlik
1 -
Qualtrics
1 -
RAP
3 -
RAP BO
2 -
Record Deletion
1 -
Recovery
1 -
recurring payments
1 -
redeply
1 -
Release
1 -
Remote Consumption Model
1 -
Replication Flows
1 -
research
1 -
Resilience
1 -
REST
1 -
REST API
1 -
Retagging Required
1 -
Risk
1 -
Rolling Kernel Switch
1 -
route
1 -
rules
1 -
S4 HANA
1 -
S4 HANA Cloud
1 -
S4 HANA On-Premise
1 -
S4HANA
3 -
S4HANA_OP_2023
2 -
SAC
10 -
SAC PLANNING
9 -
SAP
4 -
SAP ABAP
1 -
SAP Advanced Event Mesh
1 -
SAP AI Core
8 -
SAP AI Launchpad
8 -
SAP Analytic Cloud Compass
1 -
Sap Analytical Cloud
1 -
SAP Analytics Cloud
4 -
SAP Analytics Cloud for Consolidation
3 -
SAP Analytics Cloud Story
1 -
SAP analytics clouds
1 -
SAP BAS
1 -
SAP Basis
6 -
SAP BODS
1 -
SAP BODS certification.
1 -
SAP BTP
21 -
SAP BTP Build Work Zone
2 -
SAP BTP Cloud Foundry
6 -
SAP BTP Costing
1 -
SAP BTP CTMS
1 -
SAP BTP Innovation
1 -
SAP BTP Migration Tool
1 -
SAP BTP SDK IOS
1 -
SAP Build
11 -
SAP Build App
1 -
SAP Build apps
1 -
SAP Build CodeJam
1 -
SAP Build Process Automation
3 -
SAP Build work zone
10 -
SAP Business Objects Platform
1 -
SAP Business Technology
2 -
SAP Business Technology Platform (XP)
1 -
sap bw
1 -
SAP CAP
2 -
SAP CDC
1 -
SAP CDP
1 -
SAP CDS VIEW
1 -
SAP Certification
1 -
SAP Cloud ALM
4 -
SAP Cloud Application Programming Model
1 -
SAP Cloud Integration for Data Services
1 -
SAP cloud platform
8 -
SAP Companion
1 -
SAP CPI
3 -
SAP CPI (Cloud Platform Integration)
2 -
SAP CPI Discover tab
1 -
sap credential store
1 -
SAP Customer Data Cloud
1 -
SAP Customer Data Platform
1 -
SAP Data Intelligence
1 -
SAP Data Migration in Retail Industry
1 -
SAP Data Services
1 -
SAP DATABASE
1 -
SAP Dataspher to Non SAP BI tools
1 -
SAP Datasphere
10 -
SAP DRC
1 -
SAP EWM
1 -
SAP Fiori
2 -
SAP Fiori App Embedding
1 -
Sap Fiori Extension Project Using BAS
1 -
SAP GRC
1 -
SAP HANA
1 -
SAP HCM (Human Capital Management)
1 -
SAP HR Solutions
1 -
SAP IDM
1 -
SAP Integration Suite
9 -
SAP Integrations
4 -
SAP iRPA
2 -
SAP Learning Class
1 -
SAP Learning Hub
1 -
SAP Odata
2 -
SAP on Azure
1 -
SAP PartnerEdge
1 -
sap partners
1 -
SAP Password Reset
1 -
SAP PO Migration
1 -
SAP Prepackaged Content
1 -
SAP Process Automation
2 -
SAP Process Integration
2 -
SAP Process Orchestration
1 -
SAP S4HANA
2 -
SAP S4HANA Cloud
1 -
SAP S4HANA Cloud for Finance
1 -
SAP S4HANA Cloud private edition
1 -
SAP Sandbox
1 -
SAP STMS
1 -
SAP successfactors
3 -
SAP SuccessFactors HXM Core
1 -
SAP Time
1 -
SAP TM
2 -
SAP Trading Partner Management
1 -
SAP UI5
1 -
SAP Upgrade
1 -
SAP Utilities
1 -
SAP-GUI
8 -
SAP_COM_0276
1 -
SAPBTP
1 -
SAPCPI
1 -
SAPEWM
1 -
sapmentors
1 -
saponaws
2 -
SAPS4HANA
1 -
SAPUI5
4 -
schedule
1 -
Secure Login Client Setup
8 -
security
9 -
Selenium Testing
1 -
SEN
1 -
SEN Manager
1 -
service
1 -
SET_CELL_TYPE
1 -
SET_CELL_TYPE_COLUMN
1 -
SFTP scenario
2 -
Simplex
1 -
Single Sign On
8 -
Singlesource
1 -
SKLearn
1 -
soap
1 -
Software Development
1 -
SOLMAN
1 -
solman 7.2
2 -
Solution Manager
3 -
sp_dumpdb
1 -
sp_dumptrans
1 -
SQL
1 -
sql script
1 -
SSL
8 -
SSO
8 -
Substring function
1 -
SuccessFactors
1 -
SuccessFactors Platform
1 -
SuccessFactors Time Tracking
1 -
Sybase
1 -
system copy method
1 -
System owner
1 -
Table splitting
1 -
Tax Integration
1 -
Technical article
1 -
Technical articles
1 -
Technology Updates
14 -
Technology Updates
1 -
Technology_Updates
1 -
terraform
1 -
Threats
1 -
Time Collectors
1 -
Time Off
2 -
Time Sheet
1 -
Time Sheet SAP SuccessFactors Time Tracking
1 -
Tips and tricks
2 -
toggle button
1 -
Tools
1 -
Trainings & Certifications
1 -
Transport in SAP BODS
1 -
Transport Management
1 -
TypeScript
2 -
ui designer
1 -
unbind
1 -
Unified Customer Profile
1 -
UPB
1 -
Use of Parameters for Data Copy in PaPM
1 -
User Unlock
1 -
VA02
1 -
Validations
1 -
Vector Database
2 -
Vector Engine
1 -
Visual Studio Code
1 -
VSCode
1 -
Web SDK
1 -
work zone
1 -
workload
1 -
xsa
1 -
XSA Refresh
1
- « Previous
- Next »
Related Content
- New Machine Learning features in SAP HANA Cloud in Technology Blogs by SAP
- 10+ ways to reshape your SAP landscape with SAP Business Technology Platform – Blog 4 in Technology Blogs by SAP
- Top Picks: Innovations Highlights from SAP Business Technology Platform (Q1/2024) in Technology Blogs by SAP
- Enhanced Data Analysis of Fitness Data using HANA Vector Engine, Datasphere and SAP Analytics Cloud in Technology Blogs by SAP
- SAP Datasphere is ready to take over the role of SAP BW in Technology Blogs by SAP
Top kudoed authors
| User | Count |
|---|---|
| 10 | |
| 9 | |
| 5 | |
| 4 | |
| 4 | |
| 3 | |
| 3 | |
| 3 | |
| 3 | |
| 3 |