Hi All,
This guide provides comprehensive advice on how to eliminate common performance issues seen in your CPQ applications. It covers everything from understanding the common performance issues and determining the root cause, to implementing the necessary changes to improve performance and prevent future issues.
It also provides overview and some best practices to help you diagnose, troubleshoot, and resolve any performance issues that may arise. Additionally, this blog provides suggestions on how to monitor app performance, identify and address areas of improvement, and establish an efficient performance management system. With this blog, you can be sure to optimize your application performance and ensure a flawless Sales user experience.
8 Tips & Tricks to solve Performance Issues
1. Check system resources and configurations: Check the system resources (CPU, memory, disk, etc.) to ensure that they are configured correctly and are sufficient for the application.
2. Monitor for bottlenecks: Monitor for performance bottlenecks, such as disk bottlenecks, network latency, memory contention, etc., and take corrective action.
3. Optimize code and queries: Optimize the code and sql queries to ensure that they are as efficient as possible.
4. Utilize caching: Utilize caching to store frequently-accessed data and reduce the load on the database.
5. Utilize appropriate indexes: Utilize appropriate indexes to improve sql query performance.
6. Monitor application logs: Monitor application logs to identify and resolve issues quickly.
7. Tune SQL queries: Tune SQL queries to ensure that they are as efficient as possible.
8. Debugger : Utilize a Developer Console: Utilize a console to Trace & identify code that is inefficient and can be optimized.
Main Dashboard for to find Script Performance, System Errors, Storage, Users License.
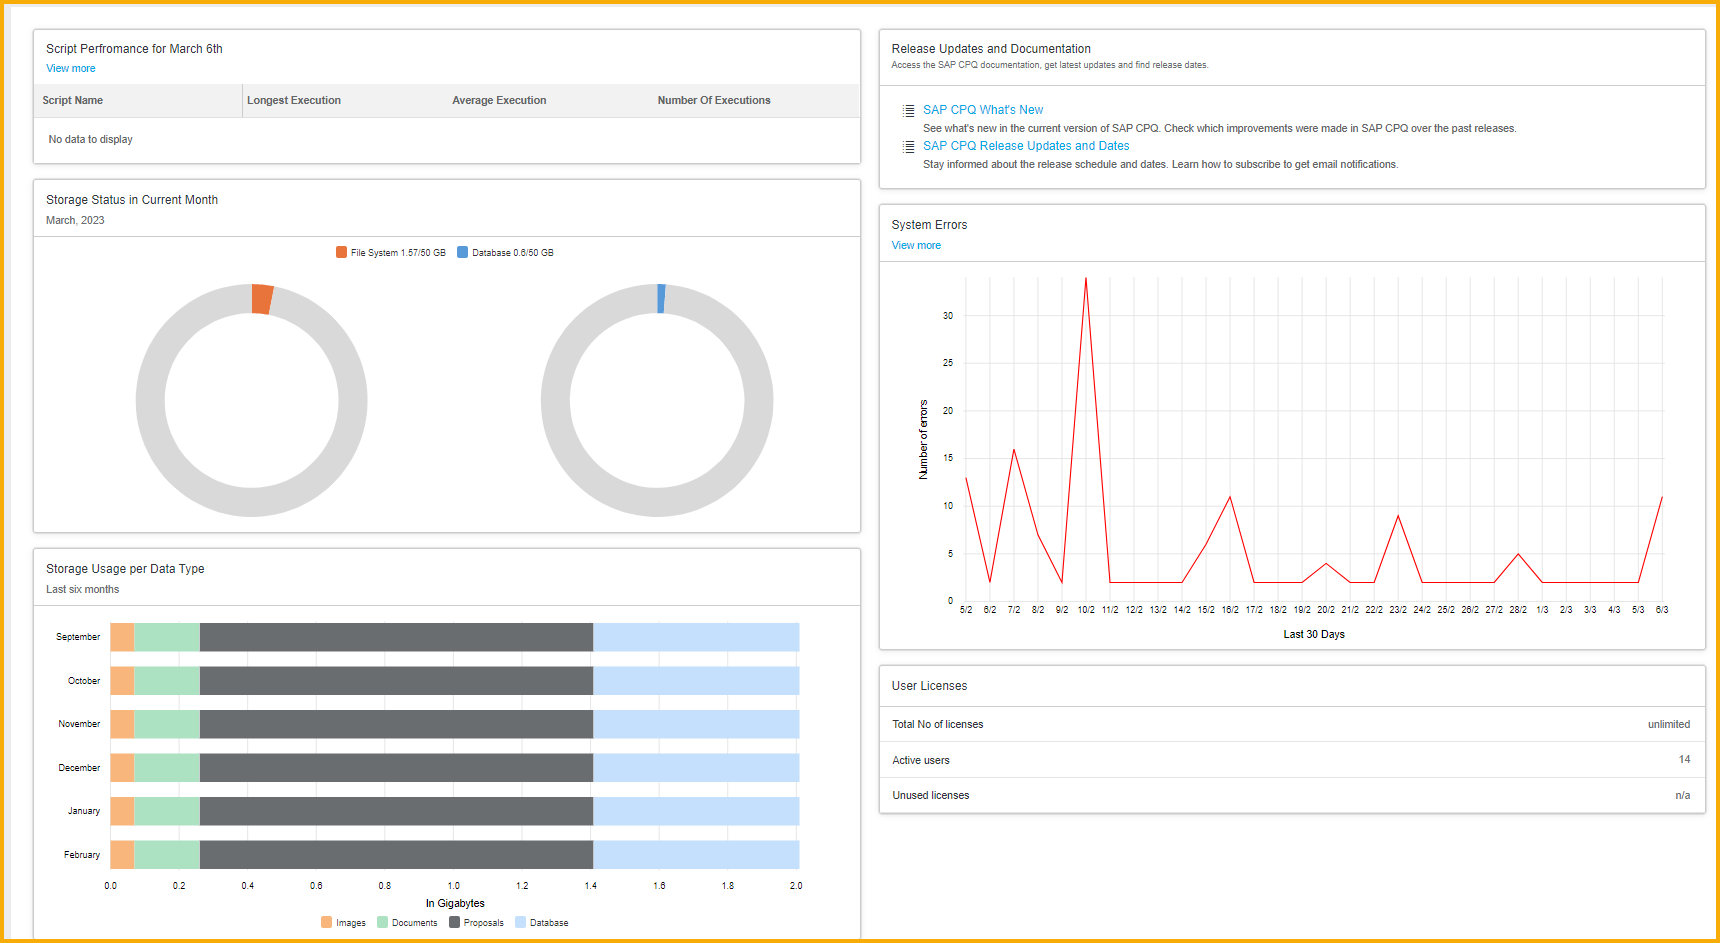 Identify Script Performance to check if your scripts are running for long duration to optimize better.
 Monitor Developer Console for Tracing, Debugging and Performance tracking
 Enable Data Deletion ( Auto Clean up )
Areas to look at it for finding the Issues
- Storage Space
- Audit Trail workspace
- Poor writing IronPython scripts
- Scripts running for a long time
- Custom table storing a huge data volume
- Incorrect Html/Javascript coding in Responsive templates
- Check Logs with frequent errors

API Response
- Get the size of requests and responses (If you are working on API requests to get the data from applications).
- Never pull huge volume of data from your custom API, recommend to have pagination concept.
Custom Table
- Count the number of records into the database (you do not need to verify into all the tables, verify only the tables related to the service with the problem).
- Check if the table has indexed
- How long time take your service to finish when there are several users is accessble.
At this point, you should have all the enough information about what is happening, how it is happening, and where is it happening. Now, you have a general vision and you are ready to start to think about how to solve the problem in your application after reading this blog
🙂
