
- SAP Community
- Products and Technology
- Technology
- Technology Blogs by SAP
- Analyze Workload Data with /SDF/ST03DL
Technology Blogs by SAP
Learn how to extend and personalize SAP applications. Follow the SAP technology blog for insights into SAP BTP, ABAP, SAP Analytics Cloud, SAP HANA, and more.
Turn on suggestions
Auto-suggest helps you quickly narrow down your search results by suggesting possible matches as you type.
Showing results for
Product and Topic Expert
Options
- Subscribe to RSS Feed
- Mark as New
- Mark as Read
- Bookmark
- Subscribe
- Printer Friendly Page
- Report Inappropriate Content
02-28-2023
12:53 AM
Background
In a typical ABAP stack system (ECC/BW/CRM…) each month 1000s of different transactions are executed. Often the responsible system administrators and tuning experts ask the question, if is possible to identify the transactions and reports which show a performance degradation.
Due to large number of different transactions, tracing all those transactions is not an option. While the workload analysis monitor (transaction ST03) is providing valuable information about the average response time components, the workload monitor does not indicate if the observed average response times are within an acceptable range and have changed over time.
Transaction /SDF/ST03DL which is available since the release of ST-PI support package 14 or via SAP note 2943445 - Download Historical Workload Data from ST03 was developed to support administrators and tuning experts to answer the following questions:
- What are the top transactions in terms of total response time, DB time, CPU time?
- Which transaction show a performance degradation or improvement over the recent months/weeks?
- How does a given transaction or group of transaction behave over time?
- Can I extract workload Analysis Data from ST03 for multiple periods?

In this article we want to explain in more detail how to use transaction /SDF/ST03DL.
Content
Download
Transaction /SDF/ST03DL is available since 2020 as part of ST-PI support package 14 or via SAP note 2943445 - Download Historical Workload Data from ST03.
Depending on the release and support package level the following additional notes are available:
Prerequisites
The Workload analysis tool /SDF/ST03DL is based on the statistical workload aggregates available in the workload monitor ST03. As such the workload collector job SAP_COLLECTOR_FOR_PERFMONITOR must be activated and executed as described in SAP note 1300273 - SAP_COLLECTOR_FOR_PERFMONITOR: New architecture as of 7.20.
The built in HTML/Javascript analysis tool requires a modern browser (Chrome, Edge, Safari). The tool is based on the open-source JavaScript charting library plotly.js https://plot.ly/javascript/ - (C)opyright 2012-2019, Plotly, Inc. licensed under the MIT license. The source code is available on Github https://github.com/plotly/plotly.js. The analysis tool has been tested with version plotly.js v1.40.0..
Required authorizations are S_TOOLS_EX (normal usage) and additionally S_DATASET if data should be downloaded to the application server.
Usage Instructions
Step 1 - Selection Screen
Start the program via transaction code /SDF/ST03DL or via SE38/SA38 using the program name /SDF/ST03DL.

The following parameters are available on the selection screen:
Host / Instance
Workload Data can be extracted for either selected application server instances or the TOTAL data for all application servers.
Period type
Specify which aggregation levels should be included in the download. Possible values are (Day/Week/Month/All).
Select Workload Data
Select which data should be retrieved from the workload database. Available options are Transaction Profile, RFC Server Profile (RFC Functions), WEB Client Statistics.
Filter
One can use this filter to limit the records to be extracted from the workload database (e.g. SAP*, Z* ...)
Last n completed periods
Select the last n completed periods for the selected period type(s) The actual day/week/month cannot be downloaded as the data is not complete.
Top x transactions / Aggregate transactions by
Limit the number of entries to be downloaded to the top x transactions (in term of total response time). Specify if the transactional Data should be aggregated by task type, time, jobname or server.
Pattern / File name
The output filename will be constructed using the following patterns:
Pattern                 Description

<SID>                   System ID

<SERVER>                Server

<DATE> / <TIME>         Date YYYYMMDD / Time hhmmss

<YYYY> / <MM> / <DD>    Year / Month / Day

<WW>                    Calendar Week

<PT>                    selected Period Type (Day/Week/Month/All)

<LN>                    last n periods
Download Folder
Specify the target directory where the data will be downloaded. If the backend application server is selected then the possible folders should be maintained via transaction FILE for the logical folder name /SDF/ST03DL, if no different path is chosen, then the default folder location will be limited by profile parameter DIR_TEMP.
add. Info (Components & Texts)
If selected, then for each transaction/report/function the corresponding SAP components and texts will be selected. If enabled, this option will slightly increase the runtime of this tool.
List Output (ALV)
If selected, then the workload data will be shown in an ALV grid view from where it can be exported to excel.
Start HTML analysis tool
If selected the program will download and start the HTML/JavaScript Analysis tool HWA.HTML which can be used to analyze the data.
alternative Language
By default, program texts are selected in the user's logon language, if no text is found then the tool will use this alternative language to search for the corresponding texts.
URL to Plotly library
The HTML/JavaScript analysis tool HWA.HTML is based on open-source JavaScript charting library plotly.js https://plot.ly/javascript/ - (C)opyright 2012-2019, Plotly, Inc. Licensed under the MIT license.
(Plotly source available on GitHub https://github.com/plotly/plotly.js)
The URL to the plotly library must be provided on the selection screen. The latest version of plotly.js is available at: https://cdn.plot.ly/plotly-latest.min.js - Parameter ID /SDF/PLOTLY can be used to save a default location for the plotly library.
Step 2 - Execute (ALV Output)
Execute the program F8 - If use choose to display the data (List Output) on the selection Screen the extracted data is shown in an ALV grid from where you can download the data for further analysis.
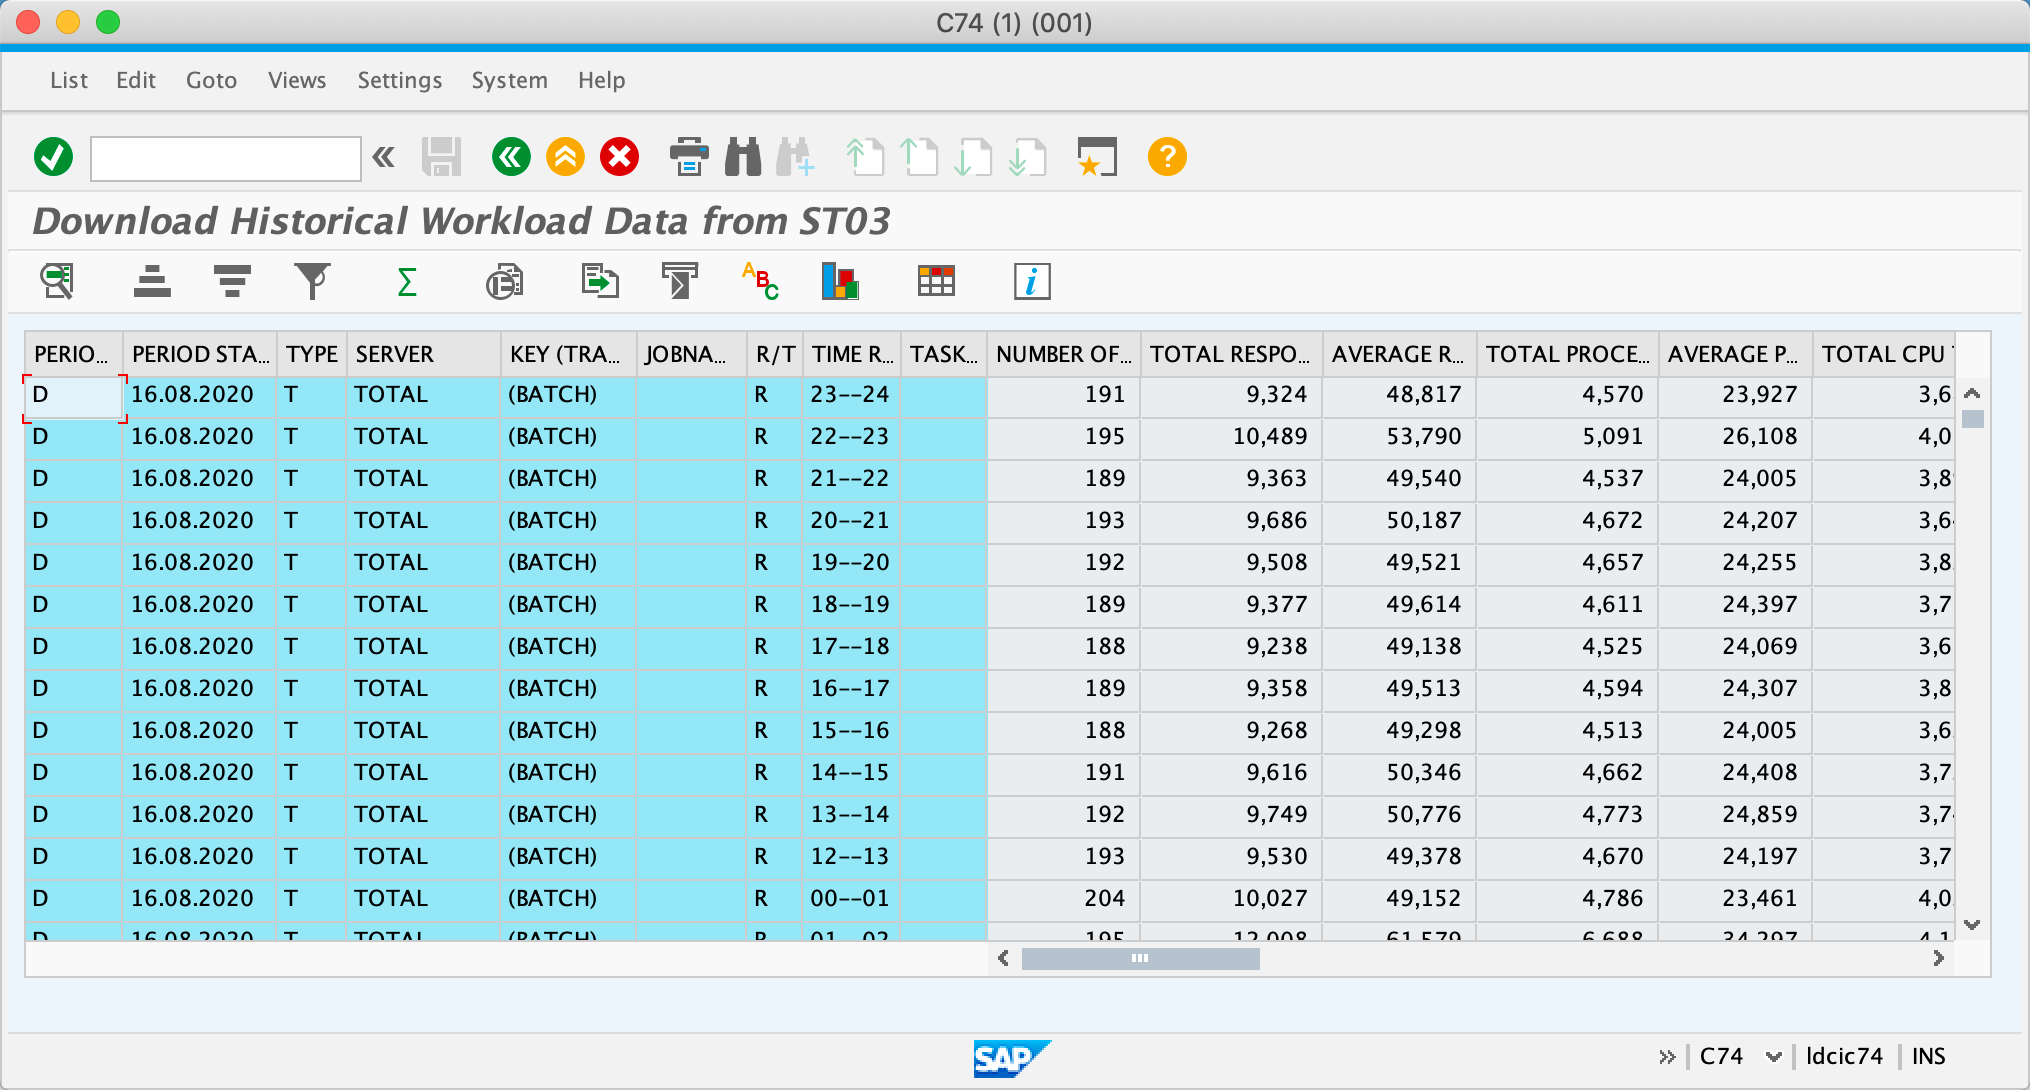
The program /SDF/ST03DL can download from the workload database the Transaction Profile, RFC Server Profile (RFC Functions), WEB Client Statistics.
For the Transaction Profile the following information is available
Period Type (M = Monthly, D = Daily, W = Weekly)

Period Start Date (Start Date of Period)

Type (T = Transaction Profile, F = RFC Server Profile, H = WEB Client Profile)

Server (TOTAL or instance)

Key (Transaction code / Function / URL)

Jobname

R/T (R = Report, T = Transaction)

Time Range (00-01, 01-02, … 23-24)

Task Type

Number of Steps

Total / Average Response time

Total / Average Processing time

Total / Average CPU time

Total / Average Wait time

Total / Average Roll-Wait time

Total / Average Database time

Total / Average GUI time

Total / Average DB Procedure Time

SAP component

Program Text
For RFC Server profile and WEB client statistics only the total response time and number of steps is available.
Step 3 - Download Workload Data
The tool will automatically download the workload data to the specified directory from Step 4 and then download the HTML analysis tool to the folder specified on the selection screen. After the analysis tool HWA.HTML tool has been downloaded the default browser will be started to open the tool - in the above example the URL will be file:///Users/i813812/Downloads/HWA.HTML
Analysis Tool
If on the selection screen the option "Download to Frontend" has been selected the Analysis Tool will be downloaded and automatically opened with the default browser. Once the browser window has loaded, use the button "Choose File" to locate the downloaded workload data from the folder specified on the selection screen. One can also drag and drop the file over the button or open the file content with a text editor and insert into the text area. Use the checkboxes to select which period types should be imported.
Multiple Files:
The Analysis Tool also allows to open multiple files (files should be of the same system) which is useful if different periods and/or period types have been downloaded to multiple files. If the different files should overlap, then duplicate values are automatically removed.

Transaction Overview
The data is now imported into the tool and the result is shown in the initial overview screen.

Generate Graphics
To generate the Date/Time Profile graphics, you have two options:
- single click on ++ Transaction ++ (column header) or
- double-click on the transaction/report name
the Time Profile graphics are generated from within the Date Profile Graphics.
Transaction / Function / Url - On the left side of the table we show the transaction, the total dialog steps, average response time, total response time, total processing time and total DB time for all selected periods. Additionally we show the SAP component and transaction text. The column ranking is indicating the importance of each transaction based on the total response time. The Checkbox on the left indicates if the selected transaction will in included in the overall graphic display.
For each report/transaction the following information is available: 
Baseline - The middle section is showing for the selected key figure the baseline value which is calculated as weighted average of the individual keyfigures for the selected periods. Use button Select Periods / Calculate Baseline to select the periods to be displayed and adjust the weighting factors for the baseline calculation (the baseline is calculated as weighted average of the selected values).
Differences - The right section is showing for each period the percentage difference of the selected keyfigure compared to the calculated baseline value. Example: We have three periods with average response times of 125ms, 145ms, 90ms. The baseline B is calculated as average of this three values B = (125 + 145 + 90)/3 = 120ms. The differences (in percentage) compared to the baseline B are calculated as:
P1: (125-120)/120 = + 4.0%
P2: (145-120)/120 = + 17.2%
P3: (90-120)/120 = - 33.3%
If the keyfigure within a period is less than the baseline then the difference is shown in blue, if the value is larger, then percentage difference is shown in red. The color saturation is reflecting the amount of the difference as indicated in the legend at the bottom of the table.
Use Filters
The 2nd row below the header line can be used to filter transactions. For numeric columns one can choose the options less/greater than a given value; columns containing text values can be filtered using string patters

Select Periods / Calculate Baseline
Use button Select Periods to select the periods to display, one can also adjust the weighting factors to calculate the baseline.

Click on Show/Hide to invert the selection (double click to mark all). a single click on Adj.Factors will set all lines to zero.
Date Profile
From within the overview screen single click on ++ Transaction ++ (column header) or
double-click on the transaction/report name.
The Date Profile is showing for the select periods the average or total response time components for individual transactions (zoom-in for details) or group of selected transactions.
Date Profile (Average Response Time Components)

Date Profile (normalized Total Response Time Components)
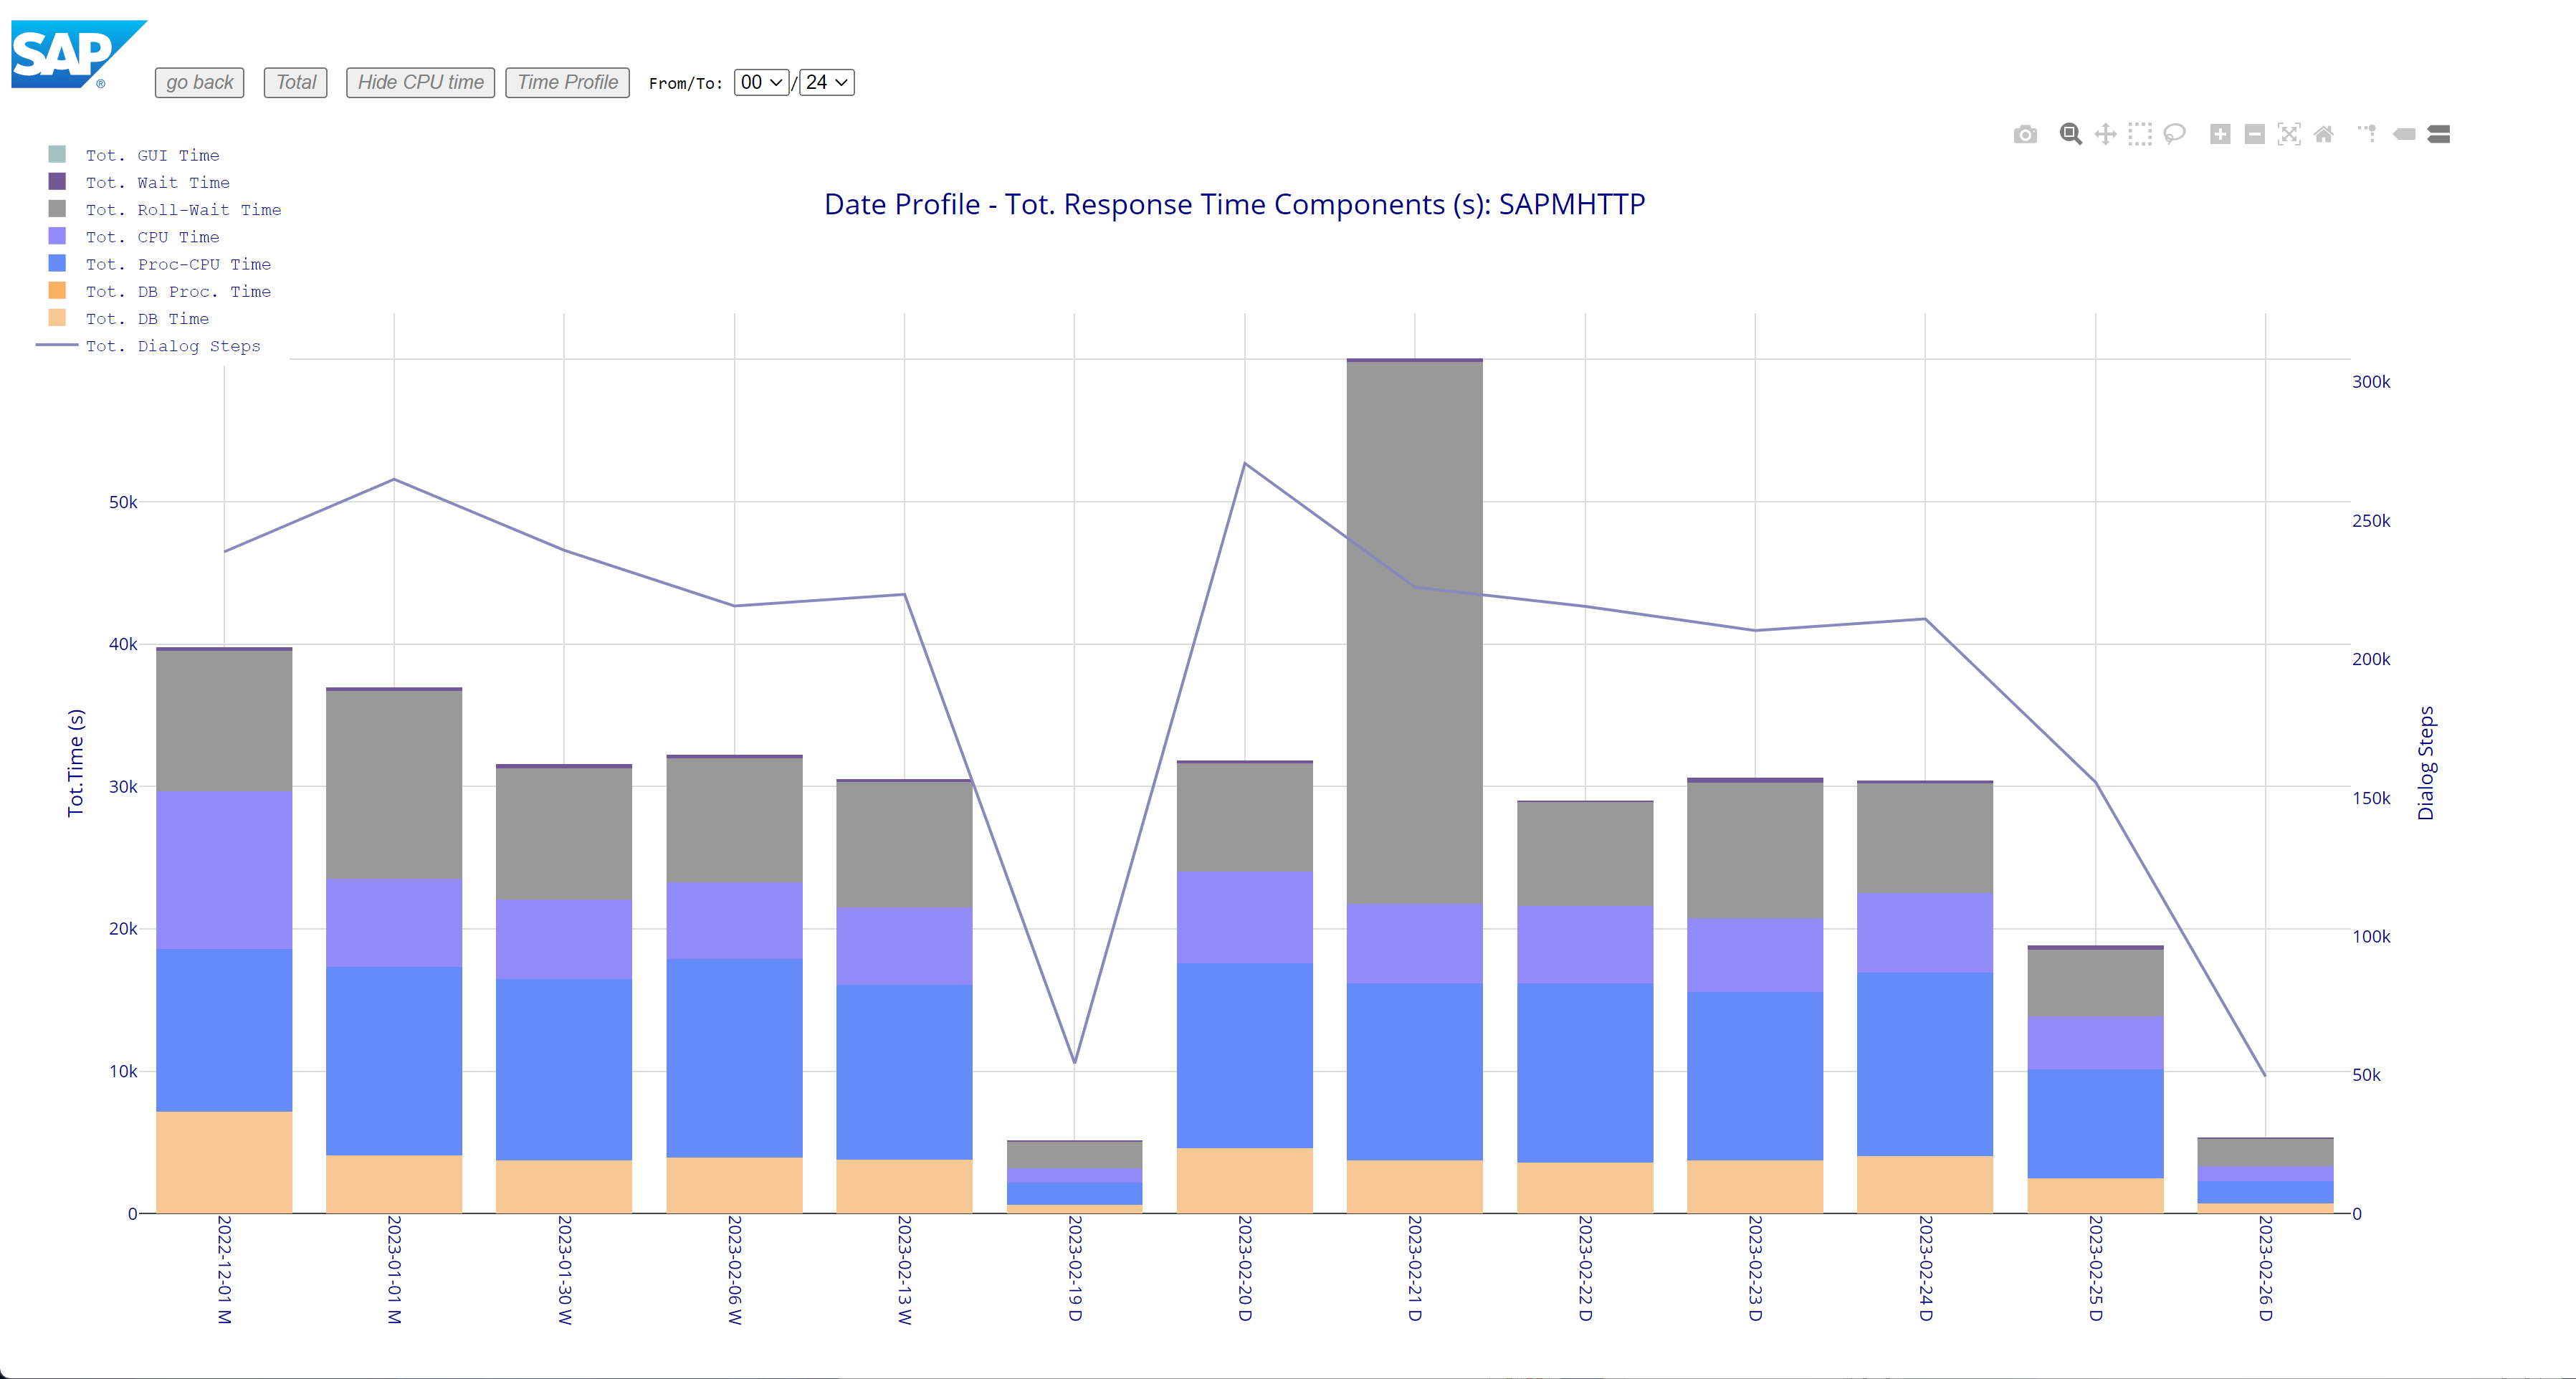
Depending on the settings of the selection screen of the analysis tool the Total values show either the real total values (which are much higher for a monthly average than a weekly/daily average) or the normalized totals where the monthly total will be divided by the specified number of days per months or number of days per week respectively (without this normalization we cannot really compare total values of different time period types). Without this normalization the result shows the real totals like in the example below.
Date Profile (real Total Response Time Components)

without normalization we find that the monthly totals are approximately 4 times higher than the weekly totals which are around 6 times higher than the daily totals.
Time Profile
From within the Date Profile use the button "Time Profile".
If the downloaded data has not been aggregated by time, then the Time Profile is showing for the select periods of the Date Profile the average/total response time component distribution over 24 hours.
Time Profile (Average Response Time Components)

Time Profile (normalized Total Response Time Components)

Examples
Below some examples explaining how to interpret the information from the Analysis Tool.
| For one or multiple days all transaction turn from blue to red. This is most likely caused by an overall system problem affecting all transactions. Possible reasons could be a problem with the database, network, hardware issues or system overload. |
 | One or multiple transactions turn from blue (left side) to red (right side). This is indicating a deterioration of those transactions over time. Double click on the transaction name to see the Date Profile for the selected transaction(s). |
 | In this example we see only minor fluctuations which are normal - the response time components are largely stable and the relationship between processing time (blue) and database time (orange) is not raising any concern. The amount of available data however is limited, the retention periods within ST03 should be increased, |
 | Here we see that the DB times (orange) have increased together with the roll wait times (gray), the high dispatcher wait times indicating non-availability of work processes (dark purple) have improved. |
 | DB times have increased and are at around 75% of the total response time. Such a behavior is often caused by non-optimal select statements on DB tables with a significant growth. Here and SQL trace is recommend together with a TAANA analysis to check the table growth. |
 | Here we see an increase of the processing times which are at approximately 90% of the total response time. Very often this is caused by non-linear runtime statements like READ TABLE without BINARY SERACH, NESTED LOOPs... Here an ABAP trace via SAT or ST12 is recommended to find the root cause. |
Conclusion
I wish you will find the blog helpful. The intention of this article is to give an overview of the Workload Analysis tool /SDF/ST03DL which can provide valuable information about the overall system behavior or the show the response time components of selected transactions over time.
In order to fully benefit from this workload analysis, we strongly recommend increasing the default retention periods within ST03 to 15 days, 12 weeks and 6 months for the instance collectors and to 45 days 60 weeks and 18 months (see below screenshots).
ST03 > Collector and Performance DB > Performance DB > Workload Collector Database > Reorganization > Control
 |  |
Please stay tuned for further enhancements and updates.
- SAP Managed Tags:
- ABAP Development
Labels:
1 Comment
You must be a registered user to add a comment. If you've already registered, sign in. Otherwise, register and sign in.
Labels in this area
-
ABAP CDS Views - CDC (Change Data Capture)
2 -
AI
1 -
Analyze Workload Data
1 -
BTP
1 -
Business and IT Integration
2 -
Business application stu
1 -
Business Technology Platform
1 -
Business Trends
1,661 -
Business Trends
87 -
CAP
1 -
cf
1 -
Cloud Foundry
1 -
Confluent
1 -
Customer COE Basics and Fundamentals
1 -
Customer COE Latest and Greatest
3 -
Customer Data Browser app
1 -
Data Analysis Tool
1 -
data migration
1 -
data transfer
1 -
Datasphere
2 -
Event Information
1,400 -
Event Information
64 -
Expert
1 -
Expert Insights
178 -
Expert Insights
275 -
General
1 -
Google cloud
1 -
Google Next'24
1 -
Kafka
1 -
Life at SAP
784 -
Life at SAP
11 -
Migrate your Data App
1 -
MTA
1 -
Network Performance Analysis
1 -
NodeJS
1 -
PDF
1 -
POC
1 -
Product Updates
4,577 -
Product Updates
329 -
Replication Flow
1 -
RisewithSAP
1 -
SAP BTP
1 -
SAP BTP Cloud Foundry
1 -
SAP Cloud ALM
1 -
SAP Cloud Application Programming Model
1 -
SAP Datasphere
2 -
SAP S4HANA Cloud
1 -
SAP S4HANA Migration Cockpit
1 -
Technology Updates
6,886 -
Technology Updates
407 -
Workload Fluctuations
1
Related Content
- Kyma Integration with SAP Cloud Logging. Part 2: Let's ship some traces in Technology Blogs by SAP
- Capture Your Own Workload Statistics in the ABAP Environment in the Cloud in Technology Blogs by SAP
- explore the business continuity recovery sap solutions on AWS DRS in Technology Blogs by Members
- Value Unlocked! How customers benefit from SAP HANA Cloud in Technology Blogs by SAP
- Deep dive into Q4 2023, What’s New in SAP Cloud ALM for Implementation Blog Series in Technology Blogs by SAP
Top kudoed authors
| User | Count |
|---|---|
| 13 | |
| 10 | |
| 10 | |
| 7 | |
| 7 | |
| 6 | |
| 5 | |
| 5 | |
| 5 | |
| 4 |