
- SAP Community
- Groups
- Interest Groups
- Application Development
- Blog Posts
- Could machine learning build a model for prime num...
Application Development Blog Posts
Learn and share on deeper, cross technology development topics such as integration and connectivity, automation, cloud extensibility, developing at scale, and security.
Turn on suggestions
Auto-suggest helps you quickly narrow down your search results by suggesting possible matches as you type.
Showing results for
Sergiu
Contributor
Options
- Subscribe to RSS Feed
- Mark as New
- Mark as Read
- Bookmark
- Subscribe
- Printer Friendly Page
- Report Inappropriate Content
02-12-2023
11:32 AM
When we think about a prime number we do it in terms of divisibility properties.
Wikipedia. A prime number (or a prime) is a natural number greater than 1 that is not a product of two smaller natural numbers. A natural number greater than 1 that is not prime is called a composite number.
I participated in the SAP HANA ML Challenge – Employee Churn 🤖 and I came in second place 🏆.
Discover the blog I wrote about the challenge and the solution.
The classification stuck in my head for a while and then one day the prime number problem popped up. 💡
Machine learning doesn't solve all problems, but it's worth exploring if it can.
Lex Fridman post:
"Humans are an API to ChatGPT.
ChatGPT is an API to Python.
Python is an API to C.
C is an API to assembly.
Assembly is an API to binary.
Binary is an API to physics.
Physics is an API to the machine that runs the universe.
It's computation all the way down."
Can we express the prime number property as a classification problem?
1. Intervals with prime numbers
2. Intervals with the last digit of the prime
3. Conversion of class into binary
4. Conversion of intervals into binary
5. Splitting binary intervals into columns
6. Reorganizing data with sliding windows
7. Building the models with sliding windows
7.1 Model classification report
7.2 Model confusion matrix
7.3 Prediction classification report
7.4 Prediction confusion matrix
8. Building models with a validation data set
8.1 Model classification report
8.2 Model confusion matrix
8.3 Prediction classification report
8.4 Prediction confusion matrix
8.5 Model performance
9. Building models with early stopping
9.1 Model classification report
9.2 Model confusion matrix
9.3 Prediction classification report
9.4 Prediction confusion matrix
9.5 Model performance
10. Conclusion and further steps
11. Building LSTM model with sliding windows
In the blog, I will only go through the main parts. The entire code is on GitHub, published with my last run.
Let’s try the re-definition of a prime number as a classification problem in binary form.
A prime number could end with [1, 3, 7, 9]. Examples by intervals:
In the interval from 10 to 19 primes are: 11, 13, 17, 19
In the interval from 20 to 29 primes are 23, 29.
The combination [1, 3, 7, 9] is the pattern the class I have to predict.
If prime 1, else 0.
Conversion of class as a list into a string.
That shifts the previous interval and previous prime class. The sliding window can include any number of subsequent previous rows.
Fit with all train data without a validation data set
Model score = 1.000!
However, the maximum prediction score is = 0.562!
The model is capable of learning and then memorizing but it can't generalize the knowledge to predict!
Increasing the sliding windows and allowing overfitting to analyze model performance with train data. Early stopping = 0.
Building models with a validation data set doesn't increase the prediction score, the maximum prediction score = 0.438.
8.4 Prediction confusion matrix
The overfit occurs after 20 epochs.
Stop overfitting to analyze model performance with validation data. Early stopping = 10.
Building models with a validation data set and early stopping doesn't increase the prediction score, the maximum prediction score = 0.500.
Could an RNN keras model improve prediction accuracy? What other features' reengineering could increase the prediction accuracy? 💡
Computations are performed locally so resources are limited.
Could #SapHanaCloud #MachineLearning help to see what's going on beyond the horizon of n_power = 10? 🤔
Is this another attempt to show that machine learning can't build a function for prime numbers? 🙃
Update on 21.03.2022
The LSTM model built with Keras trained on data with sliding windows 24 has an accuracy below XGBoost model.
Recall the results with XGBoost from step 7. Building the models with sliding windows.
Model score = 1.000!
However, the maximum prediction score is = 0.562!
Updated code with LSTM is on GitHub, published with my last.
Importing libraries.
Data preparatiion.
LSTM model.
Enjoy! 🎈🎈🎈
SAP HANA Cloud Machine Learning Challenge “I quit!” – Understanding metrics
Could machine learning build a model for prime numbers?
“Hello, world!” your crafted chat GPT bot!
SAP Machine Learning Embedding in OpenAI
Building Trust in AI: YouTube Transcript OpenAI Assistant
AI Challenge | Web scraping with Generative AI
Wikipedia. A prime number (or a prime) is a natural number greater than 1 that is not a product of two smaller natural numbers. A natural number greater than 1 that is not prime is called a composite number.
I participated in the SAP HANA ML Challenge – Employee Churn 🤖 and I came in second place 🏆.
Discover the blog I wrote about the challenge and the solution.
The classification stuck in my head for a while and then one day the prime number problem popped up. 💡
Machine learning doesn't solve all problems, but it's worth exploring if it can.
Lex Fridman post:
"Humans are an API to ChatGPT.
ChatGPT is an API to Python.
Python is an API to C.
C is an API to assembly.
Assembly is an API to binary.
Binary is an API to physics.
Physics is an API to the machine that runs the universe.
It's computation all the way down."
Can we express the prime number property as a classification problem?
Table of content
1. Intervals with prime numbers
2. Intervals with the last digit of the prime
3. Conversion of class into binary
4. Conversion of intervals into binary
5. Splitting binary intervals into columns
6. Reorganizing data with sliding windows
7. Building the models with sliding windows
7.1 Model classification report
7.2 Model confusion matrix
7.3 Prediction classification report
7.4 Prediction confusion matrix
8. Building models with a validation data set
8.1 Model classification report
8.2 Model confusion matrix
8.3 Prediction classification report
8.4 Prediction confusion matrix
8.5 Model performance
9. Building models with early stopping
9.1 Model classification report
9.2 Model confusion matrix
9.3 Prediction classification report
9.4 Prediction confusion matrix
9.5 Model performance
10. Conclusion and further steps
11. Building LSTM model with sliding windows
In the blog, I will only go through the main parts. The entire code is on GitHub, published with my last run.
1. Intervals with prime numbers
Let’s try the re-definition of a prime number as a classification problem in binary form.
A prime number could end with [1, 3, 7, 9]. Examples by intervals:
In the interval from 10 to 19 primes are: 11, 13, 17, 19
In the interval from 20 to 29 primes are 23, 29.
1->[11, 13, 17, 12]

2->[23, 29]
2. Intervals with the last digit of the prime
The combination [1, 3, 7, 9] is the pattern the class I have to predict.
1->[1, 3, 7, 9]

2->[3, 9]
3. Conversion of class into binary
If prime 1, else 0.
1->[1, 1, 1, 1]

2->[0, 1, 0, 1]
4. Conversion of intervals into binary
Conversion of class as a list into a string.
00000000000001->1111

00000000000010->0101
5. Splitting binary intervals into columns
[0, 0, 0, 0, 0, 0, 0, 0, 0, 0, 0, 0, 0, 1]->[1111]

[0, 0, 0, 0, 0, 0, 0, 0, 0, 0, 0, 0, 1, 0]->[0101]
6. Reorganizing data with sliding windows
That shifts the previous interval and previous prime class. The sliding window can include any number of subsequent previous rows.
# [0, 0, 0, 0, 0, 0, 0, 0, 0, 0, 0, 0, 0, 1]->[1111]


[0, 0, 0, 0, 0, 0, 0, 0, 0, 0, 0, 0, 0, 1], [1, 1, 1, 1], # previous row

[0, 0, 0, 0, 0, 0, 0, 0, 0, 0, 0, 0, 1, 0]->[0101] # current row and class to predict
7. Building the models with sliding windows
Fit with all train data without a validation data set
# In 93:

%%time

n_shifts = 24

for i_shift in range(1, n_shifts):
# Out 93:
model score: 0.521 prediction score: 0.250 shift: 001 (9983, 14) (16, 14) (9983,) (16,)
model score: 0.730 prediction score: 0.375 shift: 002 (9982, 32) (16, 32) (9982,) (16,)
model score: 0.843 prediction score: 0.375 shift: 003 (9981, 50) (16, 50) (9981,) (16,)
model score: 0.907 prediction score: 0.312 shift: 004 (9980, 68) (16, 68) (9980,) (16,)
model score: 0.939 prediction score: 0.375 shift: 005 (9979, 86) (16, 86) (9979,) (16,)
model score: 0.970 prediction score: 0.250 shift: 006 (9978, 104) (16, 104) (9978,) (16,)
model score: 0.981 prediction score: 0.125 shift: 007 (9977, 122) (16, 122) (9977,) (16,)
model score: 0.988 prediction score: 0.312 shift: 008 (9976, 140) (16, 140) (9976,) (16,)
model score: 0.994 prediction score: 0.250 shift: 009 (9975, 158) (16, 158) (9975,) (16,)
model score: 0.997 prediction score: 0.188 shift: 010 (9974, 176) (16, 176) (9974,) (16,)
model score: 0.999 prediction score: 0.312 shift: 011 (9973, 194) (16, 194) (9973,) (16,)
model score: 0.999 prediction score: 0.438 shift: 012 (9972, 212) (16, 212) (9972,) (16,)
model score: 1.000 prediction score: 0.312 shift: 013 (9971, 230) (16, 230) (9971,) (16,)
model score: 1.000 prediction score: 0.438 shift: 014 (9970, 248) (16, 248) (9970,) (16,)
model score: 1.000 prediction score: 0.375 shift: 015 (9969, 266) (16, 266) (9969,) (16,)
model score: 1.000 prediction score: 0.562 shift: 016 (9968, 284) (16, 284) (9968,) (16,)
model score: 1.000 prediction score: 0.375 shift: 017 (9967, 302) (16, 302) (9967,) (16,)
model score: 1.000 prediction score: 0.312 shift: 018 (9966, 320) (16, 320) (9966,) (16,)
model score: 1.000 prediction score: 0.375 shift: 019 (9965, 338) (16, 338) (9965,) (16,)
model score: 1.000 prediction score: 0.375 shift: 020 (9964, 356) (16, 356) (9964,) (16,)
model score: 1.000 prediction score: 0.250 shift: 021 (9963, 374) (16, 374) (9963,) (16,)
model score: 1.000 prediction score: 0.438 shift: 022 (9962, 392) (16, 392) (9962,) (16,)
model score: 1.000 prediction score: 0.375 shift: 023 (9961, 410) (16, 410) (9961,) (16,)
CPU times: total: 1h 24min 1s
Wall time: 32min 49sModel score = 1.000!
However, the maximum prediction score is = 0.562!
The model is capable of learning and then memorizing but it can't generalize the knowledge to predict!
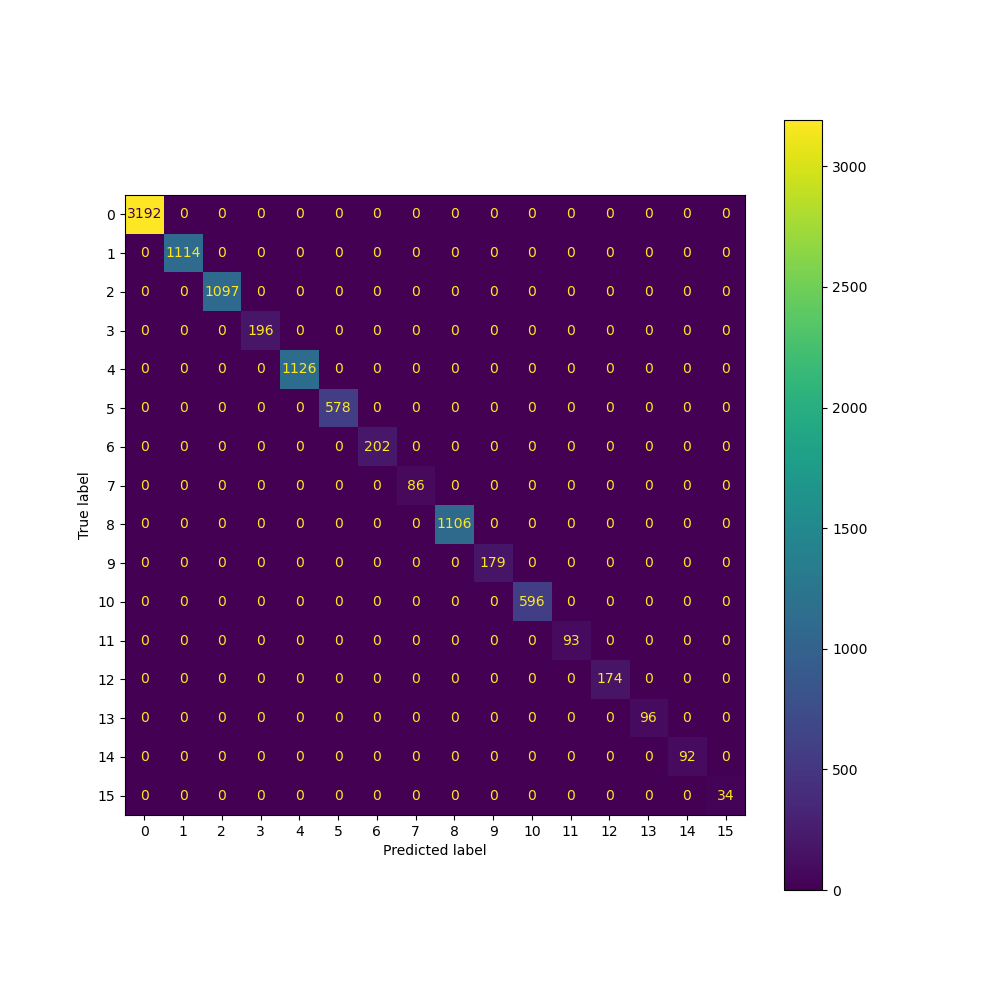
7.1 Model classification report
# Out 96:

array([ 0,  1,  2,  3,  4,  5,  6,  7,  8,  9, 10, 11, 12, 13, 14, 15])


# Out 97:

array(['0000', '0001', '0010', '0011', '0100', '0101', '0110', '0111',

       '1000', '1001', '1010', '1011', '1100', '1101', '1110', '1111'],

      dtype=object)


# 0 ->0000 # interval doesn't have any prime

# 1 ->0001 # prime 0009 # interval has one primes ending with 9

# 15->1111 # prime 1379 # interval has primes ending with 1, 3, 7, 9
# Out 95
precision recall f1-score support
0 1.00 1.00 1.00 3192
1 1.00 1.00 1.00 1114
2 1.00 1.00 1.00 1097
3 1.00 1.00 1.00 196
4 1.00 1.00 1.00 1126
5 1.00 1.00 1.00 578
6 1.00 1.00 1.00 202
7 1.00 1.00 1.00 86
8 1.00 1.00 1.00 1106
9 1.00 1.00 1.00 179
10 1.00 1.00 1.00 596
11 1.00 1.00 1.00 93
12 1.00 1.00 1.00 174
13 1.00 1.00 1.00 96
14 1.00 1.00 1.00 92
15 1.00 1.00 1.00 34
accuracy 1.00 9961
macro avg 1.00 1.00 1.00 9961
weighted avg 1.00 1.00 1.00 9961
7.2 Model confusion matrix
7.3 Prediction classification report
# Out 99:


              precision    recall  f1-score   support


           0       0.45      0.71      0.56         7

           1       1.00      0.00      0.00         2

           2       0.00      1.00      0.00         0

           4       0.00      1.00      0.00         0

           5       1.00      0.00      0.00         1

           8       0.50      0.25      0.33         4

          10       1.00      0.00      0.00         2


    accuracy                           0.38        16

   macro avg       0.56      0.42      0.13        16

weighted avg       0.64      0.38      0.33        16
7.4 Prediction confusion matrix

8. Building models with a validation data set
Increasing the sliding windows and allowing overfitting to analyze model performance with train data. Early stopping = 0.
# In 101:


%%time

# n_shifts = 24

for i_shift in range(1, n_shifts):

    X_train, X_test, y_train, y_test = f_Xy_train_Xy_test(i_shift, df)
# 101:
model score: 0.534 prediction score: 0.250 shift: 001 (9983, 14) (16, 14) (9983,) (16,)
model score: 0.675 prediction score: 0.188 shift: 002 (9982, 32) (16, 32) (9982,) (16,)
model score: 0.744 prediction score: 0.250 shift: 003 (9981, 50) (16, 50) (9981,) (16,)
model score: 0.783 prediction score: 0.312 shift: 004 (9980, 68) (16, 68) (9980,) (16,)
model score: 0.808 prediction score: 0.250 shift: 005 (9979, 86) (16, 86) (9979,) (16,)
model score: 0.810 prediction score: 0.438 shift: 006 (9978, 104) (16, 104) (9978,) (16,)
model score: 0.814 prediction score: 0.438 shift: 007 (9977, 122) (16, 122) (9977,) (16,)
model score: 0.816 prediction score: 0.375 shift: 008 (9976, 140) (16, 140) (9976,) (16,)
model score: 0.818 prediction score: 0.375 shift: 009 (9975, 158) (16, 158) (9975,) (16,)
model score: 0.821 prediction score: 0.375 shift: 010 (9974, 176) (16, 176) (9974,) (16,)
model score: 0.816 prediction score: 0.375 shift: 011 (9973, 194) (16, 194) (9973,) (16,)
model score: 0.825 prediction score: 0.438 shift: 012 (9972, 212) (16, 212) (9972,) (16,)
model score: 0.820 prediction score: 0.375 shift: 013 (9971, 230) (16, 230) (9971,) (16,)
model score: 0.825 prediction score: 0.375 shift: 014 (9970, 248) (16, 248) (9970,) (16,)
model score: 0.822 prediction score: 0.438 shift: 015 (9969, 266) (16, 266) (9969,) (16,)
model score: 0.821 prediction score: 0.438 shift: 016 (9968, 284) (16, 284) (9968,) (16,)
model score: 0.825 prediction score: 0.438 shift: 017 (9967, 302) (16, 302) (9967,) (16,)
model score: 0.818 prediction score: 0.250 shift: 018 (9966, 320) (16, 320) (9966,) (16,)
model score: 0.822 prediction score: 0.375 shift: 019 (9965, 338) (16, 338) (9965,) (16,)
model score: 0.819 prediction score: 0.188 shift: 020 (9964, 356) (16, 356) (9964,) (16,)
model score: 0.825 prediction score: 0.375 shift: 021 (9963, 374) (16, 374) (9963,) (16,)
model score: 0.819 prediction score: 0.500 shift: 022 (9962, 392) (16, 392) (9962,) (16,)
model score: 0.823 prediction score: 0.250 shift: 023 (9961, 410) (16, 410) (9961,) (16,)
CPU times: total: 1h 8min 9s
Wall time: 29min 35sBuilding models with a validation data set doesn't increase the prediction score, the maximum prediction score = 0.438.
8.1 Model classification report
# Out 106:

              precision    recall  f1-score   support


           0       0.77      0.90      0.83      3192

           1       0.83      0.79      0.81      1114

           2       0.86      0.78      0.82      1097

           3       0.88      0.75      0.81       196

           4       0.83      0.79      0.81      1126

           5       0.91      0.79      0.84       578

           6       0.87      0.80      0.83       202

           7       0.97      0.70      0.81        86

           8       0.81      0.82      0.82      1106

           9       0.90      0.77      0.83       179

          10       0.94      0.75      0.83       596

          11       0.97      0.75      0.85        93

          12       0.87      0.75      0.81       174

          13       0.92      0.83      0.87        96

          14       0.94      0.79      0.86        92

          15       0.96      0.76      0.85        34


    accuracy                           0.82      9961

   macro avg       0.89      0.78      0.83      9961

weighted avg       0.83      0.82      0.82      9961
8.2 Model confusion matrix

8.3 Prediction classification report
# Out 110:


   precision    recall  f1-score   support


           0       0.36      0.57      0.44         7

           1       0.00      0.00      0.00         2

           2       0.00      1.00      0.00         0

           4       0.00      1.00      0.00         0

           5       1.00      0.00      0.00         1

           8       1.00      0.00      0.00         4

          10       1.00      0.00      0.00         2

          11       0.00      1.00      0.00         0


    accuracy                           0.25        16

   macro avg       0.42      0.45      0.06        16

weighted avg       0.60      0.25      0.19        16
8.4 Prediction confusion matrix
8.5 Model performance

The overfit occurs after 20 epochs.
9. Building models with early stopping
Stop overfitting to analyze model performance with validation data. Early stopping = 10.
# Out 113:


model score: 0.329 prediction score: 0.375 shift: 001     (9983, 14) (16, 14) (9983,) (16,)

model score: 0.373 prediction score: 0.438 shift: 002     (9982, 32) (16, 32) (9982,) (16,)

model score: 0.377 prediction score: 0.438 shift: 003     (9981, 50) (16, 50) (9981,) (16,)

model score: 0.402 prediction score: 0.375 shift: 004     (9980, 68) (16, 68) (9980,) (16,)

model score: 0.439 prediction score: 0.375 shift: 005     (9979, 86) (16, 86) (9979,) (16,)

model score: 0.467 prediction score: 0.312 shift: 006     (9978, 104) (16, 104) (9978,) (16,)

model score: 0.508 prediction score: 0.375 shift: 007     (9977, 122) (16, 122) (9977,) (16,)

model score: 0.529 prediction score: 0.375 shift: 008     (9976, 140) (16, 140) (9976,) (16,)

model score: 0.542 prediction score: 0.375 shift: 009     (9975, 158) (16, 158) (9975,) (16,)

model score: 0.579 prediction score: 0.500 shift: 010     (9974, 176) (16, 176) (9974,) (16,)

model score: 0.547 prediction score: 0.375 shift: 011     (9973, 194) (16, 194) (9973,) (16,)

model score: 0.570 prediction score: 0.375 shift: 012     (9972, 212) (16, 212) (9972,) (16,)

model score: 0.569 prediction score: 0.375 shift: 013     (9971, 230) (16, 230) (9971,) (16,)

model score: 0.628 prediction score: 0.312 shift: 014     (9970, 248) (16, 248) (9970,) (16,)

model score: 0.619 prediction score: 0.375 shift: 015     (9969, 266) (16, 266) (9969,) (16,)

model score: 0.617 prediction score: 0.438 shift: 016     (9968, 284) (16, 284) (9968,) (16,)

model score: 0.637 prediction score: 0.312 shift: 017     (9967, 302) (16, 302) (9967,) (16,)

model score: 0.626 prediction score: 0.438 shift: 018     (9966, 320) (16, 320) (9966,) (16,)

model score: 0.608 prediction score: 0.375 shift: 019     (9965, 338) (16, 338) (9965,) (16,)

model score: 0.667 prediction score: 0.312 shift: 020     (9964, 356) (16, 356) (9964,) (16,)

model score: 0.656 prediction score: 0.375 shift: 021     (9963, 374) (16, 374) (9963,) (16,)

model score: 0.669 prediction score: 0.375 shift: 022     (9962, 392) (16, 392) (9962,) (16,)

model score: 0.664 prediction score: 0.375 shift: 023     (9961, 410) (16, 410) (9961,) (16,)

CPU times: total: 22min 34s

Wall time: 10min 22s
Building models with a validation data set and early stopping doesn't increase the prediction score, the maximum prediction score = 0.500.
9.1 Model classification report
# Out 114:


              precision    recall  f1-score   support


           0       0.59      0.87      0.70      3192

           1       0.70      0.61      0.65      1114

           2       0.70      0.60      0.64      1097

           3       0.73      0.51      0.60       196

           4       0.71      0.60      0.65      1126

           5       0.84      0.56      0.67       578

           6       0.77      0.48      0.59       202

           7       0.93      0.50      0.65        86

           8       0.66      0.60      0.63      1106

           9       0.76      0.23      0.35       179

          10       0.88      0.49      0.63       596

          11       1.00      0.29      0.45        93

          12       0.82      0.55      0.66       174

          13       0.91      0.70      0.79        96

          14       0.97      0.65      0.78        92

          15       0.93      0.76      0.84        34


    accuracy                           0.66      9961

   macro avg       0.81      0.56      0.64      9961

weighted avg       0.69      0.66      0.66      9961
9.2 Model confusion matrix

9.3 Prediction classification report
# Out 116:


              precision    recall  f1-score   support


           0       0.42      0.71      0.53         7

           1       1.00      0.00      0.00         2

           4       0.00      1.00      0.00         0

           5       1.00      0.00      0.00         1

           6       0.00      1.00      0.00         0

           8       1.00      0.25      0.40         4

          10       0.00      0.00      0.00         2


    accuracy                           0.38        16

   macro avg       0.49      0.42      0.13        16

weighted avg       0.62      0.38      0.33        16
9.4 Prediction confusion matrix

9.5 Model performance

10. Conclusion and further steps
Could an RNN keras model improve prediction accuracy? What other features' reengineering could increase the prediction accuracy? 💡
Computations are performed locally so resources are limited.
Could #SapHanaCloud #MachineLearning help to see what's going on beyond the horizon of n_power = 10? 🤔
Is this another attempt to show that machine learning can't build a function for prime numbers? 🙃
Update on 21.03.2022
11. Building LSTM model with sliding windows
The LSTM model built with Keras trained on data with sliding windows 24 has an accuracy below XGBoost model.
Recall the results with XGBoost from step 7. Building the models with sliding windows.
Model score = 1.000!
However, the maximum prediction score is = 0.562!
Updated code with LSTM is on GitHub, published with my last.
Importing libraries.
# In 120:

import numpy as np

from keras.models import Sequential

from keras.layers import Dense, LSTM, TimeDistributed

from keras.utils import to_categorical

import matplotlib.pyplot as plt
Data preparatiion.
# In 121:

n_shifts = 24 #sliding window

X_train, X_test, y_train, y_test = f_Xy_train_Xy_test(n_shifts, df)
LSTM model.
# In 132:

%%time

# create a sequential model

# https://keras.io/api/layers/recurrent_layers/lstm/


model = Sequential()


input_shape_timesteps = X_train.shape[1]

input_shape_feature = X_train.shape[2]


model.add(LSTM(32, input_shape=(input_shape_timesteps, input_shape_feature)))


# add two hidden layers with 16 and 8 units and relu activation

model.add(Dense(16, activation='relu'))

model.add(Dense(8, activation='relu'))


# add a dense output layer with 16 units and softmax activation

model.add(Dense(16, activation='softmax'))


# compile the model with categorical cross-entropy loss and adam optimizer

model.compile(loss='categorical_crossentropy', optimizer='adam', metrics=['accuracy'])


# train the model for 50 epochs

history = model.fit(X_train, y_train, epochs=50, batch_size=32, validation_data=(X_test, y_test), verbose=0)


# evaluate the model on the training and testing data

train_loss, train_acc = model.evaluate(X_train, y_train, verbose=1)

test_loss, test_acc = model.evaluate(X_test, y_test, verbose=1)


print(f"Training accuracy: {train_acc:.4f}")

print(f"Testing accuracy: {test_acc:.4f}")
LSTM loss

LSTM accuracy
# Out 136:

    precision    recall  f1-score   support


           0       0.32      1.00      0.49      3192

           1       1.00      0.00      0.00      1114

           2       1.00      0.00      0.00      1097

           3       1.00      0.00      0.00       196

           4       1.00      0.00      0.00      1126

           5       1.00      0.00      0.00       577

           6       1.00      0.00      0.00       202

           7       1.00      0.00      0.00        86

           8       1.00      0.00      0.00      1106

           9       1.00      0.00      0.00       179

          10       1.00      0.00      0.00       596

          11       1.00      0.00      0.00        93

          12       1.00      0.00      0.00       174

          13       1.00      0.00      0.00        96

          14       1.00      0.00      0.00        92

          15       1.00      0.00      0.00        34


    accuracy                           0.32      9960

   macro avg       0.96      0.06      0.03      9960

weighted avg       0.78      0.32      0.16      9960
Model classification report
# Out 137:

              precision    recall  f1-score   support


           0       0.44      1.00      0.61         7

           1       1.00      0.00      0.00         2

           5       1.00      0.00      0.00         1

           8       1.00      0.00      0.00         4

          10       1.00      0.00      0.00         2


    accuracy                           0.44        16

   macro avg       0.89      0.20      0.12        16

weighted avg       0.75      0.44      0.27        16
Prediction classification report
Enjoy! 🎈🎈🎈
Blog series
SAP HANA Cloud Machine Learning Challenge “I quit!” – Understanding metrics
Could machine learning build a model for prime numbers?
“Hello, world!” your crafted chat GPT bot!
SAP Machine Learning Embedding in OpenAI
Building Trust in AI: YouTube Transcript OpenAI Assistant
AI Challenge | Web scraping with Generative AI
- SAP Managed Tags:
- Machine Learning,
- Python,
- Artificial Intelligence
You must be a registered user to add a comment. If you've already registered, sign in. Otherwise, register and sign in.
Labels in this area
-
A Dynamic Memory Allocation Tool
1 -
ABAP
8 -
abap cds
1 -
ABAP CDS Views
14 -
ABAP class
1 -
ABAP Cloud
1 -
ABAP Development
4 -
ABAP in Eclipse
1 -
ABAP Keyword Documentation
2 -
ABAP OOABAP
2 -
ABAP Programming
1 -
abap technical
1 -
ABAP test cockpit
7 -
ABAP test cokpit
1 -
ADT
1 -
Advanced Event Mesh
1 -
AEM
1 -
AI
1 -
API and Integration
1 -
APIs
8 -
APIs ABAP
1 -
App Dev and Integration
1 -
Application Development
2 -
application job
1 -
archivelinks
1 -
Automation
4 -
BTP
1 -
CAP
1 -
CAPM
1 -
Career Development
3 -
CL_GUI_FRONTEND_SERVICES
1 -
CL_SALV_TABLE
1 -
Cloud Extensibility
8 -
Cloud Native
7 -
Cloud Platform Integration
1 -
CloudEvents
2 -
CMIS
1 -
Connection
1 -
container
1 -
Debugging
2 -
Developer extensibility
1 -
Developing at Scale
4 -
DMS
1 -
dynamic logpoints
1 -
Eclipse ADT ABAP Development Tools
1 -
EDA
1 -
Event Mesh
1 -
Expert
1 -
Field Symbols in ABAP
1 -
Fiori
1 -
Fiori App Extension
1 -
Forms & Templates
1 -
IBM watsonx
1 -
Integration & Connectivity
10 -
JavaScripts used by Adobe Forms
1 -
joule
1 -
NodeJS
1 -
ODATA
3 -
OOABAP
3 -
Outbound queue
1 -
Product Updates
1 -
Programming Models
13 -
Restful webservices Using POST MAN
1 -
RFC
1 -
RFFOEDI1
1 -
SAP BAS
1 -
SAP BTP
1 -
SAP Build
1 -
SAP Build apps
1 -
SAP Build CodeJam
1 -
SAP CodeTalk
1 -
SAP Odata
1 -
SAP UI5
1 -
SAP UI5 Custom Library
1 -
SAPEnhancements
1 -
SapMachine
1 -
security
3 -
text editor
1 -
Tools
16 -
User Experience
5
Top kudoed authors
| User | Count |
|---|---|
| 6 | |
| 5 | |
| 3 | |
| 3 | |
| 2 | |
| 2 | |
| 2 | |
| 2 | |
| 1 | |
| 1 |