Overview
In this blog post, we will show how we recently handled a request regarding implementing Inline Time Series column on SAC. Since SAC supports only In-Cell Chart, we took advantage of R functionality and through the usage of SparkLines we managed to provide a solution.
Use case
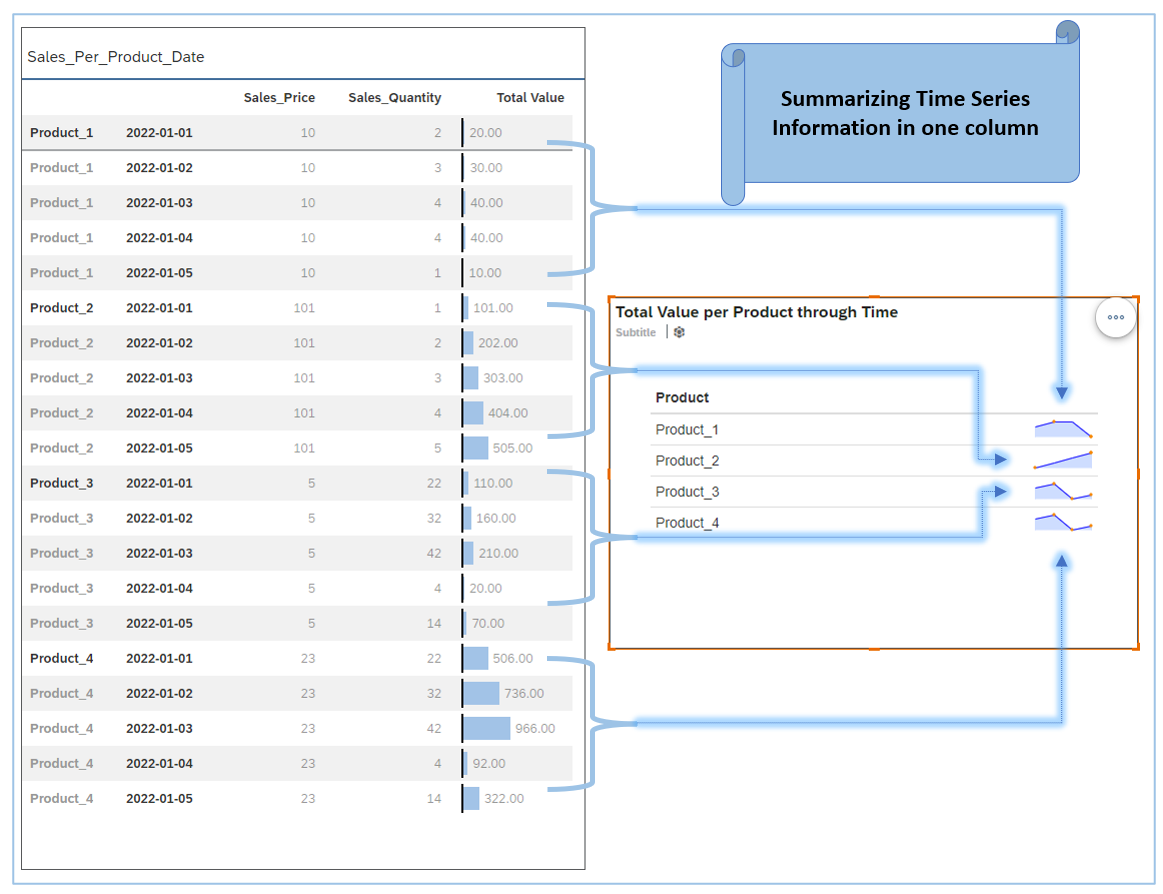
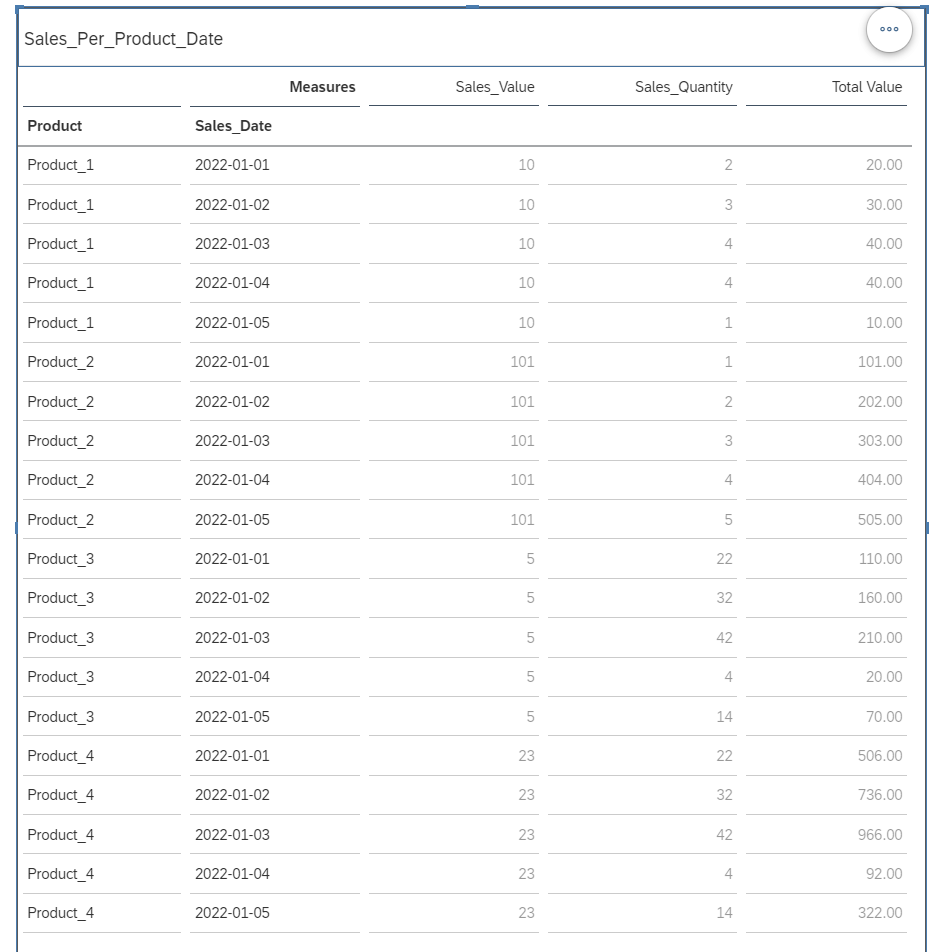
In order to keep the scenario as simple as possible, the below Data model will be used. For each of our four products ,we have the "Quantity" and the "Price" sold, by date. A derived column was needed in order to calculate the "Total Sales", which is the result of multiplying the "Quantity" sold with the "Price".
Then, by using the In-Cell Chart option on the desired column, we were able to show the value of this column ("Total Sales") on a graph format. But, when we want to go to the next step, to summarize all this information in one graph per column, it was not possible.But, by using R functionality and Sparklines it was. So instead of having a table widget on our story , we now use an R one.
Following this link ,
How to Add Sparklines to a Table Using the Formattable R Package speed up our process.
R widget

Summary
In a summary, this simple solution highlights the power of SAC, by using its basic tools, to be able to create whatever you want. Moreover, the benefits of this solution should not only focus to the technical capabilities of SAC but also to the business ones. By this solution, business users have at once the same kind of information but only on the 1/5 of the initial size. This mean that for the same size on the Dashboard, now the users can have 5 times more summarized information (analyzing the issue from different angle) which can lead them to a safer business decision without wasting time by navigating to different report pages.
