Intelligent Selling Services for SAP Commerce Cloud support merchants in taking customers on a personalized product discovery journey, leading to higher order values and merchant profitability. Intelligent Selling Services not only allow merchants to create and apply a set of merchandising strategies, but also to optimize them with the help of A/B tests and reports. In this blog post, you can learn how to optimize merchandising carousels with influencers and A/B tests.
You may remember our merchant, Sarah, from Part 1 of this blog post series, where we looked at how to
Reduce Bounce Rates with Intelligent Selling Services. By adding AI-powered merchandising carousels to the BestRun e-commerce site, Sarah managed to not only reduce bounce rates, but also increase session duration, add-to-cart and conversion rates, and number of orders and order values. Based on her initial experience, she would now like to test and optimize AI-powered merchandising carousels to help improve conversion rates and order values even further.
She decides to
A/B test a couple of product mix versions in the trending product carousel on the homepage, to learn which perform best against the set business KPIs. She would like to run a test that boosts products with the highest view-to-cart rate, i.e., how many times a particular product was added to the cart divided by how many times it was viewed in total. To do that, she creates two product mixes, A and B, and selects the Trending Products setting for both. Since Trending Products require at least one influencer, she sets the influencer “add to cart rate” to +50 for Product Mix A. For Product Mix B, she sets the “add to cart rate” influencer to +50 and the “product page views” influencer to –50 so that the products with the least views that have been added most to cart, are boosted in the carousel. She creates a
test strategy and assigns the two product mixes with a traffic split of 50/50, and schedules it to run for the next week.
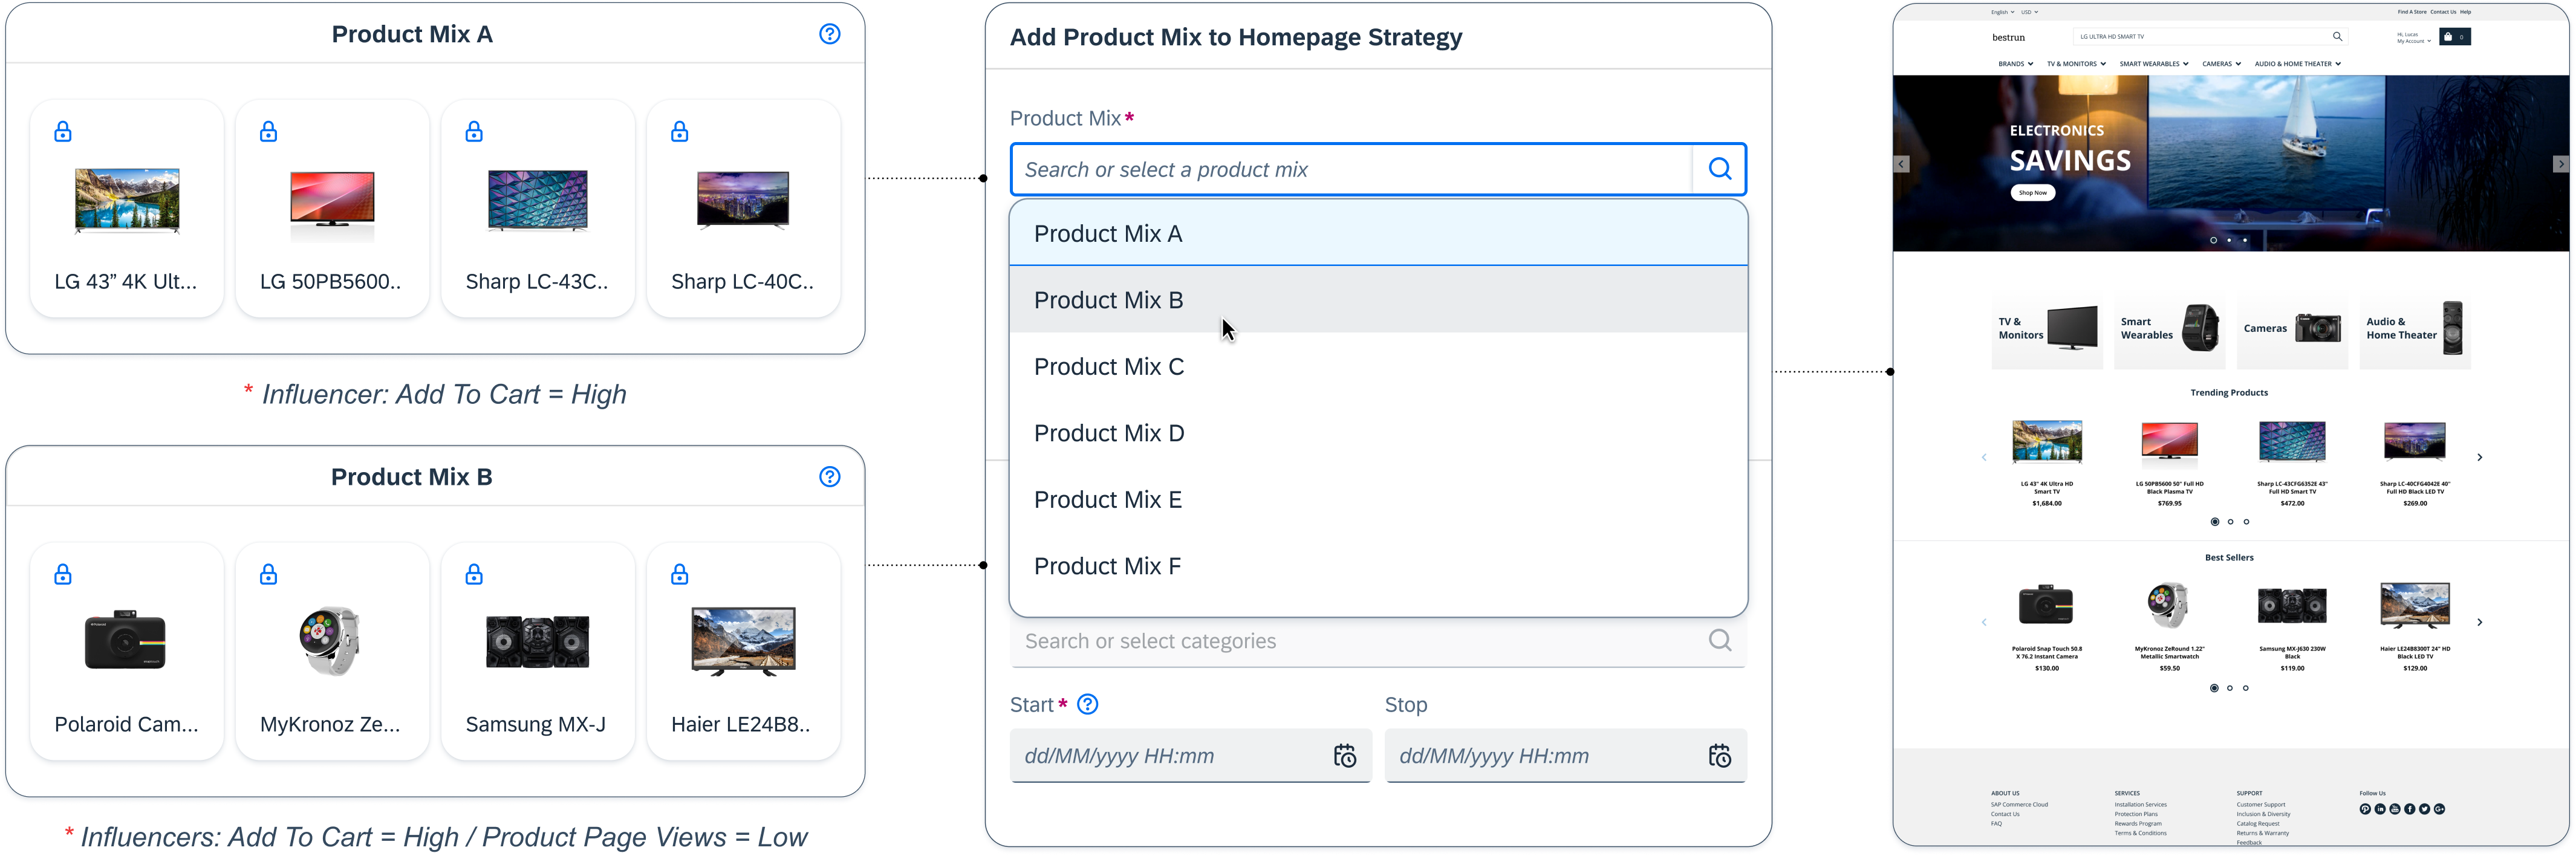
A/B test of product mixes in trending products carousel on homepage.
She also adds an A/B test to find out whether a carousel slot with personalized products versus one with trending products works best on category pages. She creates Product Mix C with a trending products recommendation type and Product Mix D with a personalized products recommendation type. For both product mixes, she sets the
category sensitivity to “Current Category”, meaning that the AI will only display products from the current page category. Finally, she assigns the product mixes with a traffic split of 50/50 in Strategy 2 which is linked to the merchandising carousel on category pages.

A/B test of product mixes in personalized products carousel on category pages.
In the meantime, Peter, a customer, has received his first order from BestRun and is very happy with the delivery process and his new products. He is curious to explore other interesting products and returns to the BestRun storefront to have a look. He sees the
trending products carousel and clicks on a few products. On a category page, he sees the
personalised products carousel with products dynamically selected based on real-time data from his click-path and top sellers. Peter ends up buying a set of rear speaker stands as well as a new headset. For every user interaction with carousels, products, adding to cart and checking out, data is sent to the backend and product recommendation results are improved both for Peter and other customers.

Peter's journey on the BestRun e-commerce site, personalized by AI.
A week later, Sarah, the merchant, goes to
A/B Test Reporting to review how the product mixes in the A/B tests performed. She can see that the trending product carousel has been viewed 10,000 times. She sees that the Product Mix B has a 50% click-through rate (CTR) and 5% conversation rate (CVR), while Product Mix A has a 30% CTR and 3% CVR. This indicates that product mix B was more efficient in accelerating the exposure of trending products. Product Mix D in the Trending vs. Personalized Products Merchandising Carousel also has a slightly better performance than Product Mix C, indicating that personalized rather than trending products, performs better at achieving conversions on the category page. Comparing the CTR and CVR of the carousels with the numbers in her web analytics tool, she can confirm that the carousels have a higher CVR than the general site CVR at 3% and that the site CVR increased 0.5% compared to the week before. Conversion rate and order numbers are up, and she also sees an increase in average order value. She decides to continue to test the product mixes to fine-tune the performance further.

A/B test report
In this example you have seen how the use of advanced reporting and A/B testing capabilities of ISS can improve click-through and conversion rates and generate additional profit.
To learn more about how to set up and experiment with the merchandising capabilities and merchant controls offered by ISS, read the
detailed documentation on SAP Help Portal.
