
- SAP Community
- Products and Technology
- Technology
- Technology Blogs by SAP
- What is the first thing to do for critical ABAP sy...
Technology Blogs by SAP
Learn how to extend and personalize SAP applications. Follow the SAP technology blog for insights into SAP BTP, ABAP, SAP Analytics Cloud, SAP HANA, and more.
Turn on suggestions
Auto-suggest helps you quickly narrow down your search results by suggesting possible matches as you type.
Showing results for
Advisor
Options
- Subscribe to RSS Feed
- Mark as New
- Mark as Read
- Bookmark
- Subscribe
- Printer Friendly Page
- Report Inappropriate Content
01-19-2023
1:08 AM
The thinking about ABAP system-wide issues
Have you ever worked on an ABAP system-wide issue, e.g. system hang, system slowness, resource bottleneck, or high business load situations?
The ABAP system-wide issue is the most critical and urgent issue for system administrators. Meanwhile, it is also usually complex, because the root cause might be related to different areas. We SAP MCC Global Technical Backoffice work on such cases almost every day because it is our daily work to support the critical system-wide problems reported by our customers all over the world. In this blog post, we would like to share our idea about what is the first thing to do when ABAP system-wide issues happen. This blog post will cover the following aspects.
- Q1: What is the first thing to do when critical ABAP system-wide issues happen?
A1: It's to collect the traces, logs, and evidence. So we could always find out the root cause even if we restarted the system or the symptom is gone by itself. When we know the root cause, we will be able to solve it and avoid the reoccurrence.
- Q1: What is the first thing to do when critical ABAP system-wide issues happen?
- Q2: What is the best and easiest way to collect the trace or log for ABAP system-wide issues?
A2: It's to trigger a kernel snapshot (aka server snapshot). We will show you the reason later.
- Q2: What is the best and easiest way to collect the trace or log for ABAP system-wide issues?
- Q3: What's the best way to analyze the kernel snapshot that was collected in Q2?
A3: The answer is the tool kernel snapshot analyzer. Its 1st version is released in 2019. We keep improving this tool for years, and we will also show you the latest features and improvements in the latest version 1.0.0.20230111 (KBA 3110588, download link) with examples later in this blog post.
- Q3: What's the best way to analyze the kernel snapshot that was collected in Q2?
I guess you will be curious about why we have the above answers. So let's just start. Let's have a look at the above topics one by one.
Q1: What is the first thing to do when critical ABAP system-wide issues happen?
I think we all agree that the first thing is to collect the traces, logs, and evidence. So later the system administrator could do the root cause analysis. Or if it is needed, the system administrator could open an incident and involve SAP's support. We must find out the root cause, so we can solve the issue and avoid it from happening again.
But there is a challenge for the system administrators to collect the evidence. Because of the criticality and urgency, the administrator usually can not wait for a long time until the root cause is found, and sometimes he has to consider restarting the system to bring the system back to normal as soon as possible for business usage. Furthermore, the collected information might be not enough for the root cause analysis, but we are not able to collect more information if the system is restarted or the symptom is gone by itself. Because of the criticality and urgency, the action to collect the evidence must be easy and fast. It does not make sense if we need half an hour to collect all the information for troubleshooting.
This challenge is just what we want to discuss in the next section: "What is the best and easiest way to collect the trace or log?"
Q2: What is the best and easiest way to collect the trace or log for ABAP system-wide issues?
The answer is to trigger a kernel snapshot (aka server snapshot, a feature that is available since SAP NetWeaver ABAP Kernel 740).
Why? It is because the kernel snapshot is not a single trace, but a collection of the most important troubleshooting information, for example, it includes
- Work process table (SM50)
- Session Details (SM04)
- RFC connection information (SMGW, SM51 => Information => Communication => RFC Connections)
- HTTP/HTTPS connection (SMICM)
- The ABAP stack and Kernel C stack of every work process (SM50 => Administration => Work Process => Write Stack)
- Memory usage information (a part of ST02)
- Dev* traces, e.g. dev_disp, dev_rd, dev_icm, dev_w* (ST11, or the work folder: /usr/sap/<System-ID>/<Instance>/work)
- Request queue (SM51 => Information => Queue Information)
- System Log (SM21)
- The profile setting (RZ10 & RZ11, or the profile folder: /usr/sap/<System-ID>/SYS/profile/)
- Parameter check result (command sappfpar)
- ....... (more information)
It contains typical troubleshooting information from common BASIS T-Codes. It also contains almost all the information that is available in SAP MMC like the following screenshot. The kernel snapshot file can also be viewed later in SAP MMC. Just like the metaphor "snapshot", the design purpose of kernel snapshot is to take a snapshot of all the most important system runtime information at a specific time point so that it can be analyzed later.

This is why generating a kernel snapshot is the best and easiest way to collect the information for ABAP system-wide issues. The system will automatically create kernel snapshots for us when the system thinks something wrong happened. But in case it's not created automatically, we can also create it manually via SM50 or dpmon following the steps in the KBA below.
- KBA 3122914 - The step-by-step guide to collect a server snapshot and analyze it with kernel snapshot analyzer
Q3: What's the best way to analyze the kernel snapshot?
Previously, the expert have to load the kernel snapshot file into SAP MMC or evaluate the snapshot information in the developer trace (dev*). Both of them need expertise and a lot of many efforts, e.g.
- There is too much raw information to analyze.
- Sometimes, it needs a lot of calculation and aggregation to get a conclusion, e.g. which session, user, or program used most of the resources.
- Sometimes, we also have to link different kinds of information together to get a conclusion, e.g. follow up the RFC chain to find out who triggered the active RFC sessions running on dialog work processes.
- ......
To simplify the analysis of ABAP system-wide issues based on kernel snapshot, we created the tool kernel snapshot analyzer (Central KBA: 3110588) and already released several versions on SCN. We keep improving the tool for years. Now the tool can not only visualize the troubleshooting information in kernel snapshot, but also be able to show the solution or action plan directly on its analysis report for many typical ABAP system-wide issues. We have around 36 dedicated analyzers in kernel snapshot analyzer, and each of them shows the solution or action of one symptom or shows an aspect of the system, e.g.
| No. | Dedicated Analyzer & Scenario | Comments & KBA |
| 1 | RFC Analyzer | System hang situation because most of the work processes are stuck on "On Hold - RFC" or program SAPMSSY1. KBA 3110604 - Analyze the RFC scenario with kernel snapshot analyzer |
| 2 | Parallelization Analyzer | The system is busy with many RFC requests (or the system is flooded) KBA 3110604 - Analyze the RFC scenario with kernel snapshot analyzer |
| 3 | Number Range Analyzer | The system is busy with number range actions. KBA 3110617 - Analyze the number range scenario with kernel snapshot analyzer |
| 4 | Enqueue Analyzer | The system is busy with enqueue actions. KBA 3110596 - Analyze the enqueue scenario with enqueue log analyzer and kernel snapshot analyzer |
| 5 | HTTP Client Analyzer | The system is busy with the program SAPLHTTP_RUNTIME (HTTP client) KBA 3118356 - Analyze the SAPLHTTP_RUNTIME scenario with kernel snapshot analyzer |
| 6 | Communication Blocks Analyzer | System hang situation because the communication blocks (rdisp/wp_ca_blk_no) are used up. KBA 3122296 - Analyze high CA block usage scenario with kernel snapshot analyzer |
| 7 | Semaphore Analyzer | System hang situation caused by semaphore deadlock. |
| 8 | Mutex Analyzer | System hang situation caused by mutex deadlock. For example, the following warnings are shown in the dev* traces.
|
| 9 | Database Analyzer | The system is busy with database actions |
| 10 | Extended Global (EG) Memory Analyzer | System hang situation because the extended global (EG) memory is used up. |
| 11 | Extended Memory (EM) Analyzer (PRIV Mode Analyzer) | System hang situation because the extended memory (EM) is used up, and many work processes are in PRIV mode. KBA 3141649 - Analyze the PRIV mode with kernel snapshot analyzer |
| 12 | Operating System I/O Analyzer | System hang situation caused by Operating System I/O performance issue. |
| 13 | Network Analyzer | System-wild performance issue caused by network issue in KBA 2197751 |
| ... | More analyzer |
Each dedicated analyzer supports several kinds of solutions or action plan items. So now kernel snapshot analyzer knows hundreds of solutions and action plan items, and it will check and show the matched solutions or action plan items directly on its analysis report. We also keep improving the tool, and the tool will support more and more typical ABAP system-wide issues in the future. This is the reason why we suggest trying kernel snapshot analyzer first whenever you need to analyze kernel snapshot. Most of the time, it should directly show the solution or action plan in its analysis report. If not, please feel free to send me feedback, and we will improve the tool.
Next, let's have a look at an example of how to use kernel snapshot and kernel snapshot analyzer to troubleshoot an ABAP system-wide issue.
An example of kernel snapshot and kernel snapshot analyzer
The example here is related to enqueue and background job processing. To reproduce the symptom, I first lock the whole background job table TBTCO via lock object ESTBTCO in SM12, so no one can get a lock of ESTBTCO to schedule any new job. Then I trigger many RFC calls via JCo from my PC to schedule new jobs via XBP API (just like some 3rd party job scheduler). Because all the lock requests to ESTBTCO will be blocked, all the external RFC sessions will not be able to schedule new jobs and they will pend on enqueue action like the following screenshot, and then the system will be slowed down because the dialog work processes are used up.

Next, let's trigger a kernel snapshot manually and analyze it via kernel snapshot analyzer following the steps in the following KBA 3122914. Then we will get the analysis report generated by the kernel snapshot analyzer. Let me show you some screenshots of the analysis report which will tell us what happened in the system.
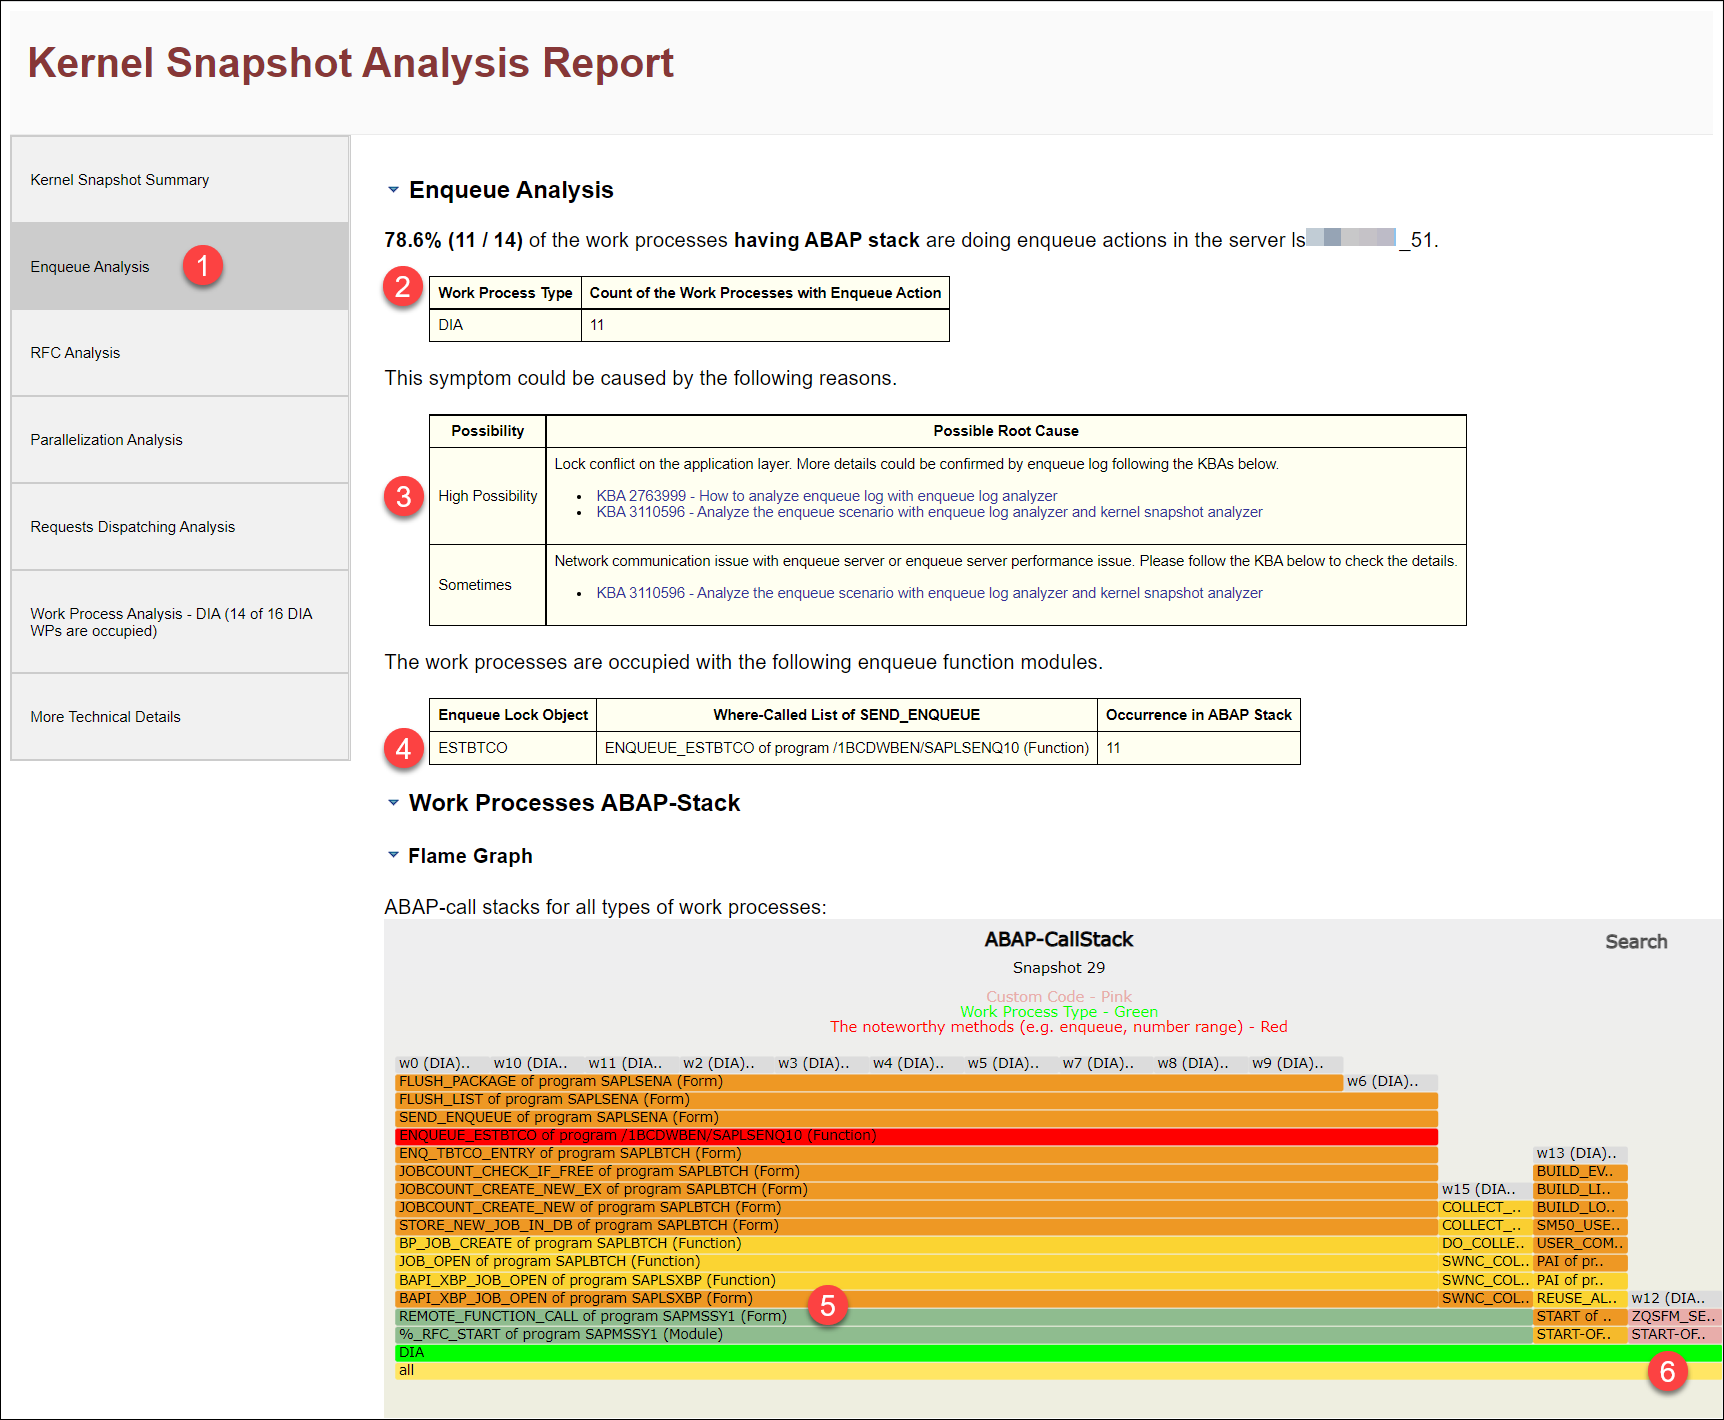
The first analysis report screenshot is about the enqueue analysis (=> ① in the screenshot below). It tells us:
- 78.6% (11 / 14) of the work processes are doing and busy with enqueue actions. (=> ② in the screenshot below)
- Most likely it is a lock conflict issue, and we should collect the enqueue log following KBA 2763999 and KBA 3110596 for the next step. (=> ③)
- Furthermore, the 11 running work processes are trying to get a lock of lock object ESTBTCO. It matches what we do in the reproducing steps. (=> ④)
- Furthermore, based on the ABAP stack flame graph, we could see that these work processes are running RFC requests because the RFC framework is highlighted in green. The involved RFC function module is BAPI_XBP_JOB_OPEN which is just the XBP API to schedule a background job. (=> ⑤)
- BTW, you may already find there are some pink frames at the bottom right corner of the frame graph. The pink color is for custom code, so we also know that work process 12 is running some custom code currently. The color is helpful for us to understand the program logic. (=> ⑥)
Next, you might want to get more insights from the RFC point of view because most of the work processes are busy with RFC sessions. So let's check the RFC analyzer (=> ① in the screenshot below). The RFC analyzer tells us that "it is the user TEST_USER who triggered so many RFC requests and flooded the system with RFC FM BAPI_XBP_JOB_OPEN (=> ② or ③)". So this user and this RFC function module should be checked.

Next, let me show you the parallelization analyzer (=> ① in the screenshot below) which shows us the insights for the system load from the parallelization point of view. For example, it tells us:
- The high load is triggered from host 10.NNN.NNN.NN4 via the RFC destination JCo_DEST and R/3 user TEST_USER. (=> ② or ③)
- It also emphasizes again that the load is to call RFC FM BAPI_XBP_JOB_OPEN. (=> ② or ③)
- With the "[System]" section on the RFC Chain flame graph, we could also know that the source of the RFC load is a java program. (=> ④)
- BTW, KBA 3110604 has more tips about how to use and read the parallelization analyzer.

Furthermore, I also followed the suggestion in the kernel snapshot analyzer analysis report to collect the enqueue log and analyzed the enqueue log with enqueue log analyzer (KBA 2763999, which is another troubleshooting tool developed by our team). Then I got the following enqueue log analyzer analysis report showing us the final root cause of this issue like the following screenshot. This time, it tells us:
- Indeed, the lock conflict issue happened. The enqueue reject rate is 99.98%. (=> ① or ② in the screenshot below)
- Almost all the conflicting locks are held by one transaction from user TEST_USER (lock holder). (=> ③)
- Furthermore, this transaction held the lock for >303s to lock object ESTBTCO with argument "@@@@@@@@@@@@@@@@@@@@@@@@ @@@@@@@". (=> ④)
- This is the root cause of this issue and we need to check why this transaction does not release the lock in time.
- This also matches the reproducing steps. As mentioned before, I held all the locks of ESTBTCO (job table TBTCO) in SM12 on purpose for a long time to block all the RFC sessions to schedule new jobs.

BTW, here are the steps I held all the locks of ESTBTCO (job table TBTCO) in SM12. If you like, you could also flood your test system in a similar way and then check your scenario similarly.
- SM12 => enter 'text' in the OK code => Error Handling => Test Tools => Single Calls
- Lock table TBTCO with 40 wildcard character '@' like the following screenshot
- BTW, the number 40 is the length of the lock object ESTBTCO which could be confirmed in SE11.

The Summary
Now I think we all have a good feeling about
- how easy it is to analyze ABAP system-wide issues with kernel snapshot analyzer and kernel snapshot
- how the kernel snapshot analyzer analysis report will show us what happened to the system.
- how the kernel snapshot analyzer will show us the solution or action plan directly on the analysis report in a clear and straightforward way.
It already greatly simplified our daily work to support the critical ABAP system-wide incidents reported by our customers all over the world. As it is documented in KBA 3110588, the tool not only shows us the conclusion from BASIS, application, or SAP areas, but also supports more areas like database, network, or Operating System I/O if the ABAP system is affected by them.
As mentioned before, the system will also automatically create kernel snapshots when the system thinks something wrong happened. So if you log into any ABAP system, most likely you will find some existing kernel snapshots. Do you want to try kernel snapshot analyzer now? I suggest just trying kernel snapshot analyzer with the existing kernel snapshots in your ABAP system with the following steps.
- Download kernel snapshot analyzer from this SCN link. The latest version is 1.0.0.20230111 which can be verified via the command "java -jar KernelSnapshotAnalyzer.jar -v"
- Go to "SM50 -> Menu Administration ->Snapshot -> Administration" and download an existing kernel snapshot file.
- Then start the analysis and enjoy the kernel snapshot analyzer analysis report.
- The detailed step-by-step guide with screenshots is documented in KBA 3122914.
We hope kernel snapshot analyzer and kernel snapshot will simplify your analysis and troubleshooting if you are involved in some ABAP system-wide issues. We also hope kernel snapshot analyzer and kernel snapshot will be your first plan for ABAP system-wide issues in the future.
At last, please feel free to share your feedback by sending an email to me “qiansheng.wang AT sap.com” or adding a comment to this blog post. Your feedback is highly appreciated.
Thank you very much.
- SAP Managed Tags:
- SAP NetWeaver Application Server for ABAP
Labels:
1 Comment
You must be a registered user to add a comment. If you've already registered, sign in. Otherwise, register and sign in.
Labels in this area
-
ABAP CDS Views - CDC (Change Data Capture)
2 -
AI
1 -
Analyze Workload Data
1 -
BTP
1 -
Business and IT Integration
2 -
Business application stu
1 -
Business Technology Platform
1 -
Business Trends
1,658 -
Business Trends
93 -
CAP
1 -
cf
1 -
Cloud Foundry
1 -
Confluent
1 -
Customer COE Basics and Fundamentals
1 -
Customer COE Latest and Greatest
3 -
Customer Data Browser app
1 -
Data Analysis Tool
1 -
data migration
1 -
data transfer
1 -
Datasphere
2 -
Event Information
1,400 -
Event Information
66 -
Expert
1 -
Expert Insights
177 -
Expert Insights
299 -
General
1 -
Google cloud
1 -
Google Next'24
1 -
Kafka
1 -
Life at SAP
780 -
Life at SAP
13 -
Migrate your Data App
1 -
MTA
1 -
Network Performance Analysis
1 -
NodeJS
1 -
PDF
1 -
POC
1 -
Product Updates
4,577 -
Product Updates
344 -
Replication Flow
1 -
RisewithSAP
1 -
SAP BTP
1 -
SAP BTP Cloud Foundry
1 -
SAP Cloud ALM
1 -
SAP Cloud Application Programming Model
1 -
SAP Datasphere
2 -
SAP S4HANA Cloud
1 -
SAP S4HANA Migration Cockpit
1 -
Technology Updates
6,873 -
Technology Updates
423 -
Workload Fluctuations
1
Related Content
- Deliver Real-World Results with SAP Business AI: Q4 2023 & Q1 2024 Release Highlights in Technology Blogs by SAP
- sap system issue analysis by kernel snapshot analyzer tool in Technology Blogs by Members
- How to easily perform live ad-hoc analysis on SAP BW Queries in SAP Analytics Cloud in Technology Blogs by SAP
- How does BO Broadcasting work in SAP BW/BI? in Technology Blogs by Members
- KPI-Dashboard with SAC and Datasphere in Technology Blogs by SAP
Top kudoed authors
| User | Count |
|---|---|
| 40 | |
| 25 | |
| 17 | |
| 14 | |
| 8 | |
| 7 | |
| 7 | |
| 7 | |
| 6 | |
| 6 |