Overview:
In this blog, I will try to explain one of the use-cases in Sap Analytics Cloud.
'How to create a restricted measure on a measure input control'.
First, let us try to understand the business scenario to be achieved.
Business Scenario:
The user has a requirement to create a trend chart to show current year sales data.
The chart should show Sales count trend and Sales Amount trend for the current year based on the selection of a measure input control
You can go through
SAP Analytic Cloud: Measure and Dimension Input Control to understand more about input controls in SAP Analytics Cloud
Solution:
To achieve the above mentioned business scenario we require the combination of two features in sap analytics cloud: Restricted measures and Cross calculation. The restricted measure would be used to restrict the Sales count and Sales Amount to current year data and the cross calculation would allow us to apply the restriction to both the measure (Sales count and Sales Amount).
Create a story, add a chart and follow the below steps to achieve the same
- Make the inserted chart a line trend chart

- Create a measure input control with the measures required for the dynamic selection
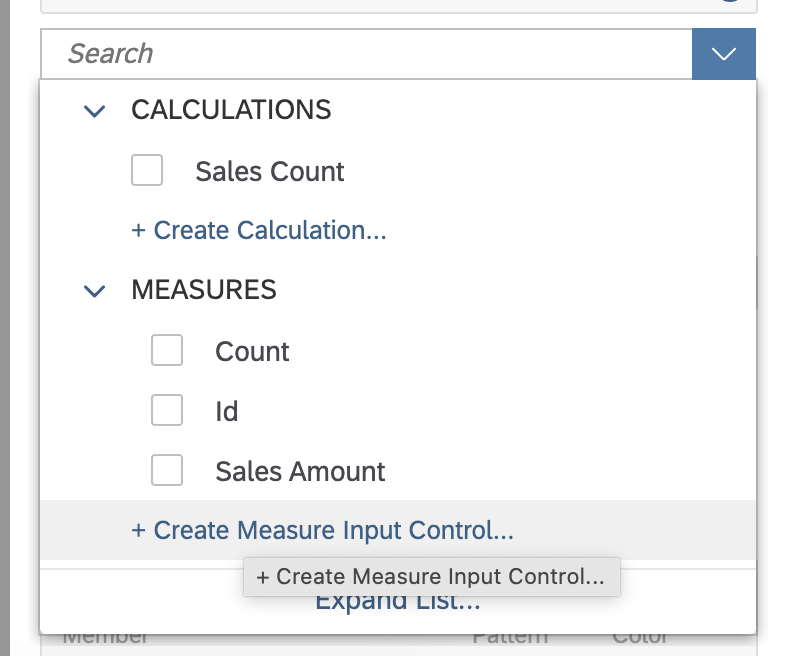

Rename the Measure input control created to 'Display As'.
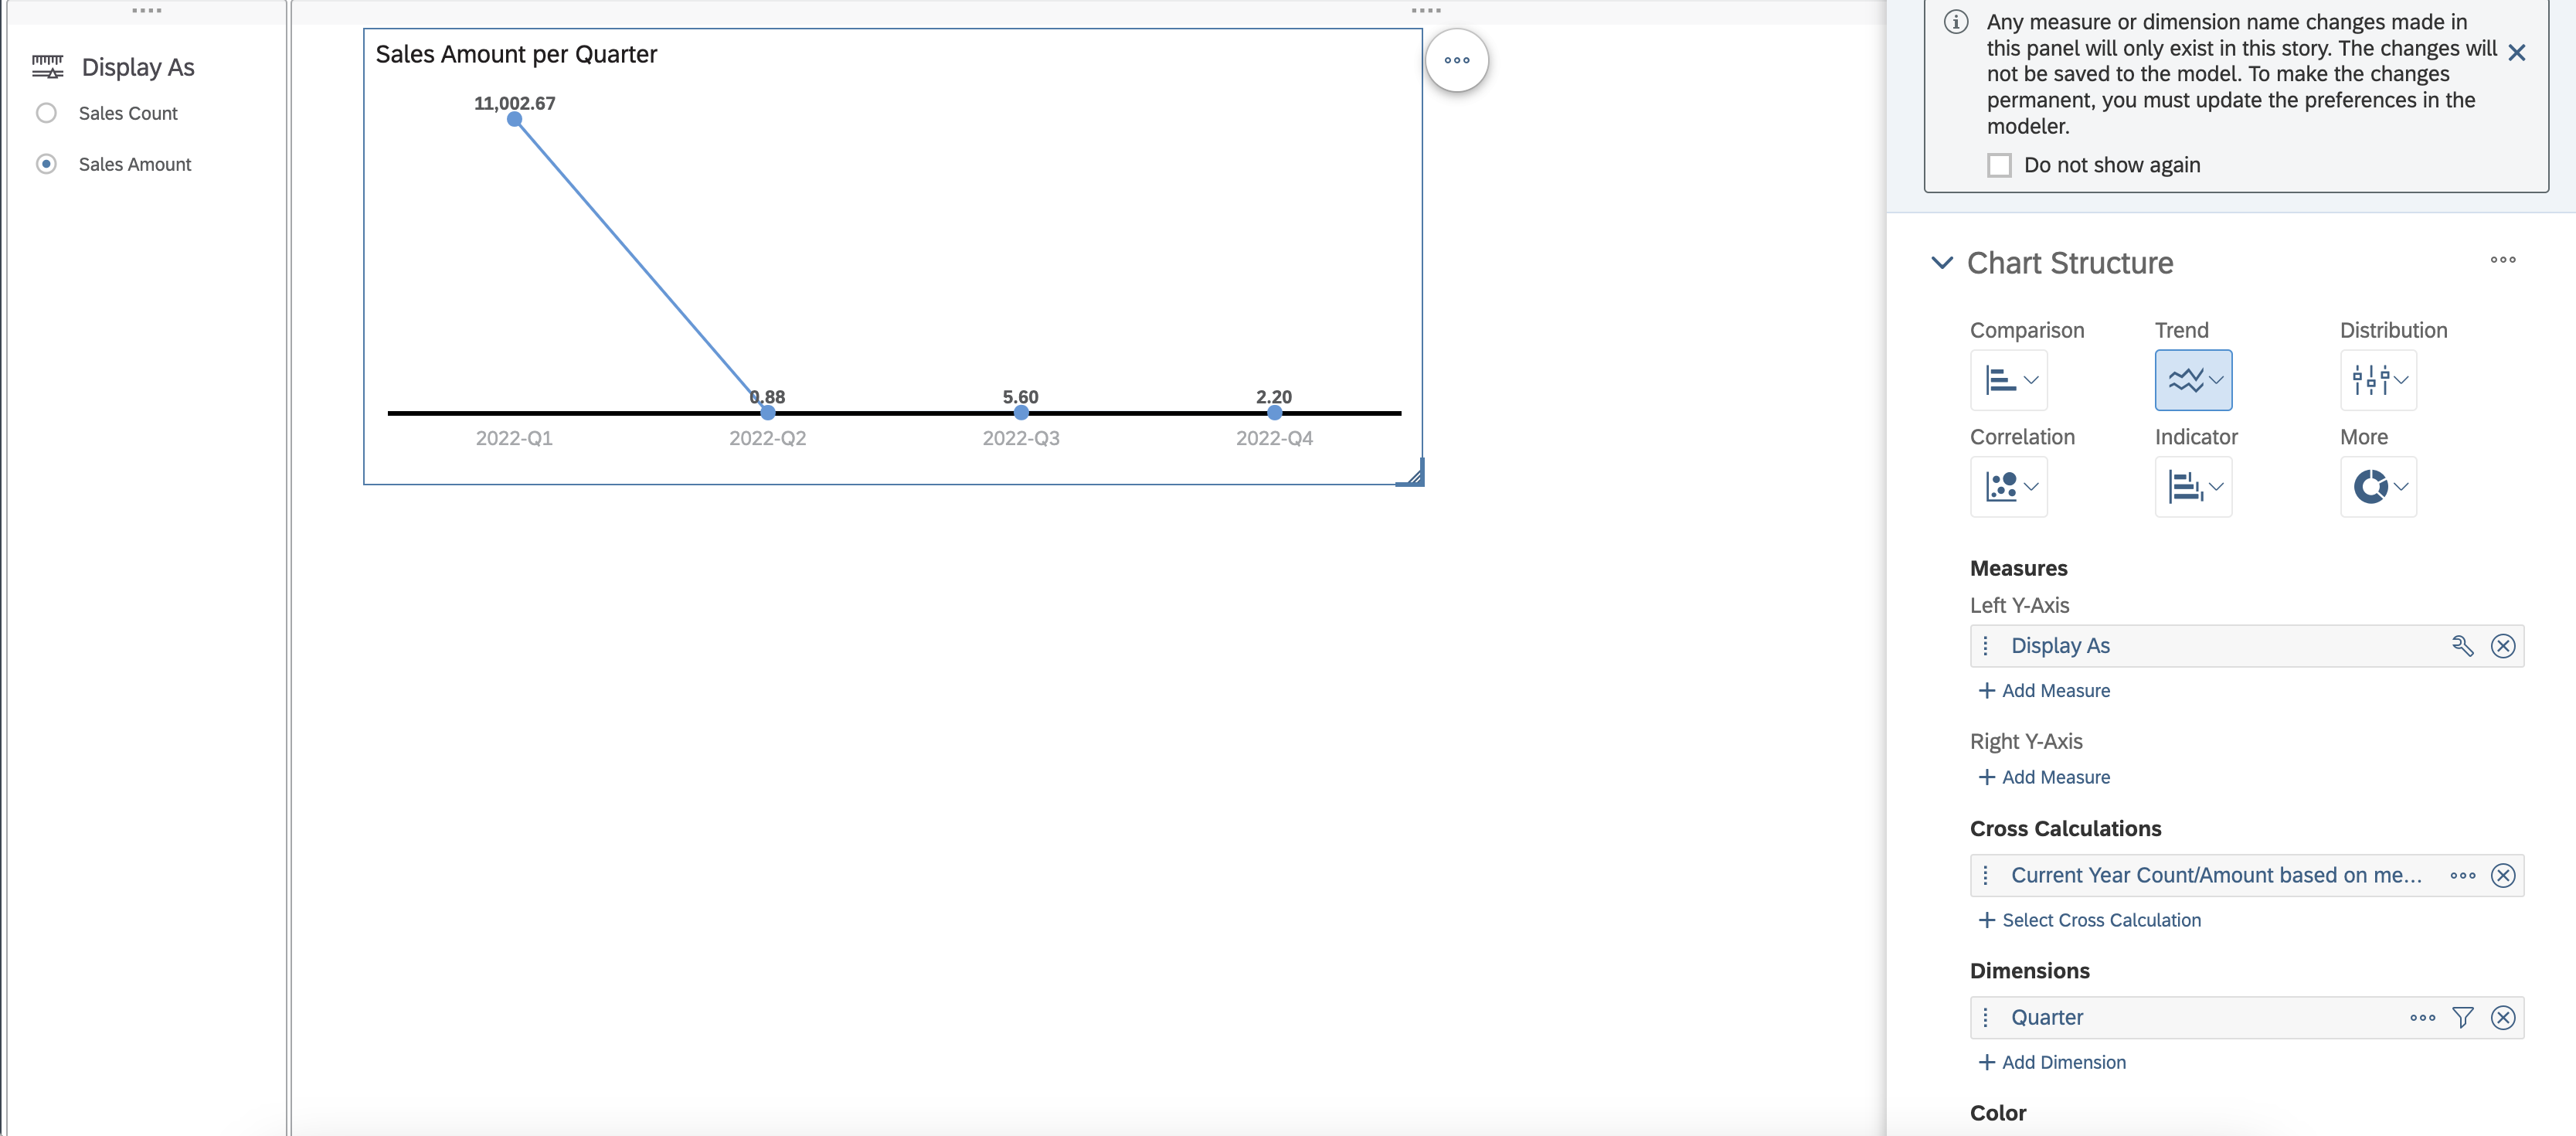
- Add the input control created to the measure field of the trend chart
- Add a cross calculation to the chart

Create a Cross Calculation restricted measure to restrict the data to current year sales.
In the selection context , select 'Measure Values' under Measure.

The selection of measure values will enable the restricted measure to be controlled by the measure input control added in the chart and thereby achieving our requirement
- Further, add the dimension by which the data needs to be displayed(eg: quarter, month)
In the below screenshots you can see that the heading and the values on the trend chart changes based on the selection in the input control.

To summarise, the above blog post will help to understand how to restrict the measures in an input control using cross calculation. This solution can be applied on other charts as well depending on the requirement.
I hope this blog will be useful for those who come across a similar scenario.
Thank you for taking time to go through the blog. Hope its been helpful. Please leave your valuable comments/likes/ratings below.
