
- SAP Community
- Products and Technology
- Technology
- Technology Blogs by SAP
- E-Commerce Analytics with SAC & DWC
Technology Blogs by SAP
Learn how to extend and personalize SAP applications. Follow the SAP technology blog for insights into SAP BTP, ABAP, SAP Analytics Cloud, SAP HANA, and more.
Turn on suggestions
Auto-suggest helps you quickly narrow down your search results by suggesting possible matches as you type.
Showing results for
former_member20
Active Contributor
Options
- Subscribe to RSS Feed
- Mark as New
- Mark as Read
- Bookmark
- Subscribe
- Printer Friendly Page
- Report Inappropriate Content
09-29-2022
5:58 AM
E-Commerce is synonymous with Shopping and this contributes to a significant amount of revenue for Manufacturers/traders globally. Accelerated by the pandemic, the Indian e-commerce industry is set to grow by 84% to $111 billion by 2024. Similarly, Southeast Asia is on its way to record an annual growth rate of 22%, reaching $146 billion by 2025[1]. So online selling is not optional anymore and we see more and more sellers are onboarded on to various platforms every day.
From a shopper point of view, online shopping is easy and convenient. They simply log on to their favorite platform, purchase product and await delivery. Behind the scenes, the marketplace, payment gateways, Seller/Supplier and Logistics teams work together seamlessly to deliver the right product the right time.
The seller experience is different for every seller across the marketplaces. For example, the commissions charged, Shipping charges, return policy, refund policy, advertisement costs, etc., varies drastically between the marketplaces. For brands that are sold across these multiple channels it is crucial to understand the KPIs across these platforms to stay on top of the game.
Now for a seller or a supplier, few challenges include:
High Level Steps Involved to get insights on the above discussed points:
For this Blog:
Every platform provides one or more ways to extract this information. For example, Amazon, Flipkart provides APIs to extract the data as well as excel/csv downloads. There are also paid third party integrators available to manage inventory and orders.
There are hundreds of ecommerce platforms and for the sake of this blog we consider Amazon & Flipkart which are leading the market in India. Note that all data here is “Cooked-up” and was prepared to explain how integrated data analytics would help and work.
Staging: Also, note that in some cases data could be directly integrated in the dataflows, but as a best practice it is always better to stage the raw data and then perform other tasks separately so as to isolate the flows and avoid reworking on a huge flow.
Also, check SAP Datawarehouse Cloud Data marketplace. In case if you have existing integrations, this can be monetized by registering as a data provider. This feature was yet to be GA at the time of writing this blog. For more detalis check the blog [2]
EXTRACTING and Loading Options:
(MANUAL) EXCEL/CSV/TSV EXPORT AND IMPORT INTO DWC:
Where to find the data from Amazon Seller Central:
Where to find the data from Flipkart Seller Central:
SAP CLOUD PLATFORM OPEN CONNECTORS:
SAP Cloud Platform Open Connectors: https://help.openconnectors.ext.hana.ondemand.com/home/amazonmarketplace
Data from the connector could also be stored in your favorite database and then could be accessed/scheduled from SAP Datawarehouse cloud.
API TO DWC USING MICROSOFT FLOW + ONE DRIVE COMBINATION
Access needs to be requested and the steps are outlined in the below guides. Note that in case if you are you are planning to use any third-party integration services, the steps would be bit different.
AMAZON: amazon selling partner github for more information in the APIs
NORMALIZE THE DATA TO CREATE A COMMON SEMANTIC LAYER:
Normalization would help us understand/compare and analyze the consolidated data. Normalization would differ based on the Market places involved, products sold and so on. For example, below would be a high-level normalized data for someone selling apparels on multiple channels.
Similarly, for returns, refunds and finance reconciliation harmonized data template would greatly help.
DEFINING KPIS AND CREATING VISUALIZATIONS IN SAP ANALYTICS CLOUD:
Every Supplier will have different metrics to track. Below are the few metrics that are generic.
With SAC, you could easily build charts to help you analyze the following.
Sample Screenshots:
WHAT IF ANALYSIS?
Furthermore, with SAC you could build stories/apps that would help you to do what-if analysis. For example, with built in predictive features one should easily be able to do the following what-if analysis:
OTHER VALUE ADS using SAC:
Incase if you have similar requirement you could get in touch with your SAP CSP to take your idea further and use SAC to fulfill your analytic needs for your ecommerce business.
[1] https://www.business-standard.com/article/technology/india-s-e-commerce-industry-set-to-grow-84-by-2...
[2] https://blogs.sap.com/2021/12/13/sap-data-warehouse-cloud-data-marketplace-an-overview/
From a shopper point of view, online shopping is easy and convenient. They simply log on to their favorite platform, purchase product and await delivery. Behind the scenes, the marketplace, payment gateways, Seller/Supplier and Logistics teams work together seamlessly to deliver the right product the right time.
The seller experience is different for every seller across the marketplaces. For example, the commissions charged, Shipping charges, return policy, refund policy, advertisement costs, etc., varies drastically between the marketplaces. For brands that are sold across these multiple channels it is crucial to understand the KPIs across these platforms to stay on top of the game.
Now for a seller or a supplier, few challenges include:
- Multiple Channels (aka Market places) order tracking
- Market places includes platforms like Amazon, Flipkart, Meesho as well as the seller or the Brands own website built on Frameworks like Hybris, Shopify, Magento, Woo-Commerce, and so on.
- Analysis of product Returns across Channels
- Payments and reconciliations
- In-Platform, Out-of-platform advertisement spend vs revenue generation
- In-Platform: Every Market place provides an option to showcase their store or their products when the customer searches based on relevant terms. There is a cost associated with advertising and it varies based on the product, brand, frequency, etc.,
- Out-of-Platform: This can be related to social marketing cost. For example, the advertisement spend on ads delivered through YouTube, Google search, Television Channels, OTT, Facebook, Instagram, etc.,
- Inventory analysis across fulfilment centers, owned/leased warehouses.

High Level Steps Involved to get insights on the above discussed points:
- Extract Data from Each Market places - Staging
- Normalize the data to create a common Semantic Layer
- Define KPIS, Targets
- Create Stories/Reports that would help to take actions.

For this Blog:
Every platform provides one or more ways to extract this information. For example, Amazon, Flipkart provides APIs to extract the data as well as excel/csv downloads. There are also paid third party integrators available to manage inventory and orders.
There are hundreds of ecommerce platforms and for the sake of this blog we consider Amazon & Flipkart which are leading the market in India. Note that all data here is “Cooked-up” and was prepared to explain how integrated data analytics would help and work.
Staging: Also, note that in some cases data could be directly integrated in the dataflows, but as a best practice it is always better to stage the raw data and then perform other tasks separately so as to isolate the flows and avoid reworking on a huge flow.
- Considered Platforms:
- Amazon – Excel & APIs,
- Flipkart – Excel & API
- DWC to consolidate data and SAC for Visualizations
Also, check SAP Datawarehouse Cloud Data marketplace. In case if you have existing integrations, this can be monetized by registering as a data provider. This feature was yet to be GA at the time of writing this blog. For more detalis check the blog [2]
EXTRACTING and Loading Options:
- (Manual) Excel/CSV/TSV Export and Import into DWC
- (Automated & Schedulable) Amazon to DWC using SAP Cloud Platform Open Connectors
- (Automated & Schedulable) Amazon API to DWC using Microsoft Flow + One Drive combination
- SAP Datawarehouse Cloud Data marketplace Connectors for supported platforms
(MANUAL) EXCEL/CSV/TSV EXPORT AND IMPORT INTO DWC:
- Good for POC and trials
- Not recommended for production usage

Where to find the data from Amazon Seller Central:
- ORDERS: Orders->Order Reports (Choose your Date Range or Schedule)
- RETURNS: Orders->Manage Returns->Return Reports
- PAYMENTS: Payments->All Statements->Download Flat File V2 for the selected period
- AD SPEND: Campaign Manager->Report: Sponsored Products Search Term Report
- INVENTORY: Inventory->Inventory Reports->All Listings Report
Where to find the data from Flipkart Seller Central:
- ORDERS: Report Center-> Fulfilment Reports->Orders
- RETURNS: Report Center -> Fulfilment Reports->Returns, Growth-> Returns-> Listing Level Returns Report
- PAYMENTS: Report Center -> Settled Transactions
- AD SPEND: Advertising-> Placement Performance Report
- INVENTORY: Listing ->Request Download->Active Listings
SAP CLOUD PLATFORM OPEN CONNECTORS:
SAP Cloud Platform Open Connectors: https://help.openconnectors.ext.hana.ondemand.com/home/amazonmarketplace
Data from the connector could also be stored in your favorite database and then could be accessed/scheduled from SAP Datawarehouse cloud.

API TO DWC USING MICROSOFT FLOW + ONE DRIVE COMBINATION
Access needs to be requested and the steps are outlined in the below guides. Note that in case if you are you are planning to use any third-party integration services, the steps would be bit different.
AMAZON: amazon selling partner github for more information in the APIs

NORMALIZE THE DATA TO CREATE A COMMON SEMANTIC LAYER:
Normalization would help us understand/compare and analyze the consolidated data. Normalization would differ based on the Market places involved, products sold and so on. For example, below would be a high-level normalized data for someone selling apparels on multiple channels.
Similarly, for returns, refunds and finance reconciliation harmonized data template would greatly help.

DEFINING KPIS AND CREATING VISUALIZATIONS IN SAP ANALYTICS CLOUD:
Every Supplier will have different metrics to track. Below are the few metrics that are generic.
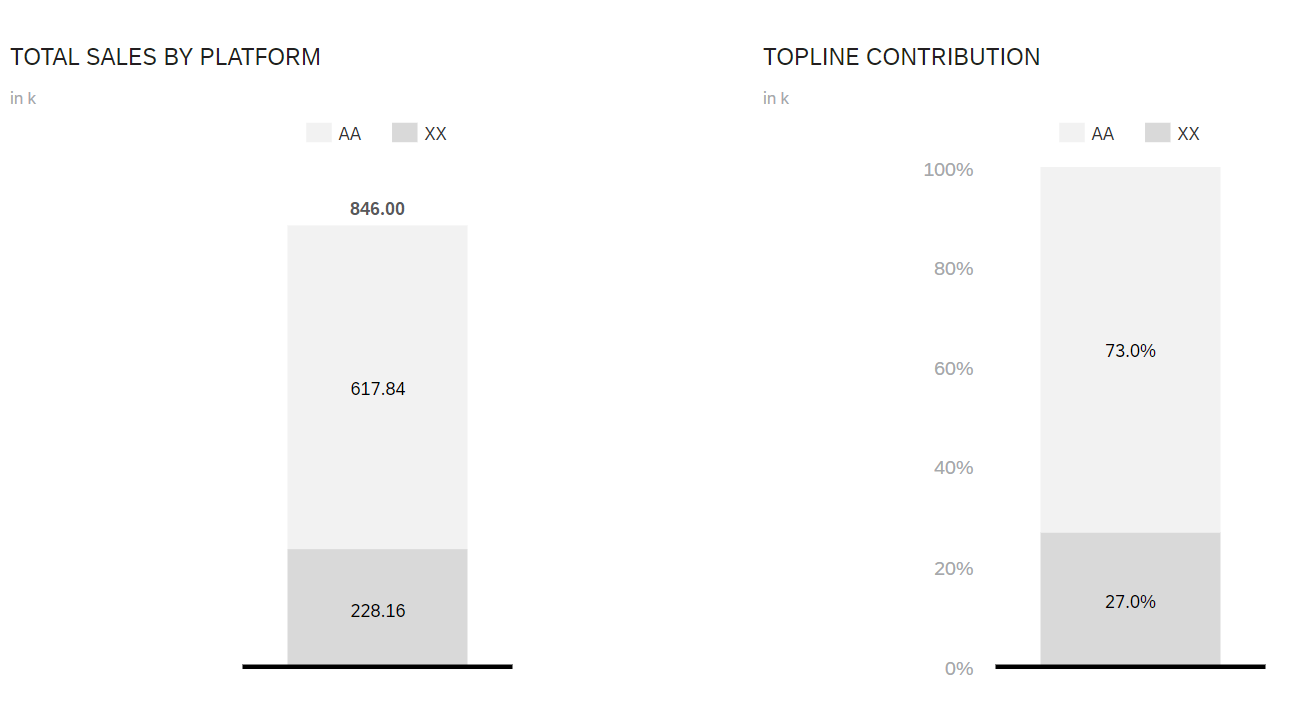
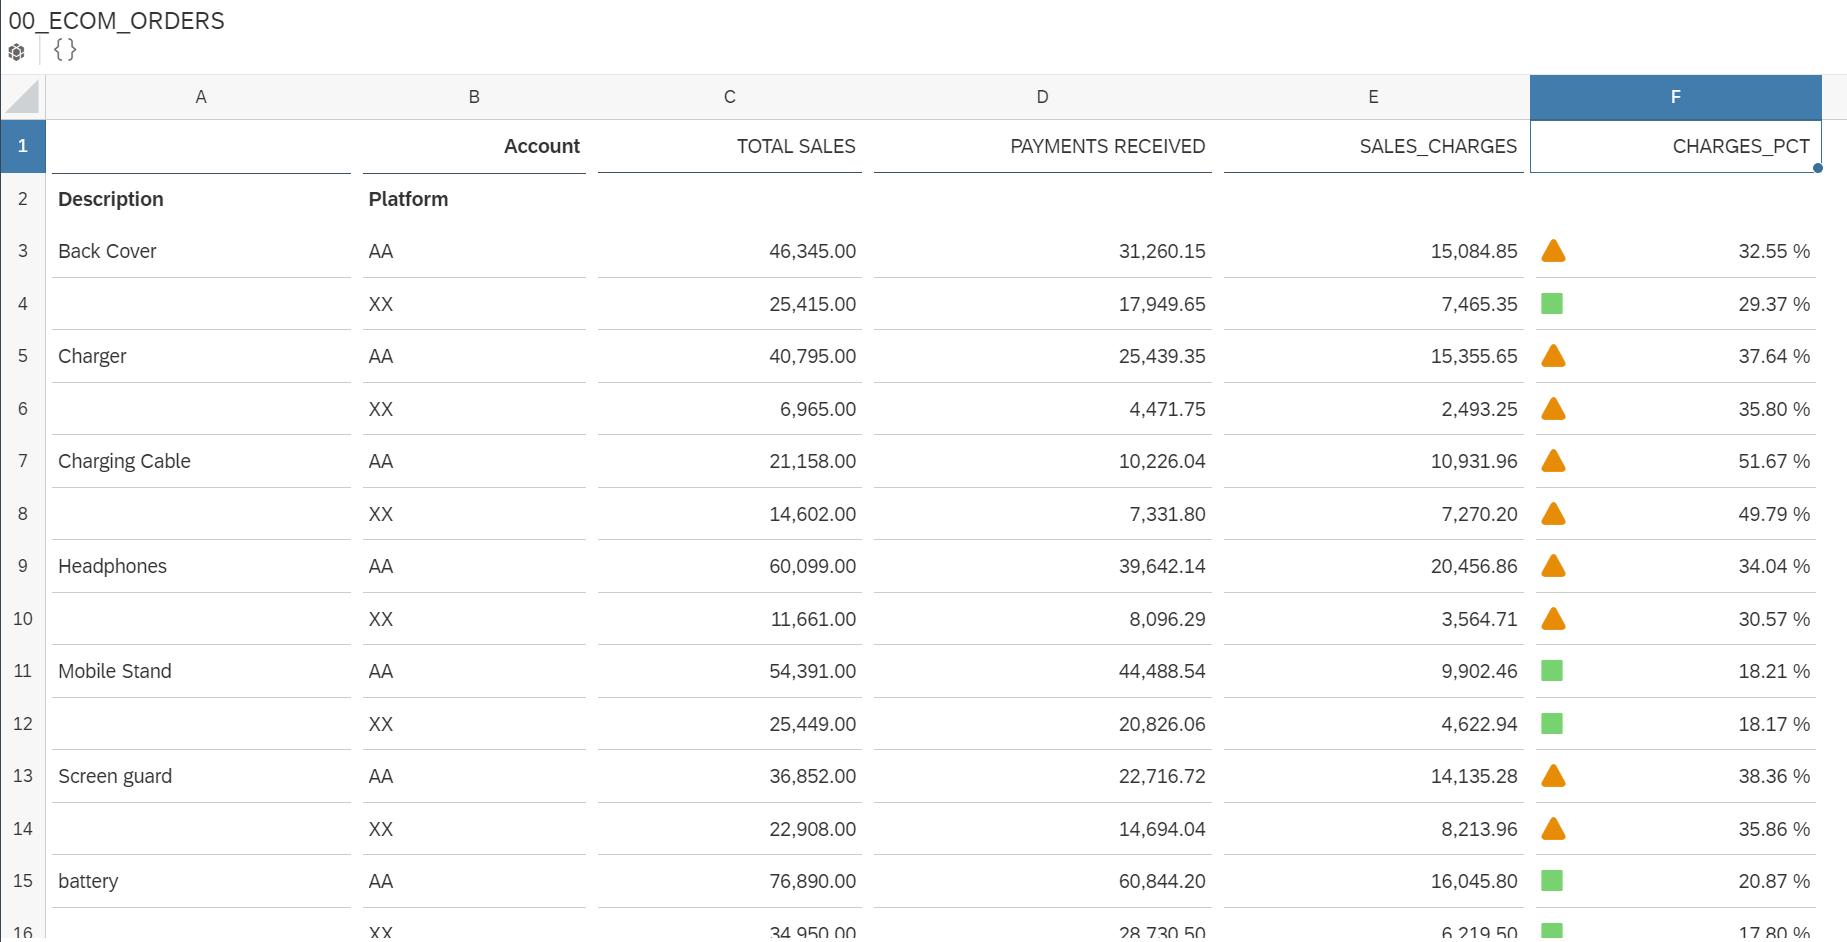
With SAC, you could easily build charts to help you analyze the following.
- Topline and bottom line contribution by platform
- Net Profit Analysis - Selling price minus (cost price + Platform Charges + Fixed fees + Shipping + Taxes + other charges)
- Ads ROI
- Returns Analysis
- Which products are being returned most?
- Which platform has more returns?
- Which type of payment method leads to more returns?
- Which product by the buyer region has high return ratio?
- Inventory Analysis and Planning
- Forecast the demand for a particular product by platform
Sample Screenshots:


WHAT IF ANALYSIS?
Furthermore, with SAC you could build stories/apps that would help you to do what-if analysis. For example, with built in predictive features one should easily be able to do the following what-if analysis:
- Product cost Changes
- Packing Material Price Change
- Labor Cost Changes
- Logistics/Transportation Cost Changes
- Storage Cost Changes
- GST Changes
- Market place charges changes
OTHER VALUE ADS using SAC:
- Geo Spatial Analysis
- Product demand Planning
- Ad spend optimization
- Report Bursting and Scheduling
- Commenting & Collaboration
Incase if you have similar requirement you could get in touch with your SAP CSP to take your idea further and use SAC to fulfill your analytic needs for your ecommerce business.
[1] https://www.business-standard.com/article/technology/india-s-e-commerce-industry-set-to-grow-84-by-2...
[2] https://blogs.sap.com/2021/12/13/sap-data-warehouse-cloud-data-marketplace-an-overview/
- SAP Managed Tags:
- SAP Analytics Cloud
Labels:
You must be a registered user to add a comment. If you've already registered, sign in. Otherwise, register and sign in.
Labels in this area
-
ABAP CDS Views - CDC (Change Data Capture)
2 -
AI
1 -
Analyze Workload Data
1 -
BTP
1 -
Business and IT Integration
2 -
Business application stu
1 -
Business Technology Platform
1 -
Business Trends
1,658 -
Business Trends
93 -
CAP
1 -
cf
1 -
Cloud Foundry
1 -
Confluent
1 -
Customer COE Basics and Fundamentals
1 -
Customer COE Latest and Greatest
3 -
Customer Data Browser app
1 -
Data Analysis Tool
1 -
data migration
1 -
data transfer
1 -
Datasphere
2 -
Event Information
1,400 -
Event Information
66 -
Expert
1 -
Expert Insights
177 -
Expert Insights
299 -
General
1 -
Google cloud
1 -
Google Next'24
1 -
Kafka
1 -
Life at SAP
780 -
Life at SAP
13 -
Migrate your Data App
1 -
MTA
1 -
Network Performance Analysis
1 -
NodeJS
1 -
PDF
1 -
POC
1 -
Product Updates
4,577 -
Product Updates
345 -
Replication Flow
1 -
RisewithSAP
1 -
SAP BTP
1 -
SAP BTP Cloud Foundry
1 -
SAP Cloud ALM
1 -
SAP Cloud Application Programming Model
1 -
SAP Datasphere
2 -
SAP S4HANA Cloud
1 -
SAP S4HANA Migration Cockpit
1 -
Technology Updates
6,873 -
Technology Updates
427 -
Workload Fluctuations
1
Related Content
- Expanding Our Horizons: SAP's Build-Out and Datacenter Strategy for SAP Business Technology Platform in Technology Blogs by SAP
- SAP Queries/Infoset Queries data import to SAC (SAP ECC not on HANA) in Technology Q&A
- SAP Analytics Cloud for planning - Set Advanced Filters on Date and Version in Technology Q&A
- SAC: Find drill level in hierarchy based on string in Technology Q&A
- 入門!SAP Analytics Cloud for planning 機能紹介シリーズ - データアクションとマルチアクション in Technology Blogs by SAP
Top kudoed authors
| User | Count |
|---|---|
| 40 | |
| 25 | |
| 17 | |
| 14 | |
| 8 | |
| 7 | |
| 7 | |
| 7 | |
| 6 | |
| 6 |