


- SAP Community
- Products and Technology
- Supply Chain Management
- SCM Blogs by SAP
- Advanced Scheduling Board - F5460
Supply Chain Management Blogs by SAP
Expand your SAP SCM knowledge and stay informed about supply chain management technology and solutions with blog posts by SAP. Follow and stay connected.
Turn on suggestions
Auto-suggest helps you quickly narrow down your search results by suggesting possible matches as you type.
Showing results for
former_member70
Explorer
Options
- Subscribe to RSS Feed
- Mark as New
- Mark as Read
- Bookmark
- Subscribe
- Printer Friendly Page
- Report Inappropriate Content
09-14-2022
1:51 PM
Introduction & Motivation
Advanced Scheduling Board Fiori App is primarily used by Production Planners for scheduling various planning objects like planned orders, production orders on resources/work centres considering finite/infinite capacities & dependencies with other connected planning objects like purchase requisitions, purchase orders, stock transfer requisitions, stock transfer orders etc. and different calendars like off-shift times, down-times and fixed intervals. ‘Advanced Scheduling Board’ Fiori App is developed as a replacement (in long run) for existing Fiori App ‘Production Scheduling Board’ and is developed using SAP Ui5 GANTT2.0 control with RAP (Restful ABAP Programming).
Features & Capabilities
Following are some of the features & capabilities of the application which will be supported with the SAP S/4HANA 2022 On-Premise release -
- Consider Planner’s scope for planning with ‘Area of Responsibility’
- Multiple Gantt & time-continuous charts to visualize the data which can be loaded with a variety of filters
- Multiple Toolbar and Context menu options on the planning objects and on rows (in the table side of the charts)
- Variants covering filter criteria, charts selected, zoom level, settings (in main tool bar), table personalization, DS Strategy parameter values
- Cross App Navigation (for few transactions) to other visually harmonized Fiori Application with Simulation Session sharing
- Alerts with filtering based on Alert Profile
- Interactive edit features drag & drop, creation/change/delete orders and saving to new/existing simulation version and/or adopting to the active planning version
- Find / Search Capabilities using Order Number or Product
- Table Personalization like columns, sequence of columns
- Performance Optimised using lazy loading feature during end-user scrolling (Vertical) for all charts. This means that depending on the size and zoom levels of the screen, only a limited number of objects out of the total number objects are loaded during initial load. When the user scrolls, the next set of objects are loaded and so on.
Gantt Charts
The following charts are available in the Advanced Scheduling Board application -
- Gantt
- Resource Chart
- Product Chart
- Order Chart
- Operation Chart
- Time Continuous
- Product Stock Visualization Chart
- Resource Utilization Chart
At least 1 chart must be selected for the application to load and a maximum of 4 charts can be loaded into the application at a time.
Once the charts are loaded, the user can minimize the filter bar and go to full screen mode of the browser to have a better view of ‘Advanced Scheduling board’
Any of the charts can be maximized or restored to earlier position. Some of the table columns are sticky and cannot be hidden by the user.
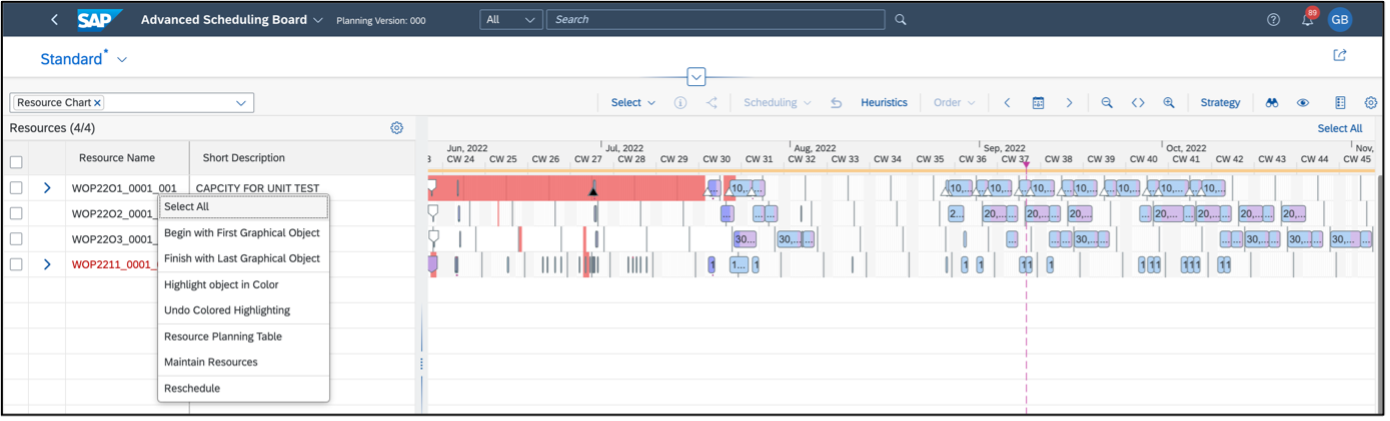
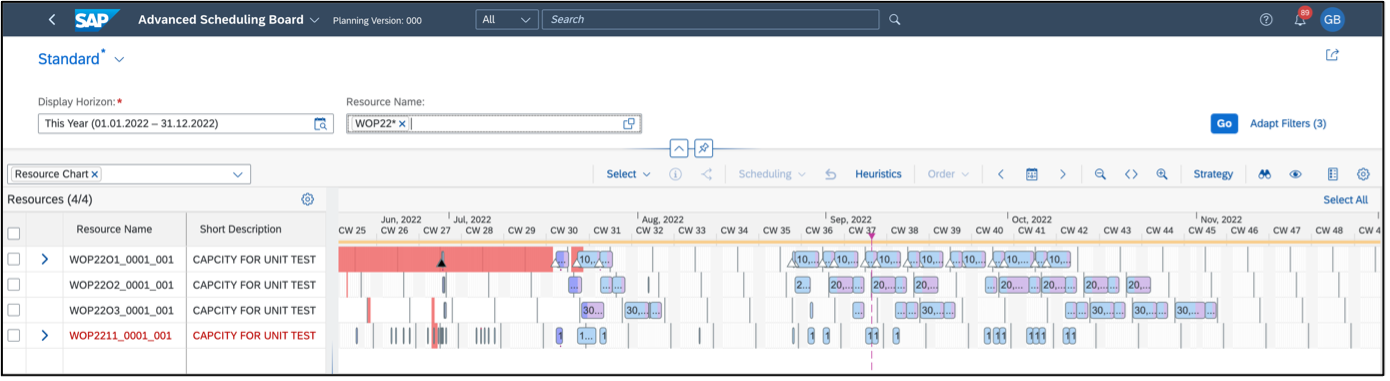
Resource Chart
Resources are one of the leading objects in the filters passed from the UI and are used to build the entities used in the Resource Chart.
Resource Chart
Some of the features of the Resource Chart are as follows -
- Each Resource represents a row with red text representing bottleneck resource, in which data are rendered as shapes and calendars
- Operations with Activities are displayed as different shapes based on the Order types.
- Resource Chart displays Non-working Time, Downtime, Fixed Intervals for a resource as calendars
- Resource Chart is a multi-activity chart with an expand/collapse icon at the start of the row, which shows the overlaps that occur for the operations in a resource.
- Linear gradients have been implemented to render the different colours for different activities such as Setup, Process & Teardown for the operations within same shape
- Multiple indicators like Fixed, Deallocated, Partially confirmed Production orders, Sequence dependent setup, Deactivated Sequence dependent setup etc. have additional shapes and can be checked in Legends
- Multiple context menu options available on table side
- Multiple context menu options available on Gantt side for shapes
Product Chart
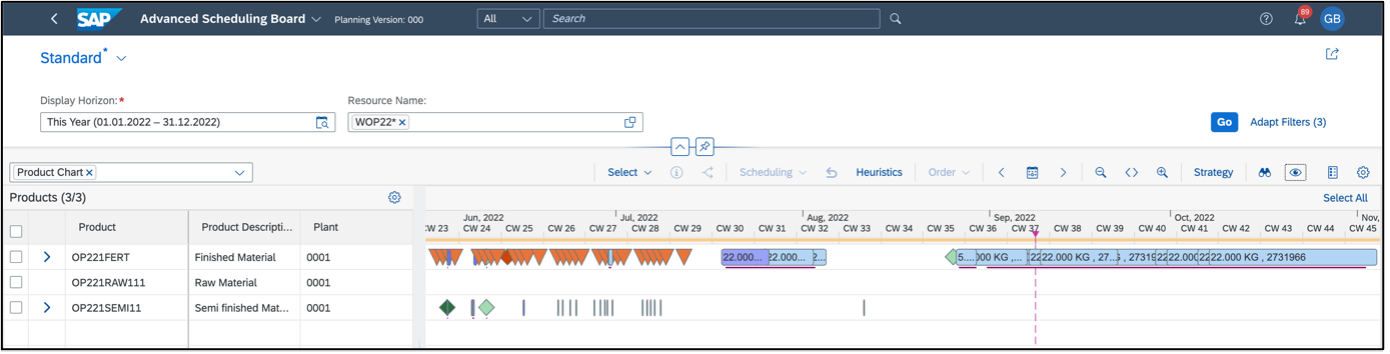
Product Chart
Some of the features of the Product Chart are as follows -
- Each Product represents a row in which data is rendered as shapes
- Product Chart shows the overlaps that occur for the orders for a product with an expand/collapse icon at the start of the row
- The Orders for each of the products are are displayed in different shapes based on the Order types. This can be checked in Legends
- Multiple context menu options available on table side
- Multiple context menu options available on Gantt side for shapes
Order Chart

Order Chart
Some of the features of the Order Chart are as follows -
- Each Order represents a row in which data are rendered as shapes. Order chart has only one shape plotted per row as it is a one-to-one mapping with the order number on the table row. Text is also displayed outside the shape in this chart
- The Order Chart displays orders that are planned for the loaded resources in the Resource Chart or the orders that are selected by the user on the filter bar.
- Multiple context menu options available on table side
- Multiple context menu options available on Gantt side for shapes
Operation Chart

Operation Chart
Some of the features of the Operation Chart are as follows -
- Each Operation represents a row in which data are rendered as shapes. Operation chart has only one shape plotted per row as it is a one-to-one mapping with the order and operation number on the table row. Text is also displayed outside the shape in this chart
- Linear gradients have been implemented to render the different colours for different activities such as Setup, Process & Teardown for the operations
- Multiple context menu options available on table side
- Multiple context menu options available on Gantt side for shapes
Product Stock Visualization Chart
Product Stock Visualization Chart is a time continuous chart which maps the Stock/Quantity of products (Y axis) against time (X axis). This chart respects the following thresholds –
- Actual Stock
- Safety Stock
- Re-order Point
- Maximum Stock
Colour coding between the above thresholds can be seen in Legends.

Product Stock Visualization Chart
Resource Utilization Chart
Resource Utilization Chart is a time continuous chart which maps the capacity of resources (Y axis) against time (X axis). This chart respects the following thresholds –
- Threshold line which represents the Maximum Capacity of the resource
- Actual line which represents the Current Utilization of the resource
- The red colour indicates that the resource has crossed the threshold for maximum capacity while the green colour indicates that the resource utilization is within the maximum capacity.
- Resource downtimes can also be visualized in this chart
Colour coding between the above thresholds can be seen in Legends.

Resource Utilization Chart
Area of Responsibility
Area of Responsibility (AOR) identifies work centres which are relevant for a Plant/Planner combination.
When user runs the Application for the first time, the user will be prompted to set the Area of Responsibility with a welcome dialog. AOR settings can also be modified as per user’s requirement from the 'App Settings'. Once the selection is confirmed, the values are saved to the user’s AOR profile.

Area of Responsibility Settings
Filters
There are various filters which can be used to load data into the different charts in the ‘Advanced Scheduling Board’ App. These filters are broadly grouped into below sub-categories -
- Basic
- Display Horizon
- Resource Name
- Horizon
- Planning Horizon
- Time Profile
- Resource
- Bottleneck Resource Indicator
- Finite Scheduling
- Finiteness Level
- Resource Category
- Resource Group
- Storage Resource
- Planning
- Planner
- Planning Group
- Planning Version
- Order & Operation
- Only Selected Orders
- Operation Number
- Operation Status
- Order(s)
- Simulation Version
- Miscellaneous
- Only Selected Products
- Plant
- Product
- Sort String
When the App is loaded, following are the filters which would be loaded by default -
- Display Horizon
- Resource Name
Other filters can be selected from the ‘Adapt Filters’ option.
Toolbar
Following are the options available in the toolbar of the ‘Advanced Scheduling Board’ App -
- Chart Selector
- Select
- Show Information
- Show Relationship
- Scheduling
- Undo
- Heuristics
- Order
- Go To Last Object
- Go To Date
- Go To First Object
- Zoom In / Zoom Out
- Zoom Slider
- Strategy
- Find
- Bird's Eye
- Legend
- Settings
Chart Selector
The ‘Chart Selector’ in the toolbar provides flexibility to users to choose between various charts displayed in the application with default chart being the Resource Chart. At any point of time, at least one chart should be selected and a maximum of 4 charts can be selected.
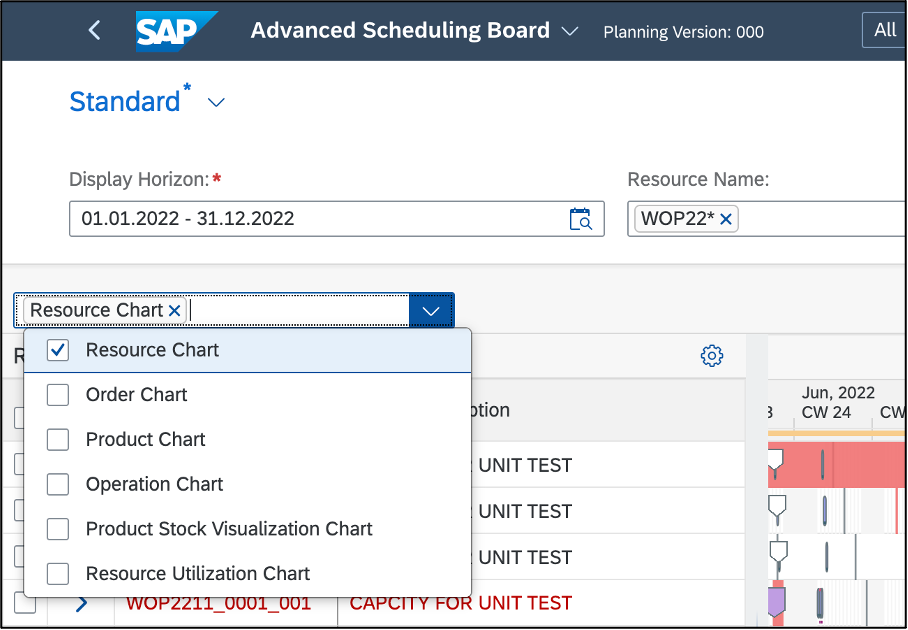
Chart Selector
Select
The ‘Select’ button in the toolbar facilitates easy and convenient selection of shapes in the charts and has the following list of options -
- Graphical Object
- Select Everything in Chart - This option allows the user to select all the objects and shapes which are loaded in the charts which are selected in the table.
- Corresponding Row in Diagram - This option allows the user to select all the objects and shapes which are loaded in the chart for the selected table entry.
- Corresponding Table Entry - This option allows the user to select all the table entries for the shape(s) selected in the charts
- Complement - This option allows the user to select all the shapes loaded in all the charts loaded in the App except for the shapes belonging to the selected shape/order.
- Highlighted Objects - This option allows the user to select all the highlighted shapes loaded in all the charts loaded in the App
- Select All - This option allows the user to select all the objects and shapes which are loaded in all the charts loaded in the App
- Deselect All - This option allows the user to de-select all the selected shapes which are loaded in all the different charts in the App
- Successor – Single Level - This option allows the user to select all the shapes which are immediate successors in the Pegging Relationship of the selected shape
- Successor – Multi Level - This option allows the user to select all the shapes which are successors in the Pegging Relationship of the selected shape
- Predecessor – Single Level - This option allows the user to select all the shapes which are immediate predecessors in the Pegging Relationship of the selected shape
- Predecessor – Multi Level - This option allows the user to select all the shapes which are predecessors in the Pegging Relationship of the selected shape
- For the Same Order - This option allows the user to select all the shapes belonging to the same order as that of the shape selected on all charts loaded in the App

Select
Show Information
The ‘Info’ button in the toolbar is enabled when atleast one operation is selected in the Resource or Operation chart and displays additional details about the the selected operations in a separate side pane.
The shapes can be selected either manually or with Lasso Selection. On click of the ‘Info’ button, a side Pane (for Lasso selection, 2 step approach will be seen) is displayed with the following additional information about the selected operations -
- Overview: Basic information like Operation Start/End date/time, Operation Status, Product & Product description & Quantity
- Component Issues: Missing Component (Product) name, Quantity & Late Receipt (in days)
- Alternative Resource: Lists of Alternate Resources for the resource on which selected operation is scheduled
- Order: Order Number, Order Start/End date/time & Order Priority
- Pegged Requirement: Pegged requirement type, Quantity & Date/Time at which it was created
- Setup: Setup group category & Setup key of the operation
- Activities: Activity type & Activity Start/End date/time
Show Information
Show Relationship
The ‘Show Relationship/Pegging Relationship’ button in the toolbar is enabled when atleast one operation is selected in the Resource or the Operation chart and displays the Pegging Relationships between the different shapes loaded in these charts for the selected shape. The shapes can be selected either manually or with Lasso Selection.

Show Relationships
Relationships can also be viewed in a separate chart using the following Shape Context Menu options -
- Network View - Operations/Orders as a chart
- Network View - Operations/Orders as a dialog
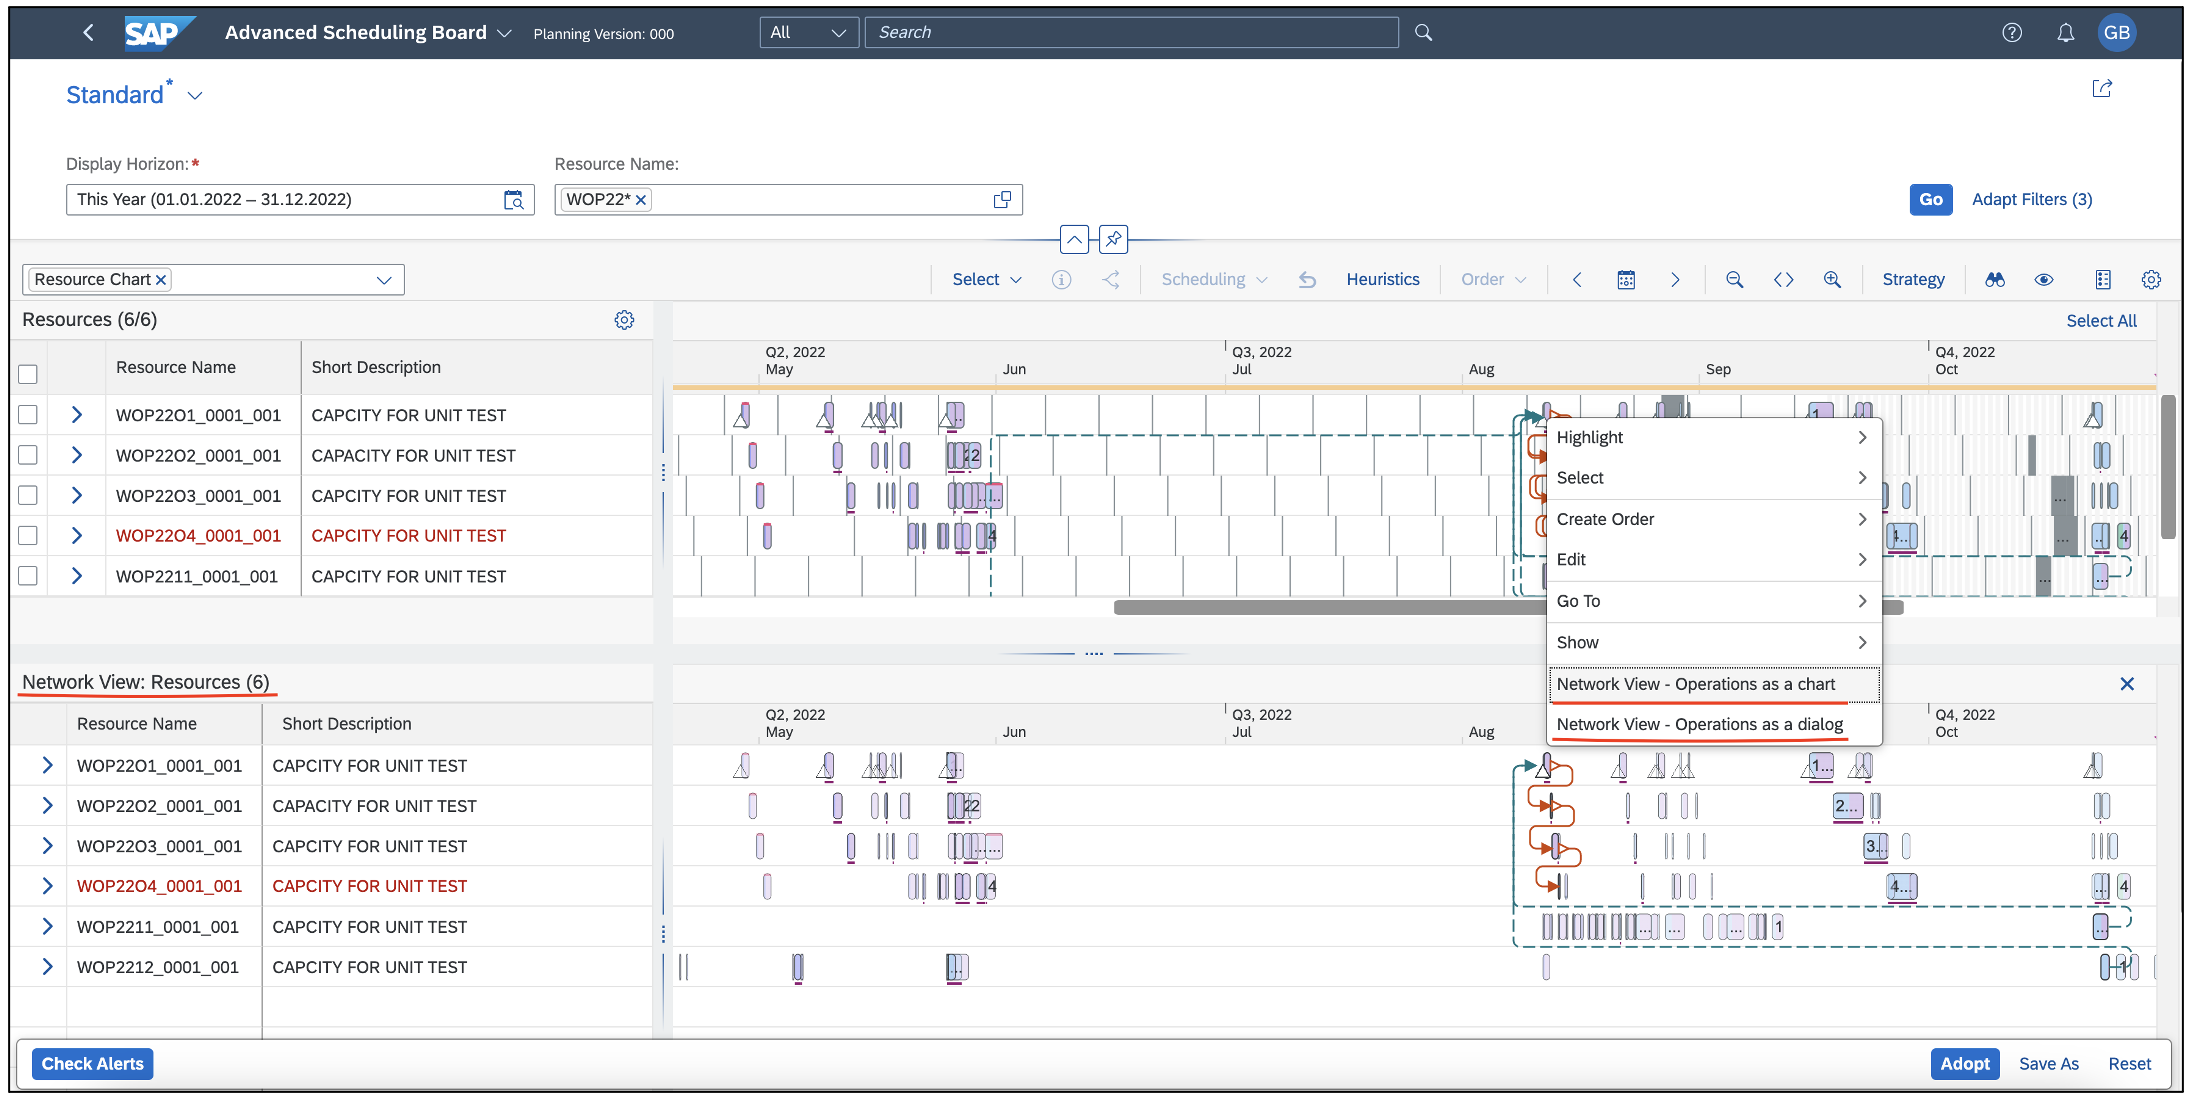
Network View - Operations as a chart
Scheduling
'Scheduling' button on the toolbar will be enabled only when at least one shape is selected from the charts and enables the user to perform the following edit functions -
- Fix
- Undo Fixing
- Deallocate
- Reschedule
Undo
'Undo' button on the toolbar remains disabled until any of edit actions as mentioned below is performed. Only the following edit actions can be undone using the 'Undo' button in the toolbar -
- Drag & Drop
- Reschedule
- Deallocate
Undo is executed sequentially in the same order in which the edit actions were performed.
Heuristics
'Heuristics' button on the toolbar will be enabled only when resource name is added as a filter condition to load the charts. This button navigates to a visually harmonized transaction which allows the user to execute only resource-specific heuristics on all the resources which were loaded into the application. The outcome of heuristics execution is available in the planning log. When the user navigates back to the Advanced Scheduling Board application, the charts are updated as per the results of the heuristics execution.

Heuristics Execution
Order
'Order' button on the toolbar will be enabled only when at least one shape is selected from the charts and enables the user to perform the following edit functions -
- Create Order (with Reference/Template)
- Change Order Quantity
- Switch Order Source of Supply
- Delete Order
Go To Last Object
‘Go to Last Object’ button on the toolbar takes the user to the end of the last shape among all selected rows across the time axis of selected chart. In case no rows are selected, this button takes the user to the end of the last shape of all charts.
Go To Date
‘Go to Date' button opens up a date picker which allows the user to pick a date which then becomes the start of the visible horizon for all the charts. This button also allows the user to go to 'Today' which takes the user to the current date on the calendar and the visible horizon for the charts start from 12am of the current system date for all the charts.
Go To First Object
‘Go to First Object’ button on the toolbar takes the user to the start of the first shape among all selected rows across the time axis of the selected chart. If no rows are selected, this button takes the user to the start of the first shape of all charts.
Zoom In / Zoom Out & Zoom Slider
The ‘Zoom-In’ and ‘Zoom-Out’ buttons can be used to zoom the loaded charts in and out with respect to time. A Zoom Slider bar is also implemented which enables the user to adjust the zoom level of the charts and this can be unveiled using the button between Zoom-In and Zoom-Out buttons.
Strategy
The 'Strategy' button in the main toolbar can be used to set different strategies to control the scheduling of operations and orders in the Advanced Scheduling Board application. These strategies specify which rules and constraints the system must use to determine the date, time and resources for orders and operations.
When the user clicks on 'Strategy' button the Strategy Profile SAP001 opens by default. The user can modify the settings of SAP001 or change the Strategy Profile to a new value. The changes made to the Strategy are saved into the variants and also saved into draft tables for retrieval and usage at a later point of time.
For the ease of better strategy profile setting, the Strategy window has been logically split into the following groups:
- Basic: This section lists all the basic strategy settings which affect the scheduling or rescheduling of Orders or Operations. For example: Strategy Profile, Planning Direction, and other Scheduling relevant settings.
- Dependent Objects: This section lists all the strategy settings that control the scheduling of dependent Operations. For example: Time Relationship related settings and Pegging related settings.
- Others: This section lists all the extra strategy settings which can be used to further refine the scheduling or rescheduling of Orders or Operations. For example: Consider Campaign Requirement, Finiteness Level, Action in case of Scheduling Error, and so on.
The user can choose between two different views of the strategy profile: Expert View and DS View. All settings are available in the Expert View. Whereas the DS View is the application-specific view which has only the settings that are recommended for the related function.
Strategy Consumption in Edit Functions
Strategy settings are considered ONLY for the following Edit Functions –
- Create Order (with Reference & with Template)
- Scheduling Functions (Fix, Undo Fixing, Deallocate, Reschedule, Drag & Drop)
Find & Select
The 'Find and Select' feature provides a list of shapes that match the search value/property provided by the user in the search panel. On pressing the 'find' button a dialog box appears that allows you to filter the search via a selected attribute. After selecting an attribute a search panel appears below the Gantt Toolbar.
The value to be searched can be entered in the search bar and on clicking enter/search a list of all the matches is returned in the form of a list. The search panel can be closed using the “Close” button in the top right corner of the bar.
Find and Select
Bird's Eye
The ‘Bird’s Eye’ view button on the toolbar provides a top level holistic perspective of all the shapes plotted on the Gantt charts. This button adjusts the zoom level such that all the shapes that are plotted on all the charts are visible at a single glance.
Legend
The 'Legend' button in the toolbar details out all the different shapes including relationship types & thresholds for the time continuous charts which are drawn in all the different charts loaded in the application. Legends shown in the toolbar are dynamic based on the charts loaded in the App. For example, if only the Product Chart is loaded in the App, then the legends relevant for Resources such as downtimes, fixed interval etc. are not displayed.

Legends
Settings
The following standard settings provided as a part of the Gantt Toolbar can be accessed using the ‘Settings’ button on the toolbar -
- Chart Settings
- Indicate Current Time - This setting is to show/hide the current date & time indicator (line) on all charts loaded in the App
- Show Cursor Line - This setting is used to show/hide the cursor line on all charts loaded in the App
- Show Divider Lines - This setting is used to show/hide the date & time demarcation lines on all charts loaded in the App
- Show Delta Lines - This setting is used to show/hide the additional lines such as the Orange line for Planning Horizon, Blue line for Order Duration etc. on all charts loaded in the app.
- Synchronize Time Scroll - This setting enables/disables synchronisation of the time axis for all the charts loaded in the App.
- When enabled, the time axis of all the charts loaded in the App will always be in sync during horizontal scroll.
- When disabled, the user will be able to scroll and see different times on the time axis on the different charts loaded.
- Show Status Bar - This setting enables/disables the status bar for the App. When enabled, the status bar gives detailed information like details about the shapes on which the cursor is placed, number of objects selected on the charts etc.
- Details about the shape over which the cursor is hovered
- Number of selected objects
- Profile Settings
- Alert Profile - The Alert Profile can be set which acts as a filter and determines which alerts should be displayed when the 'Check Alerts' button is pressed.
Context Menu
Shape Context Menu
A Context Menu is displayed with various options when the user right-clicks on a shape in any of the charts loaded in the ‘Advanced Scheduling Board’ App. These options are specific to the chart on which the right-click was performed. The shapes can be selected either manually or with Lasso Selection and upon right-click, the context menu is displayed.
These content menu options include functions related to -
- Selection/Highlighting of shapes
- Edit Functions
- Navigation to other visually harmonized applications
- Show/Hide Pegging Relationships
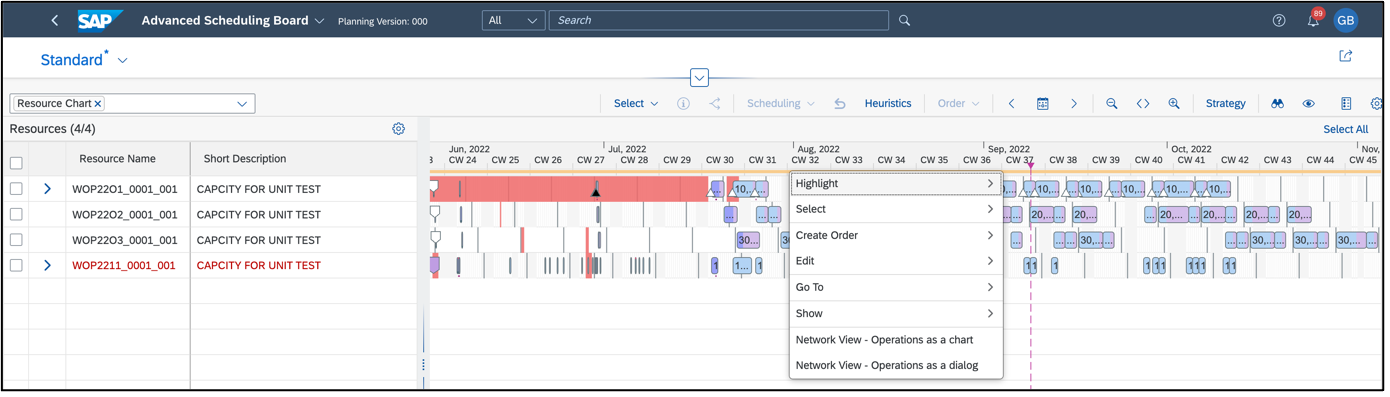
Shape Context Menu
Table Context Menu
A Context Menu is displayed with various options when the user right-clicks on a column in any of the tables loaded in the ‘Advanced Scheduling Board’ App. These options are specific to the table on which the right-click is performed.
These content menu options include functions related to -
- Selection/Highlighting of shapes
- Edit Functions
- Navigation to other visually harmonized applications
Table Context Menu
Variant
The ‘Advanced Scheduling Board’ App has been delivered with the Standard Variant. It is also possible to save a variant using the ‘Save As’ option.
Saving a variant captures the filters in the filter bar as Standard feature. Along with this, other relevant changes such as Chart Selection, Zoom Level, Bird Eye View, Gantt Toolbar Settings, Table column sequence and sort/filters options are also captured.
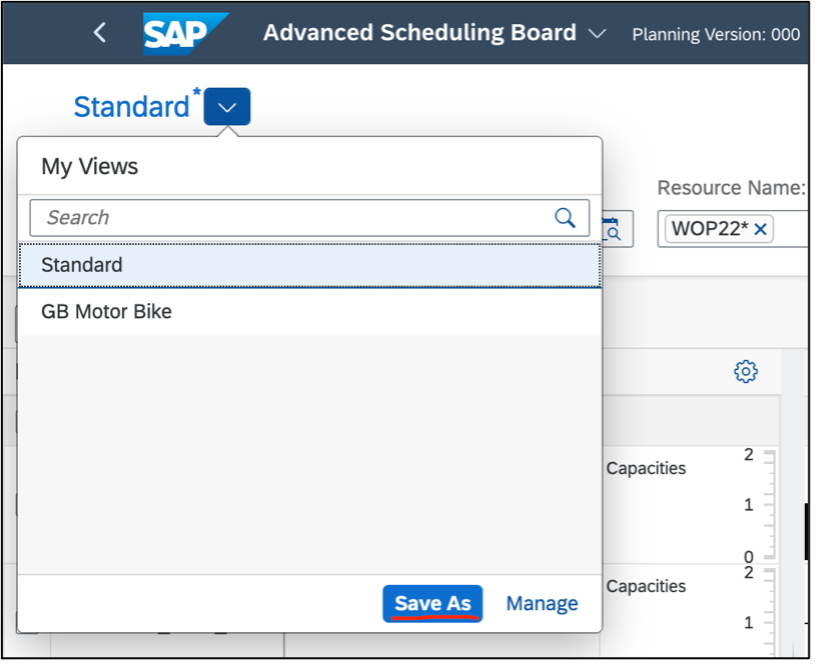
Save As a Variant
Variants can be loaded by selecting the ‘Standard’ view in the Advanced Scheduling Board App.
Using ‘Manage’, it is possible to set a Variant as Default & flag ‘Apply Automatically’ so that when a user opens the ‘Advanced Scheduling Board’ app, the default variant is automatically loaded without pressing ‘Go’ button

Manage Variants
Cross App Navigation
Advanced Scheduling Board supports navigation to other visually harmonized applications from both the shape as well as table context menu for each of the charts. These options are specific to the chart and the shape on which the right-click is performed. Some of these transactions are listed below -
- Maintain Resources (/SAPAPO/RES01)
- Product Master (/SAPAPO/MAT1)
- Product View (/SAPAPO/RRP3)
- Receipts View (/SAPAPO/RRP4)
- Pegging Overview (/SAPAPO/PEG1)
- Order Processing (/SAPAPO/RRP2)
- Product Planning Table (/SAPAPO/PPT1)
Advanced Scheduling Board also supports Simulation Session sharing with some visually harmonized applications such that any changes done to planning objects in these transactions are synced back with the Advanced Scheduling Board when the user navigates back. Following is the list of transactions where Simulation Session sharing is supported -
- Product View (/SAPAPO/RRP3)
- Order Processing (/SAPAPO/RRP2)
- Receipts View (/SAPAPO/RRP4)
- Pegging Overview (/SAPAPO/PEG1)
- Product Planning Table (/SAPAPO/PPT1)
- Maintain Resources (/SAPAPO/RES01)
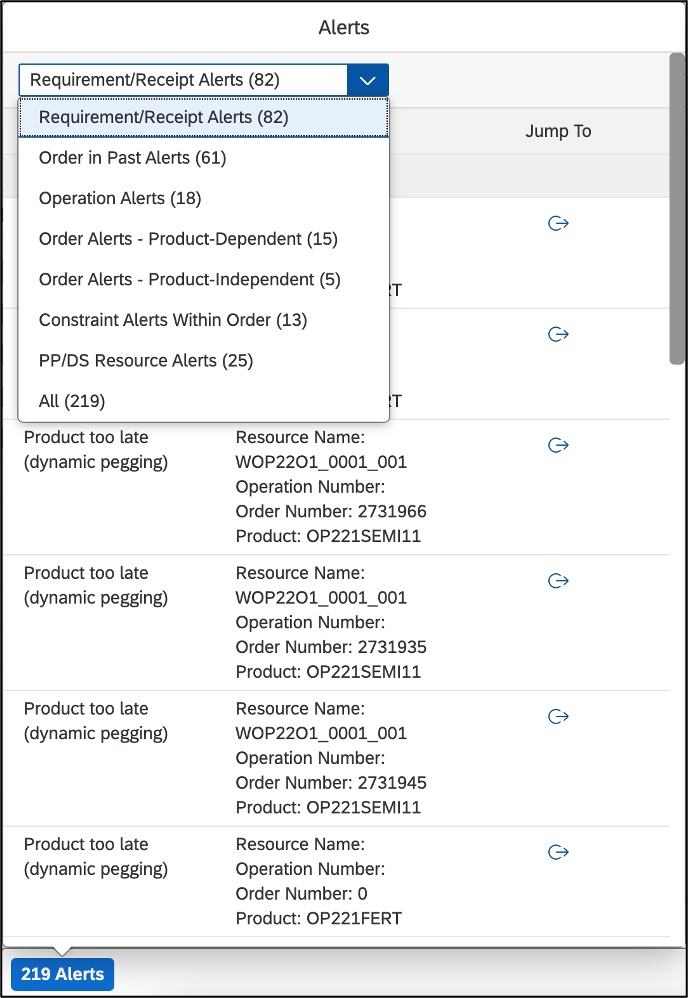
Alerts
The ‘Check Alerts’ button in the Footer bar displays all the alerts based on the filter criteria that was used to load the ‘Advanced Scheduling Board application’. The Alert(s) details are fetched once the button ‘Check Alerts’ is pressed and are displayed in a new dialog screen.
The Alerts displayed in a new dialog screen are sorted and grouped based on the Alert Type such as Requirement/Receipt Alerts, Order in Past Alerts, PP/DS Resource Alerts etc. The user has the option to filter the Alerts based on the Alert Type or see ‘All’ the alerts at once.
Every selection in the ‘Alerts’ table have the following:
- Alert type: Displays the Alert Type Description
- Object details: Displays details about the object based on the Alert Type
- ’Jump To’ Button: Navigates and selects the shape for which the Alert is raised in the charts loaded on the App
Alerts
Alerts can be filtered by setting an Alert Profile that acts as a filter and determines what alerts should be displayed. The Alert Profile can be set by clicking on the settings button in the Gantt Toolbar and then switching to the 'Profile Settings' tab.
Interactive Edit Functions
Advanced Scheduling Board supports interactive edit functions for the Planner to make changes to the different planning objects and save the changes to a new/existing simulation version or adopt it to the active planning version. These edit functions options are available from both the shape context menu as well the Gantt toolbar as explained below -
 Interactive Edit Functions
Create Order with Reference
This function enables the user to use an existing order as a reference for creating new planned orders. The Strategy settings which are maintained with the Advanced Planning Board application are taken into consideration when this function is executed. The existing order details are displayed in a new dialog box where the user can enter Quantity, Unit of Measure, Start Date/Time, Availability Date/Time and click on 'Create' button to create a new planned order.
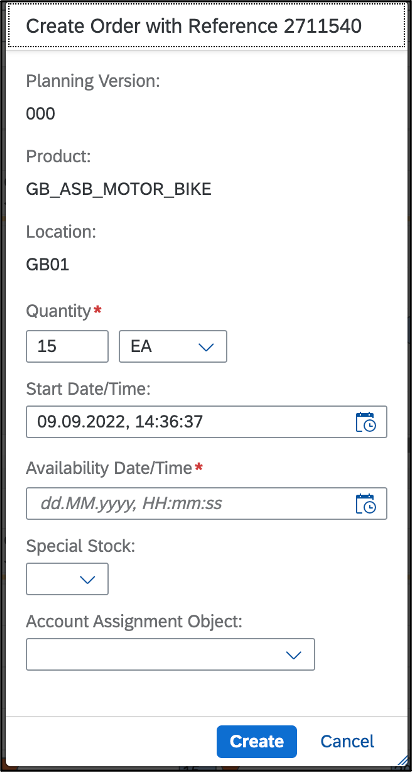
Create Order with Reference
Create Order with Template
This function enables the user to use an existing order as a template for creating multiple new planned orders at once. The Strategy settings which are maintained with the Advanced Planning Board application are taken into consideration when this function is executed. The existing order details are displayed in a new dialog box where the user can enter Quantity, Unit of Measure and number of orders to be created and click on 'Create' button to create one/multiple planned orders.
Create Order with Template
Change Order Quantity
This function enables the user to change the order quantity for a single order. The existing order details are displayed in a new dialog box where the user can change the Quantity, Unit of Measure and click on 'Save' button to change the order quantity.

Change Order Quantity
Switch Order Source of Supply
This function enables the user to change the Source of Supply for an Order for a single order. The user can choose to switch the source of supply to any of the in-house/external procurement sources which are listed in a dialog box and click on 'Save' button.
Switch Source of Supply for Order
Delete Order
This function enables the user to delete one or multiple orders. The orders which are selected for deletion are displayed in a new dialog box and the user can select/unselect orders from this dialog box and click on 'Delete' button.

Delete Order
Fix
This function enable the user to Fix one or multiple operations/orders so as to ensure that no further changes such as date or resource schedule changes affect these operations/orders. A Red solid line on the top of the shape indicates that the operation/order is fixed.
Undo Fixing
This function enables the user to Undo the fixing done on one or multiple operations/orders. Once the fixing is undone, the Red solid line is no longer visible on the shape.
Deallocate
This function enables the user to deallocate or remove one or multiple operations/orders from the resource schedule and prioritize other orders if needed. A Green line at the bottom of the shapes indicates that the operation/order has been deallocated. This is visible in the Resource and Operation Charts only.
Set Conversion Indicator
This function enables the user to set the conversion indicator to convert the planned order or purchase requisition to a production order or purchase order respectively. A downward facing triangle situated at the right boundary (bottom corner) of a planned order indicates that the conversion indicator has been set for that planned order. Once the user adopts the simulation version to the active planning version, the indicator is no longer visible and the planned order is converted to a production order.
Delete Conversion Indicator
This function enables the user to delete the already set conversion indicator. Once the conversion indicator has been deleted, the downward facing triangle is no longer visible.
Drag and Drop
This function enables the user to drag and drop one or multiple non-fixed shape (via lasso selection) in the Gantt chart and rescheduled the shape manually within a chart. While dragging the shape, ghost shapes with dotted lines are visible which enable the user to locate and drop the shape at the exact desired position. The Strategy settings which are maintained with the Advanced Planning Board application are taken into consideration when this function is executed.
Reschedule
This function enables the user to reschedules one or multiple operations/orders that are already scheduled and are affected by scheduling problems. Operations/orders that start within the planning period can only be rescheduled. The Strategy settings which are maintained with the Advanced Planning Board application are taken into consideration when this function is executed.
Save Simulation Version
Changes done to the different planning objects in an unsaved simulation version can be saved into an existing or a new Simulation Version. This enables the user to revisit and saved simulation version and continue working on the same.
Simulation Version can be saved by clicking on 'Save As' button in the Footer bar.
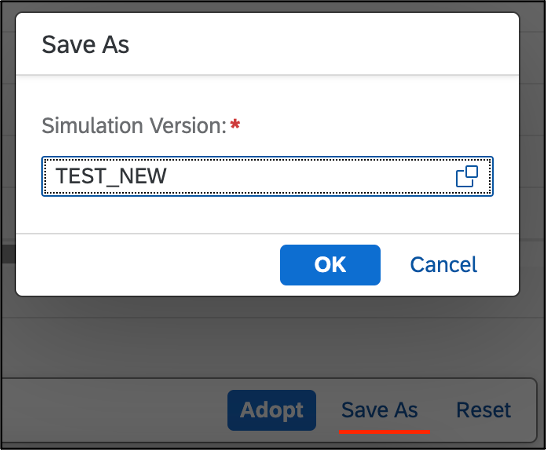
Save As Simulation Version
The saved simulation version can be loaded using the 'Simulation Version' filter which is available under 'Order and Operation' in the smart filter bar. The same changes can also be viewed and modified in the SAP GUI transaction for Simulation Version /SAPAPO/CDPSS0.

Load Simulation Version
Adopt Simulation
Changes done to the different planning objects in an unsaved simulation version can also be adopted/merged to the Active Planning Version 000. This can be done by clicking on the 'Adopt' button in the Footer bar.
Once the simulation version is adopted, it is deleted and all the changes will be available in the Active Planning Version.
Reset Simulation
Changes done to the different planning objects in an unsaved simulation version can be reset back to the state as it was during the initial load of the application by using the 'Reset' button in the footer bar.
Table Personalization
Table Personalization enables the user to add/remove columns, sort & filter the columns for all the charts which are loaded in the Advanced Scheduling Board application. The settings button available at the top right corner of the table facilitates the same.
Table Personalization : Resource Chart
Column Addition/Removal
The Columns tab enables the user to do the following -
- Add/remove columns to the table
- Change the sequence of columns
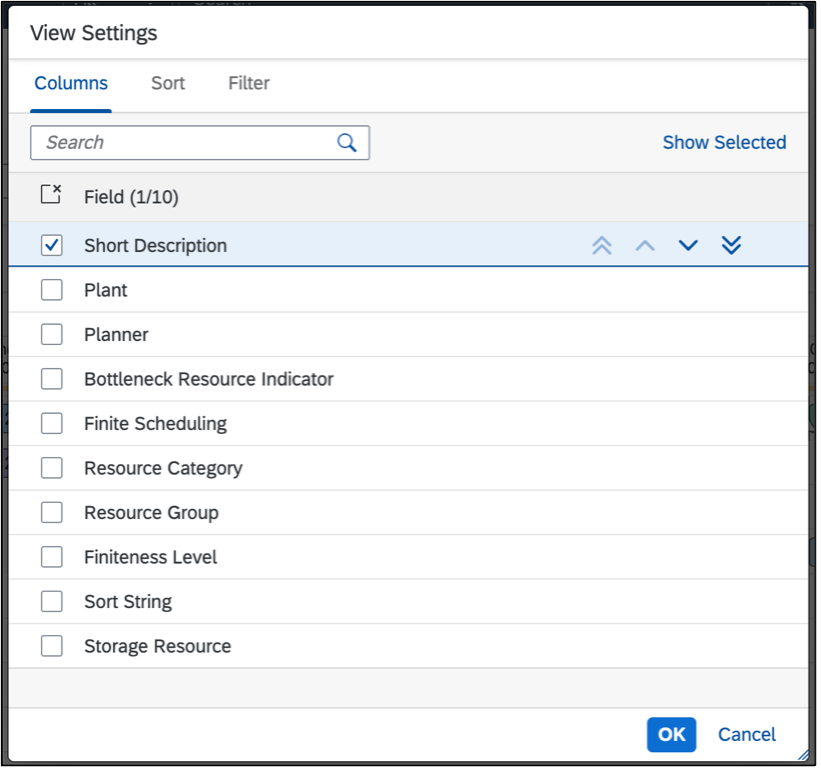
Table Personalization : Columns
Sorting
The Sort tab enables the user to choose the column(s) based on which data should be sorted. These can also be dragged up or down to be re-ordered.
For example the user can sort the data via Resource Name in ascending order and then further sort the Plant in descending order so on and so forth.
Note: Only a few selected columns support sorting

Table Personalization : Sort
Filtering
The Filter tab enables the user to create filters for the given table which includes a column name, a comparison type and a value.
Note: Only a few selected columns support filtering.

Table Personalization : Filter
Restrictions & Recommendations
Please refer to note 3127808 to know more about the recommendations for Advanced Scheduling Board for OP2021 FPS1 Release
Please refer to note 3211529 to know more about the recommendations for Advanced Scheduling Board for OP2022 FPS0 Release.
- SAP Managed Tags:
- SAP S/4HANA,
- SCM APO Production Planning and Detailed Scheduling (PP/DS)
Labels:
11 Comments
You must be a registered user to add a comment. If you've already registered, sign in. Otherwise, register and sign in.
Labels in this area
-
Business Trends
169 -
Business Trends
23 -
Catalog Enablement
1 -
Event Information
47 -
Event Information
2 -
Expert Insights
12 -
Expert Insights
35 -
intelligent asset management
1 -
Life at SAP
63 -
Product Updates
500 -
Product Updates
60 -
Release Announcement
1 -
SAP Digital Manufacturing for execution
1 -
Super Bowl
1 -
Supply Chain
1 -
Sustainability
1 -
Swifties
1 -
Technology Updates
187 -
Technology Updates
14
Related Content
- RISE with SAP Advanced Logistics Package in Supply Chain Management Blogs by SAP
- Transforming Your Supply Chain: Introducing RISE with SAP Advanced Logistics Package in Supply Chain Management Blogs by SAP
- RISE with SAP advanced asset and service management package in Supply Chain Management Blogs by SAP
- How AI-based Anomaly Detection empowers reliability engineers in SAP Asset Performance Management in Supply Chain Management Blogs by SAP
- 5 Reasons why Planners Should Consider the RISE with SAP Advanced Supply Chain Planning Package in Supply Chain Management Blogs by SAP
Top kudoed authors
| User | Count |
|---|---|
| 9 | |
| 6 | |
| 4 | |
| 3 | |
| 3 | |
| 3 | |
| 2 | |
| 2 | |
| 2 | |
| 2 |