
- SAP Community
- Products and Technology
- Technology
- Technology Blogs by SAP
- Python hana_ml: Visualize Dataset(DatasetReportBui...
Technology Blogs by SAP
Learn how to extend and personalize SAP applications. Follow the SAP technology blog for insights into SAP BTP, ABAP, SAP Analytics Cloud, SAP HANA, and more.
Turn on suggestions
Auto-suggest helps you quickly narrow down your search results by suggesting possible matches as you type.
Showing results for
Advisor
Options
- Subscribe to RSS Feed
- Mark as New
- Mark as Read
- Bookmark
- Subscribe
- Printer Friendly Page
- Report Inappropriate Content
09-07-2022
1:17 AM
I am writing this blog to show data visualization using python package hana_ml. DatasetReportBuilder is a EDA function and show report as below. I used famous titanic dataset, which is easy to understand.

Environment
Environment is as below.
- Python: 3.7.13(Google Colaboratory)
- HANA: Cloud Edition 2022.16
Python packages and their versions.
- hana_ml: 2.13.22072200
- pandas: 1.3.5
- seaborn: 0.11.2(just for getting titanic dataset)
As for HANA Cloud, I activated scriptserver and created my users. Though I don't recognize other special configurations, I may miss something since our HANA Cloud was created long time before.
I didn't use HDI here to make environment simple.
Generated Report
A report can be displayed within jupyter or downloaded as html file.
Overview
"Variable Types" block has Detail tab.

Sample
Sample shows top 10 records.

Variables
Variables screen shows variable statistics.


Variable "Age" is Automatically discretized.

Character type variables are shown as doughnut chart.

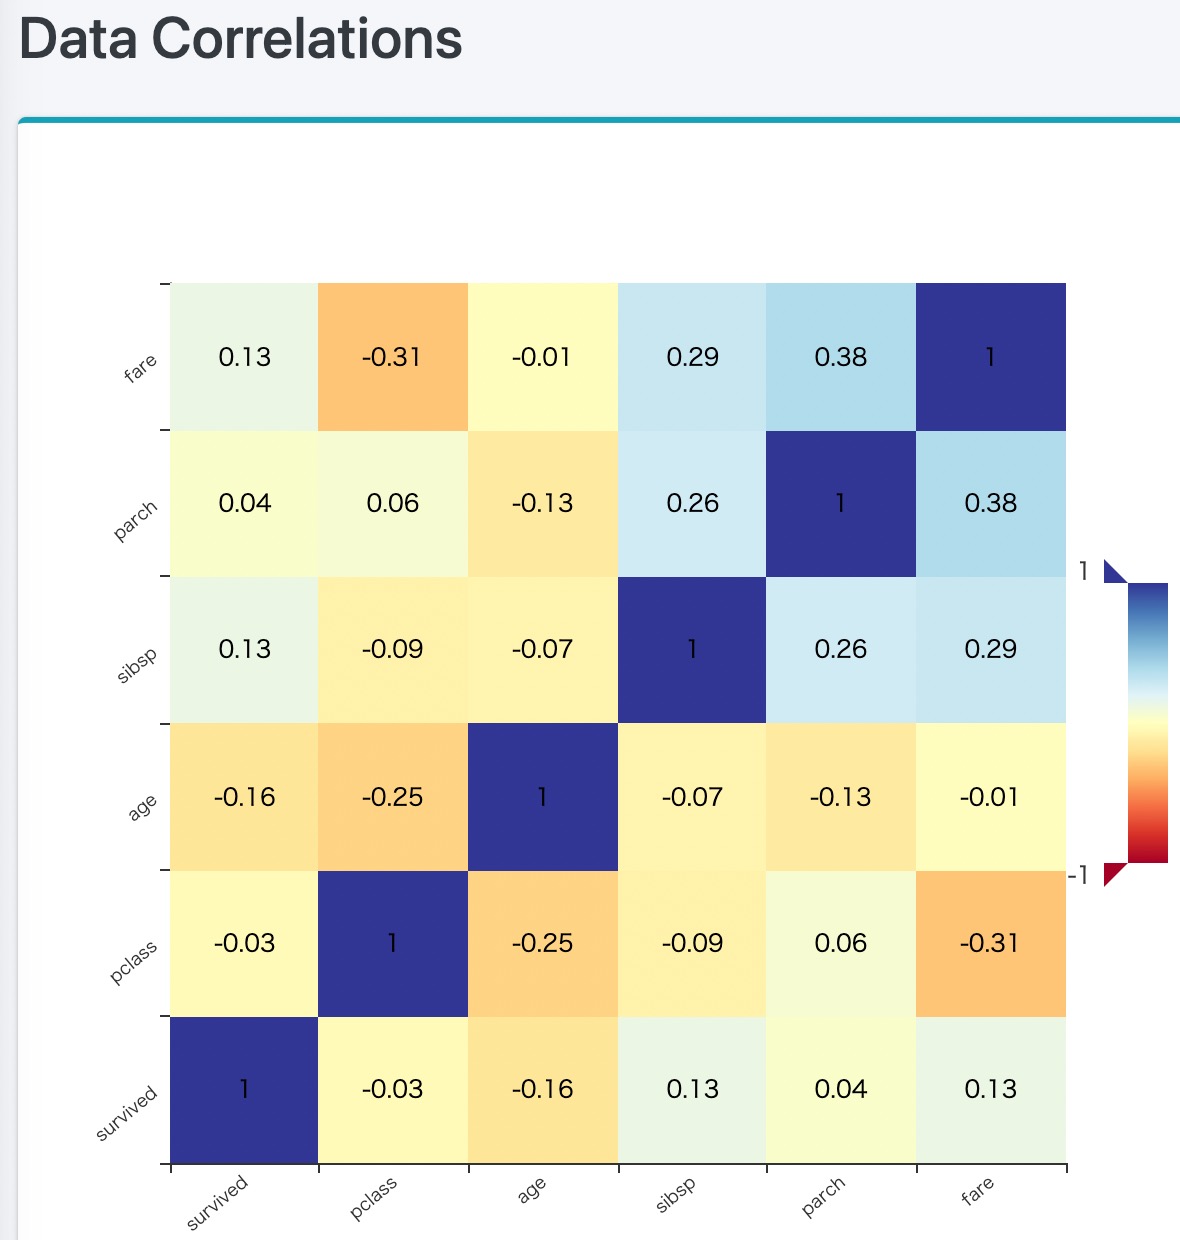
Data Correlations
Data Scatter Matrix

Python Script
1. Install Python packages
Install python package hana_ml, which is not pre-installed on Google Colaboratory.
As for pandas and seaborn, I used pre-installed ones.
!pip install hana_ml2. Import modules
Import python package modules.
from hana_ml.dataframe import ConnectionContext, create_dataframe_from_pandas

from hana_ml.visualizers.dataset_report import DatasetReportBuilder

import pandas as pd

import seaborn as sns
3. Connect to HANA Cloud
Connect to HANA Cloud and check its version.
ConnectionContext class is for connection to HANA.
HOST = '<HANA HOST NAME>'

SCHEMA = USER = '<USER NAME>'

PASS = '<PASSWORD>'

conn = ConnectionContext(address=HOST, port=443, user=USER,

                           password=PASS, schema=SCHEMA,

                           encrypt=True, sslValidateCertificate=False)

print(conn.hana_version())
4.00.000.00.1660640318 (fa/CE2022.16)4. Load Titanic dataset
Load Titanic dataset using seaborn. I rename a column name to "gender", since original name is prohibit in the SAP Community blog.
df = sns.load_dataset('titanic')

df.rename({'xx': 'gender'}, axis=1, inplace=True)

print(df)

df.info()
Here is dataframe overview.
     survived  pclass  gender   age  sibsp  parch     fare embarked   class  \

0           0       3    male  22.0      1      0   7.2500        S   Third

1           1       1  female  38.0      1      0  71.2833        C   First

2           1       3  female  26.0      0      0   7.9250        S   Third

3           1       1  female  35.0      1      0  53.1000        S   First

4           0       3    male  35.0      0      0   8.0500        S   Third

..        ...     ...     ...   ...    ...    ...      ...      ...     ...

886         0       2    male  27.0      0      0  13.0000        S  Second

887         1       1  female  19.0      0      0  30.0000        S   First

888         0       3  female   NaN      1      2  23.4500        S   Third

889         1       1    male  26.0      0      0  30.0000        C   First

890         0       3    male  32.0      0      0   7.7500        Q   Third


       who  adult_male deck  embark_town alive  alone

0      man        True  NaN  Southampton    no  False

1    woman       False    C    Cherbourg   yes  False

2    woman       False  NaN  Southampton   yes   True

3    woman       False    C  Southampton   yes  False

4      man        True  NaN  Southampton    no   True

..     ...         ...  ...          ...   ...    ...

886    man        True  NaN  Southampton    no   True

887  woman       False    B  Southampton   yes   True

888  woman       False  NaN  Southampton    no  False

889    man        True    C    Cherbourg   yes   True

890    man        True  NaN   Queenstown    no   True


[891 rows x 15 columns]

<class 'pandas.core.frame.DataFrame'>

RangeIndex: 891 entries, 0 to 890

Data columns (total 15 columns):

 #   Column       Non-Null Count  Dtype

---  ------       --------------  -----

 0   survived     891 non-null    int64

 1   pclass       891 non-null    int64

 2   gender       891 non-null    object

 3   age          714 non-null    float64

 4   sibsp        891 non-null    int64

 5   parch        891 non-null    int64

 6   fare         891 non-null    float64

 7   embarked     889 non-null    object

 8   class        891 non-null    category

 9   who          891 non-null    object

 10  adult_male   891 non-null    bool

 11  deck         203 non-null    category

 12  embark_town  889 non-null    object

 13  alive        891 non-null    object

 14  alone        891 non-null    bool

dtypes: bool(2), category(2), float64(2), int64(4), object(5)

memory usage: 80.7+ KB
5. Define table and upload data
Define HANA Table and upload data using function "create_dataframe_from_pandas".
TRAIN_TABLE = 'PAL_TRAIN'

dfh = create_dataframe_from_pandas(conn, df, TRAIN_TABLE,

                             schema=SCHEMA,

                             force=True, # True: truncate and insert

                             replace=True) # True: Null is replaced by 0

print(f'Table Structure: {dfh.get_table_structure()}')
Table Structure: {'survived': 'INT', 'pclass': 'INT', 'gender': 'NVARCHAR(5000)',
'age': 'DOUBLE', 'sibsp': 'INT', 'parch': 'INT', 'fare': 'DOUBLE',
'embarked': 'NVARCHAR(5000)', 'class': 'NVARCHAR(5000)', 'who': 'NVARCHAR(5000)',
'adult_male': 'NVARCHAR(5000)', 'deck': 'NVARCHAR(5000)',
'embark_town': 'NVARCHAR(5000)', 'alive': 'NVARCHAR(5000)', 'alone': 'NVARCHAR(5000)'}6. Generate report
Here is the main part. It takes about 30 seconds to generate a report. It calculates correlation, so it takes so much time with many records.
Dataset need key columns, so I added a key "ID" column using "add_id" function.
"generate_notebook_iframe_report" function show a report in Jupyter.
"generate_html_report" function save a html report file. Its parameter is fine name prefix, so "titanic_dataset_report.html" is the complete fine name in this script.
datasetReportBuilder = DatasetReportBuilder()

datasetReportBuilder.build(dfh.add_id(), key="ID")

datasetReportBuilder.generate_notebook_iframe_report()

datasetReportBuilder.generate_html_report('titanic')
7. Close connection
Last but not least, closing connection explicitly is preferable.
conn.close()
Labels:
You must be a registered user to add a comment. If you've already registered, sign in. Otherwise, register and sign in.
Labels in this area
-
ABAP CDS Views - CDC (Change Data Capture)
2 -
AI
1 -
Analyze Workload Data
1 -
BTP
1 -
Business and IT Integration
2 -
Business application stu
1 -
Business Technology Platform
1 -
Business Trends
1,658 -
Business Trends
107 -
CAP
1 -
cf
1 -
Cloud Foundry
1 -
Confluent
1 -
Customer COE Basics and Fundamentals
1 -
Customer COE Latest and Greatest
3 -
Customer Data Browser app
1 -
Data Analysis Tool
1 -
data migration
1 -
data transfer
1 -
Datasphere
2 -
Event Information
1,400 -
Event Information
72 -
Expert
1 -
Expert Insights
177 -
Expert Insights
343 -
General
1 -
Google cloud
1 -
Google Next'24
1 -
GraphQL
1 -
Kafka
1 -
Life at SAP
780 -
Life at SAP
14 -
Migrate your Data App
1 -
MTA
1 -
Network Performance Analysis
1 -
NodeJS
1 -
PDF
1 -
POC
1 -
Product Updates
4,575 -
Product Updates
386 -
Replication Flow
1 -
REST API
1 -
RisewithSAP
1 -
SAP BTP
1 -
SAP BTP Cloud Foundry
1 -
SAP Cloud ALM
1 -
SAP Cloud Application Programming Model
1 -
SAP Datasphere
2 -
SAP S4HANA Cloud
1 -
SAP S4HANA Migration Cockpit
1 -
Technology Updates
6,872 -
Technology Updates
474 -
Workload Fluctuations
1
Related Content
- Exploring ML Explainability in SAP HANA PAL – Classification and Regression in Technology Blogs by SAP
- SAP Integration Suite - Design Guidelines in the integration flow editor of SAP Cloud Integration in Technology Blogs by SAP
- Tracking HANA Machine Learning experiments with MLflow: A technical Deep Dive in Technology Blogs by SAP
- Fiori Tools Visual Studio Code Completion No Suggestions in Technology Q&A
- Digital Twins of an Organization: why worth it and why now in Technology Blogs by SAP
Top kudoed authors
| User | Count |
|---|---|
| 17 | |
| 15 | |
| 13 | |
| 10 | |
| 9 | |
| 7 | |
| 7 | |
| 7 | |
| 7 | |
| 6 |