


- SAP Community
- Products and Technology
- Technology
- Technology Blogs by SAP
- Test Suite Dashboard - Overview Page
Technology Blogs by SAP
Learn how to extend and personalize SAP applications. Follow the SAP technology blog for insights into SAP BTP, ABAP, SAP Analytics Cloud, SAP HANA, and more.
Turn on suggestions
Auto-suggest helps you quickly narrow down your search results by suggesting possible matches as you type.
Showing results for
Employee
Options
- Subscribe to RSS Feed
- Mark as New
- Mark as Read
- Bookmark
- Subscribe
- Printer Friendly Page
- Report Inappropriate Content
08-22-2022
8:28 AM
Introduction
This blog is part of the blogs series for the new "Test Suite Dashboard" delivered as part of Focused Build SP10 delivery. It will be followed by another blog focusing on the detail pages of the dashboard. This blog focuses on the overview page and cards built within.
Pre-requisite
Please go through the first blog of the series: Understanding The New “Test Suite Dashboard” | SAP Blogs
Test Suite Dashboard: Test Suite Mode
The filter bar provides filter options on solution (mandatory), project, test plan and test package with left to right filtering. Once the solution is selected, test plans can also be selected directly. The test plans here are part of the selected solution. It has seven cards, and their data is based on filter selection.
Test Suite Dashboard - Focused Build Mode
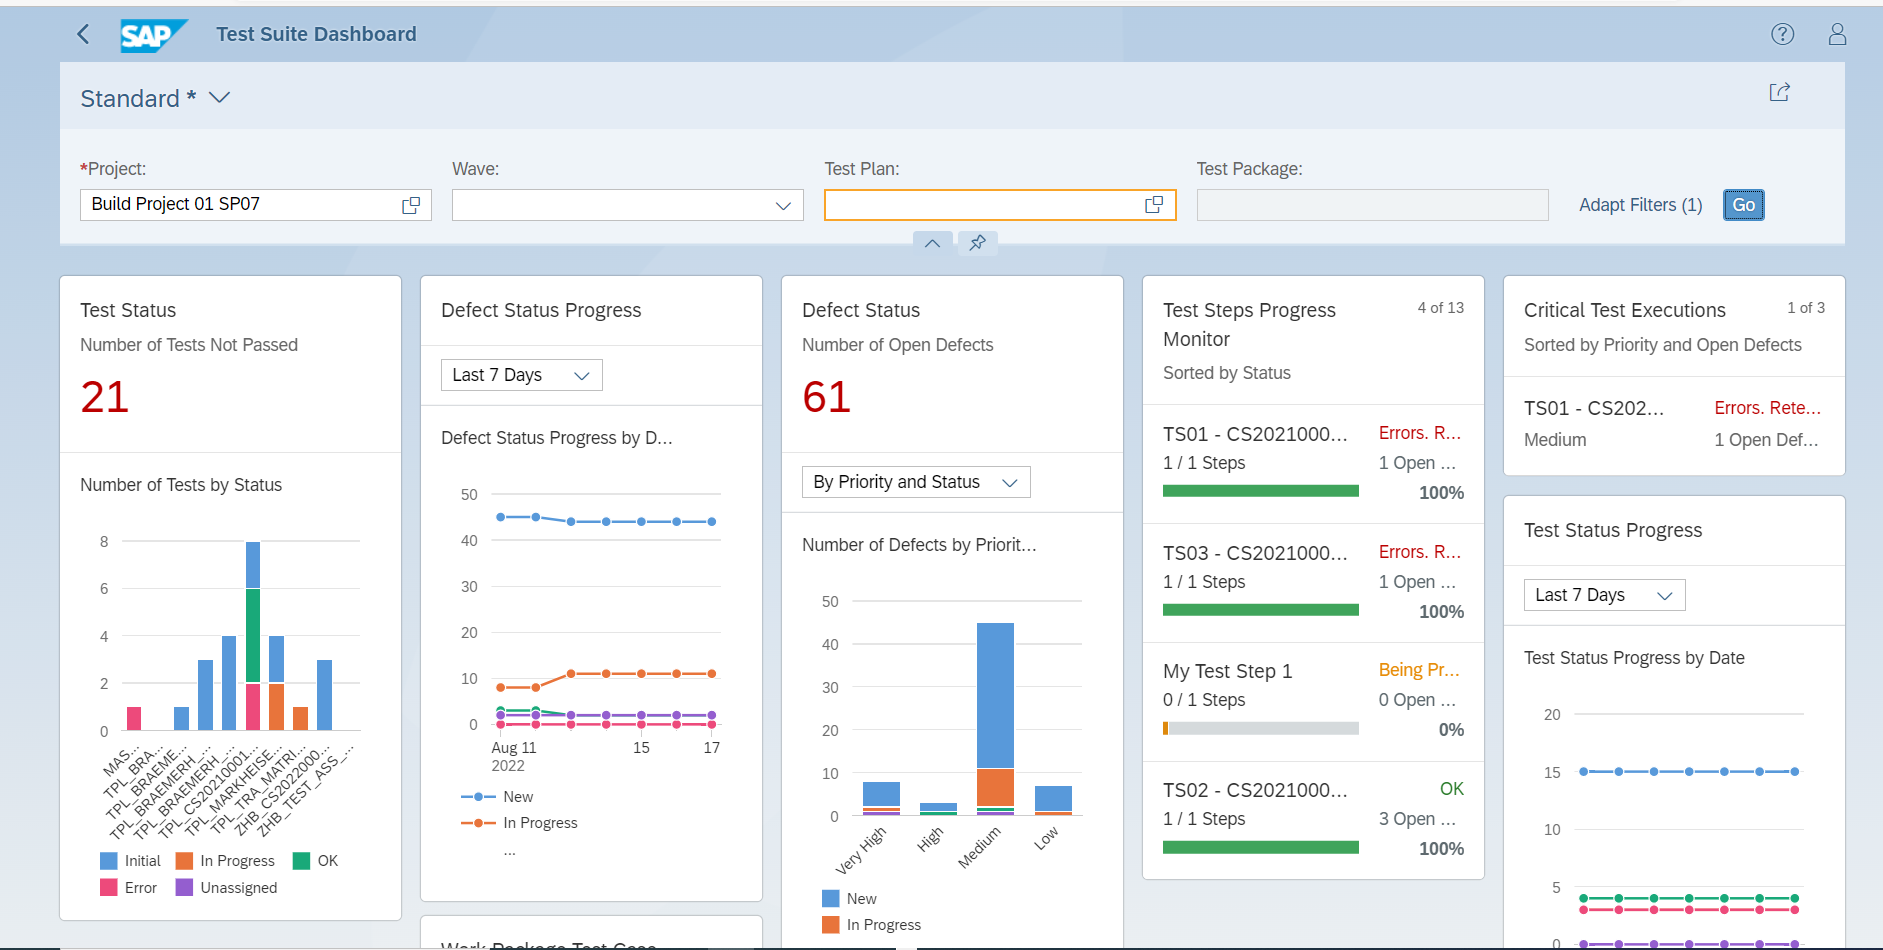
The filter bar in this mode differs from the test suite mode. Instead of solution, the mandatory filter here is project and subsequent filters include: wave, test plan and test package. Left to right filtering is enabled here as well. This mode has an additional card called “Work Package Test Case Assignment”. The other features are like test suite mode.
Filter Bar: Test Plan Value Help
The Solution selected in the filter bar is respected here. The other filters provided are Branch, Scope, Responsible, Test Classification, Release Status with multi-input selection along with Planned Start Date and Planned End Date.
Test plans can directly be searched by giving some text in the search bar at the top. header. Multiple Test Plans can be selected from this list. The test plans retrieved are based on selected filters and user authorizations.
Responsible Value Help
Filtering can be done based on First/Last Name, BP (Business Partner) IDs, Search Term and Username. Business Partners can also be selected by typing some related text in the search bar.

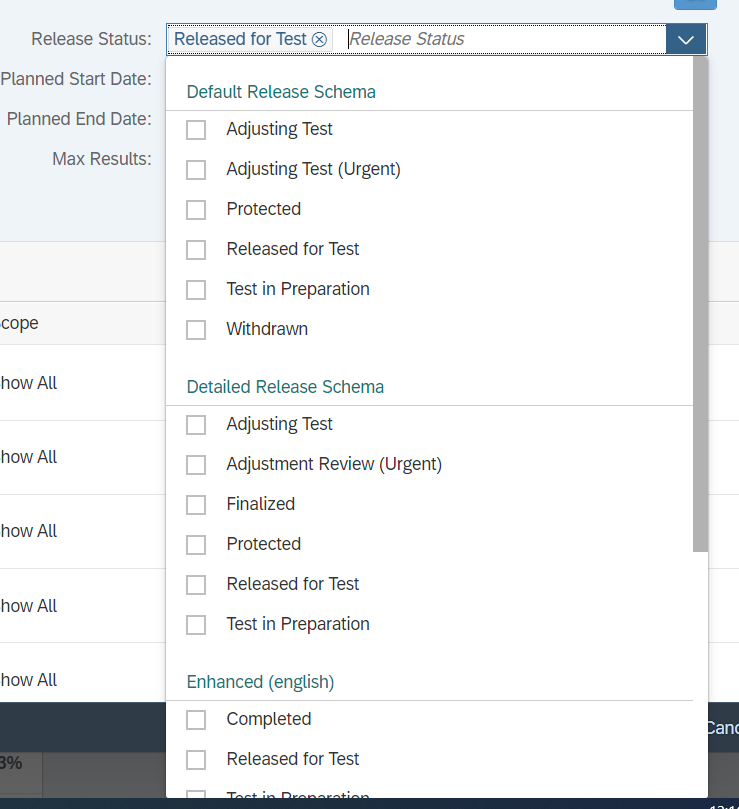
Release Status Dropdown
The released status values are grouped by the schema definition.
Variant Management- How to create a view?
Once the filters are selected from the filter bar and the “Go” button is pressed, the view can be saved as a variant.

Click on the dropdown as shown in the above image. The list of views already created is visible here.
Click on “Save As” and give some view name. Here two check boxes are available:
- Set as Default: Marks the view as default view
- Public: As soon Public is selected, a dialog opens asking for a transport. This view can also be saved as a local object too.
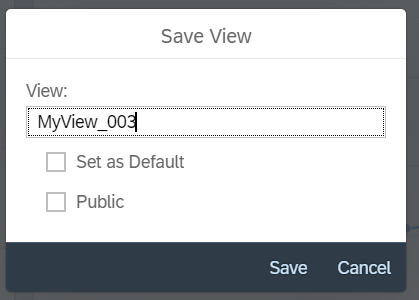
Click on Save and the view is created.
When “Manage” Button is clicked, below dialog opens.

To delete a view, select the cross button as the end of each line item. To set the default view, use the radio button.
User Personalization - Manage Cards
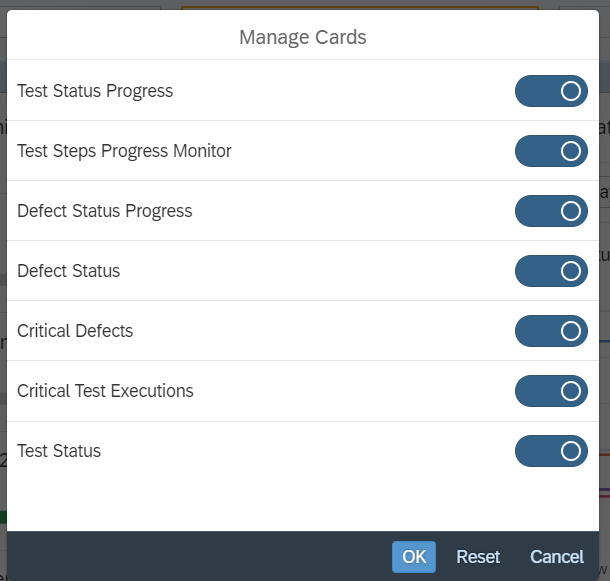
Using this feature, which cards should be displayed on the dashboard, can be configured. Click on the head and shoulder button on the top right corner and then select “Manage Cards”
Select the cards and press okay and this is saved as part of user personalization.
When “Reset” is clicked, whatever has been defined by the administrator will be applied.
Share Button

This button is available at the top right corner below the head and shoulder button. It gives two options to share, as an email or to save it as tile.
When clinking on ‘Send E-Mail’, an email draft with link to the dashboard will opened in the configured email client. The option ‘Save as Tile’ will create a new tile on the launchpad with the current app state. Please refer to below standard documentation for any references:
https://help.sap.com/doc/saphelp_em92/9.2/en-US/71/a972114577451aa29429183ba9b07f/frameset.htm
Cards
The cards are resizable and can be repositioned. The contents of cards are based on selections made in filter bar.
Test Status Card
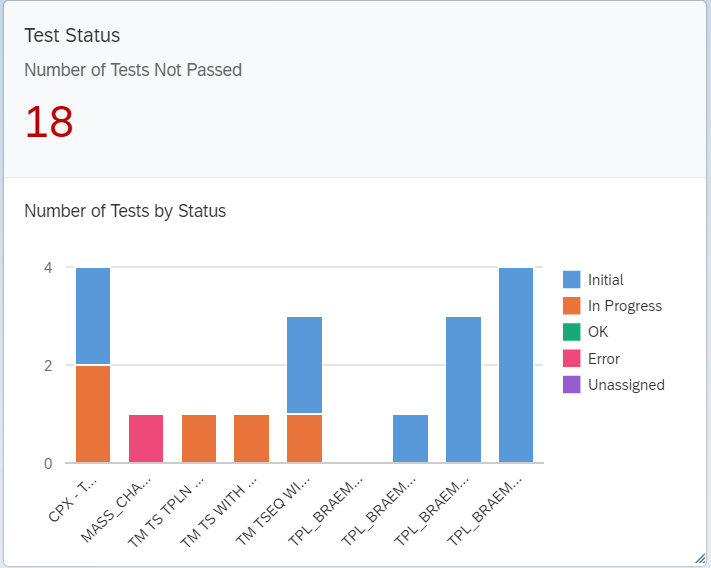
The data point “Number of Test Not Passed” indicated at the top of chart reflects count of test cases that are not in OK status for the test plans selected.
The stacked column chart shows count of test cases and their test status within each selected test plan. The legends describe the status values of test cases.
Test Status Progress
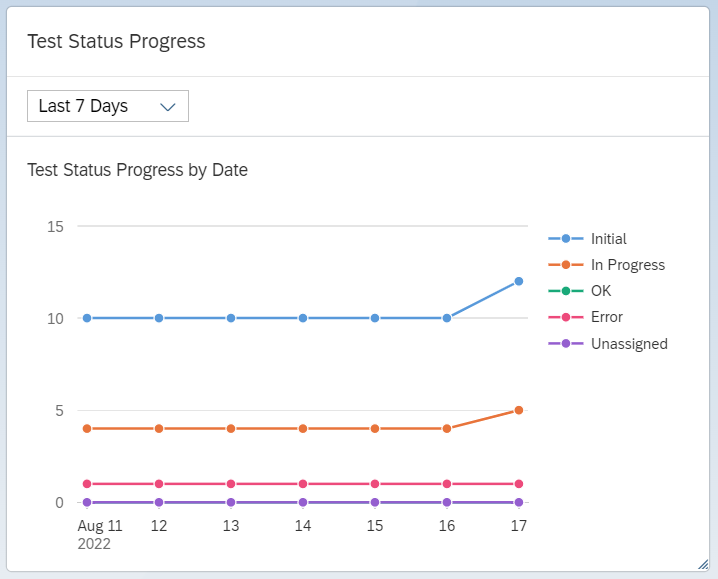
The card shows the count of test cases in different status values over the span of 7days/30 days/60 days/90 days. The timeframe could be changed with the dropdown.
The legends describe the status values of test cases.
Defect Status
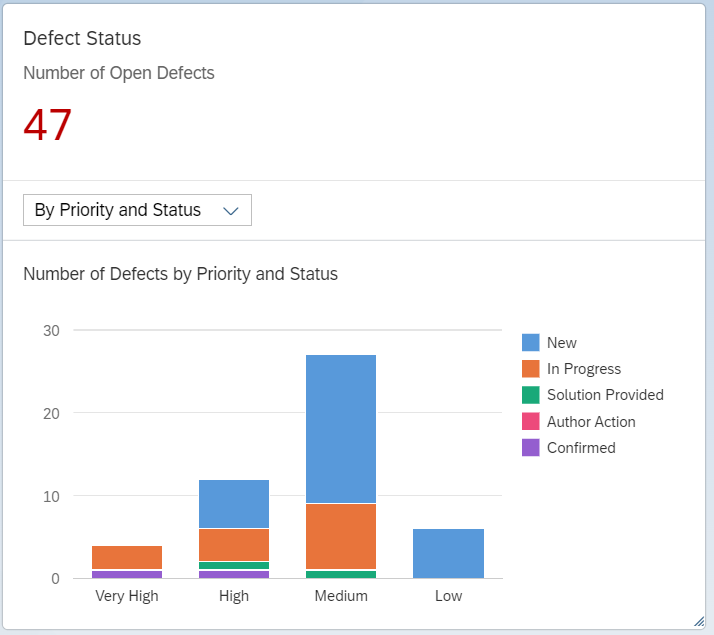
There are two modes in this card:
- Count of Defects based on Priority
- Count of Defects based on Priority and Status
The data point “Number of Open Defects” shown at the top of card shows the count of defect which are not confirmed. The legends describe the status values of defects
Defect Status Progress

The card shows the count of defects in different status values over the span of 7days/30 days/60 days/90 days. The timeframe could be changed with the dropdown. The legends describe the status values of defects.
Critical Test Executions

The value “6 of 41” in the top right corner of the view to indicate the ‘Number of Test Cases displayed (n)’ vs ‘Total Number of Test Cases (m)’.
This card contains a list of all test cases in an error state. The status displayed against each test cases is detailed test status. The test cases are sorted by priority and number of defects in descending order respectively.
Critical Defects
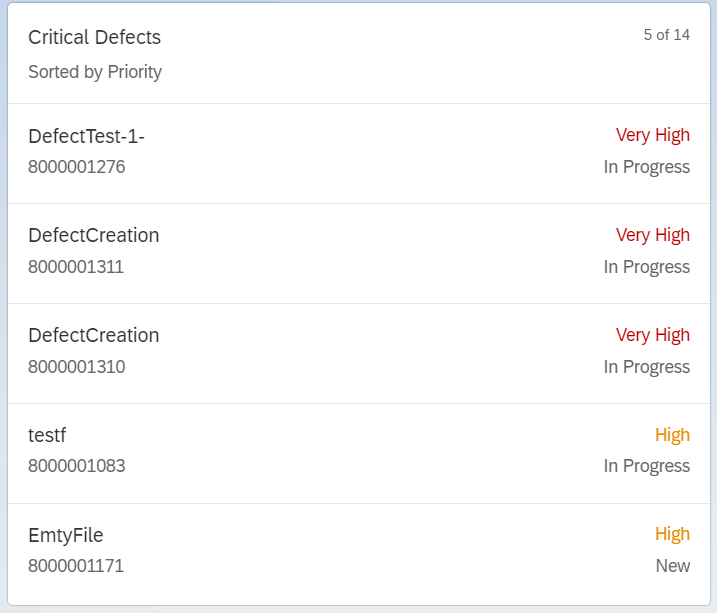
The value “6 of 47” in the top right corner of the view to indicate the ‘Number of Defects displayed (n)’ vs ‘Total Number of Defects (m)’.
This card contains list of all defects with priority “Very High” & “High”. Defect description and status is also shown.
Defects with confirmed status are not included. The list is sorted by priority and processing time in descending order respectively.
Test Steps Progress Monitor

The test steps are sorted by status and completion percentage. The open defects are displayed below the status.
The test steps are sorted based on execution status in descending order and then ranked by steps completion in percentage in ascending order.
There indicator below each test case suggests the completion(x/y) where x = “total number of steps” and “y = executed steps”.
The value “5 of 1611” in the top right corner of the view to indicate the ‘Number of Test Step-Test Case displayed (n)’ vs ‘Total Number of Test Step-Test Case (m)’.
Work Package Test Case Assignment
This card is only available in Focused Build mode. Its content is based only on project and wave filter.
This stacked column chart shows the count of work packages in different status values (obtained from customizing) which have test case assigned and without any test case assignment. The view of the card can be switched between total number and percentage using the dropdown on the card.
Reference Table
| Cards | Type of Card | Customizing Needed | Navigation Enabled |
| Test Status | Analytical Card | N/A | Yes |
| Defect Status | Analytical Card | Yes, Defect Aggregation Status Customizing should be maintained | Yes |
| Test Status Progress | Analytical Card | N/A | Yes |
| Defect Status Progress | Analytical Card | Yes, Defect Aggregation Status Customizing should be maintained | Yes |
| Critical Test Executions | List Card | N/A | Yes |
| Critical Defects | List Card | Yes, Defect Aggregation Status Customizing should be maintained | Yes |
| Test Steps Progress Monitor | List Card | N/A | Yes |
| Work Package Test Case Assignment (Available only in Focused Build Mode) | Analytical Card | Yes, Work Package Status Values for Test Preparation Tile Customizing should be maintained | Yes |
Needed Customizing
- For the Work Package Test Case Assignment Card, the status values displayed, and their order of display is taken from the customizing “Work Package Status Values for Test Preparation Tile”
- “Define Defect Status Aggregation Customizing” should also be defined for proper data display on defect related cards and detail pages.
Key Takeaways
- There are seven overview cards in the test suite mode and eight cards in focused build mode.
- The cards have navigation enabled to a detail page.
- The content of the cards is based on the filters selected in the filter bar.
- Test managers can create and save views using the variant management feature of the dashboard.
Next Blogs
In the forthcoming blog of this series, I’ll discuss about the Analytical List Page based detail pages of the dashboard.
Please feel free to provide feedback either directly here in the comment section or, in case of questions, you can submit them here. You are also encouraged to follow SAP Solution Manager tag here and Focused Build for SAP Solution Manager tag here.
Important Links and Resources
- Usage Rights
- SP10 delta presentation to get an overview of the changes and read the highlights blog
- Read how SAP Activate and Focused Build with SAP Solution Manager is working together
- ALM Community page
- SAP Managed Tags:
- Focused Build for SAP Solution Manager
Labels:
2 Comments
You must be a registered user to add a comment. If you've already registered, sign in. Otherwise, register and sign in.
Labels in this area
-
ABAP CDS Views - CDC (Change Data Capture)
2 -
AI
1 -
Analyze Workload Data
1 -
BTP
1 -
Business and IT Integration
2 -
Business application stu
1 -
Business Technology Platform
1 -
Business Trends
1,658 -
Business Trends
93 -
CAP
1 -
cf
1 -
Cloud Foundry
1 -
Confluent
1 -
Customer COE Basics and Fundamentals
1 -
Customer COE Latest and Greatest
3 -
Customer Data Browser app
1 -
Data Analysis Tool
1 -
data migration
1 -
data transfer
1 -
Datasphere
2 -
Event Information
1,400 -
Event Information
66 -
Expert
1 -
Expert Insights
177 -
Expert Insights
299 -
General
1 -
Google cloud
1 -
Google Next'24
1 -
Kafka
1 -
Life at SAP
780 -
Life at SAP
13 -
Migrate your Data App
1 -
MTA
1 -
Network Performance Analysis
1 -
NodeJS
1 -
PDF
1 -
POC
1 -
Product Updates
4,577 -
Product Updates
344 -
Replication Flow
1 -
RisewithSAP
1 -
SAP BTP
1 -
SAP BTP Cloud Foundry
1 -
SAP Cloud ALM
1 -
SAP Cloud Application Programming Model
1 -
SAP Datasphere
2 -
SAP S4HANA Cloud
1 -
SAP S4HANA Migration Cockpit
1 -
Technology Updates
6,873 -
Technology Updates
422 -
Workload Fluctuations
1
Related Content
- Join and innovate with the SAP Enterprise Support Advisory Council (ESAC) Program in Technology Blogs by SAP
- Setup of Synthetic User Monitoring in SAP Cloud ALM in Technology Blogs by Members
- Configuration: SAP Ariba SSO with SAP Cloud Identity Services - Identity Authentication in Technology Blogs by SAP
- SAP BTP SDK for iOS 24.4.0 is now available in Technology Blogs by SAP
- SAP BTP SDK for Android 24.4.0 is now available in Technology Blogs by SAP
Top kudoed authors
| User | Count |
|---|---|
| 39 | |
| 25 | |
| 17 | |
| 13 | |
| 7 | |
| 7 | |
| 7 | |
| 7 | |
| 6 | |
| 6 |