
- SAP Community
- Products and Technology
- CRM and Customer Experience
- CRM and CX Blogs by Members
- Intelligent Sales Execution in SAP Cloud for Custo...
CRM and CX Blogs by Members
Find insights on SAP customer relationship management and customer experience products in blog posts from community members. Post your own perspective today!
Turn on suggestions
Auto-suggest helps you quickly narrow down your search results by suggesting possible matches as you type.
Showing results for
abimanyu_g
Participant
Options
- Subscribe to RSS Feed
- Mark as New
- Mark as Read
- Bookmark
- Subscribe
- Printer Friendly Page
- Report Inappropriate Content
08-16-2022
9:32 AM
Hello everyone!
This blog post focuses on the SAP Cloud for Customer Intelligent Sales Execution
Intelligent Sales Execution also called as ISE aggregates your opportunity data and allows you to filter and view it in various ways.
As a sales manager/sales representative, you can see how the opportunities are progressing at the specified period for your sales unit/sales department.
Prerequisite for ISE:
1. SAP Cloud for Customer Enterprise version.
2. SAP Sales and Service Core, intelligent sales add-on licenses.
3. ISE Scoping.
To enable ISE in SAP C4C, Business Configuration -> Implementation Projects -> Edit Project Scope -> Questions -> Communication and Information Exchange -> Integration with External Applications and Solutions -> Integration Scenarios with Cloud Solutions from SAP -> Do you want to use Intelligent Sales Execution in your cloud solution?
4. Fiscal Year configuration.
To enable Fiscal Year in SAP C4C, Business Configuration -> Implementation Projects -> Open Activity List -> Fine Tune -> Enable Reporting on Fiscal Year.
5. Machine Learning activation (Optional).
Intelligent Sales Execution can be use with/without Machine Learning in C4C.

Reference Links:
Forecast Category:
We have a standard field called Forecast Category in opportunity screen. It has three types,
- Pipeline -> Opportunities that aren’t expected to close in the current fiscal period
- Best Case -> Opportunities that may become closed-won
- Committed -> Opportunities that are certain to become closed-won
This category will be used in all the modules of ISE.
Admin can create a workflow to update this field automatically on basis of custom logics.
Sub Modules:
ISE feature has four sub-modules:
- Pipeline Manager,
- Pipeline Flow,
- Forecast Tracker,
- Trend Analytics.
All the modules can work without Machine Learning.
Pipeline Manager:
This module helps you to visualize opportunities which are currently available (Open/In-process) in the system for a selected fiscal period. It will display in a Bubble chart.
Pipeline Manager can use Probability/Opportunity Scoring. We have to set this in ISE Administration under Intelligent Sales Execution WorkCentre.
- If a system having an historical real time opportunity record, we can use Opportunity Scoring.
- If it is a new system, then we can use the Opportunity Probability.
Pipeline Manager has two types of charts.
- Bubble Chart
- Bar-Combination Chart
Bubble Categories:
- Green bubble represents, Opportunity with high probability. (Which may win)
- Yellow bubble represents, Opportunity with medium probability. (Which may win/lose)
- Red bubble represents, Opportunity with low probability. (Which may lose)
 Bubble Chart
If any large red bubbles appear in the chart, as a sales manager you probably want to investigate it. Why do these opportunities have such poor performance? How to get them back on track? Like that.
Click on a bubble for a quick view. It will provide all the details of the opportunity.
 Quick-View
Bar-Combination:
This chart will be visible only for Year and Quarter fiscal periods (not for month).
By selecting "Won Last Year" in the legend we can see the value of the opportunities that were won during the same time in the previous year.
 Bar-Combination Chart
At the top we can see some categories. That is a total of each category in a selected fiscal period.
- Won -> Sum of Won Opportunity
- Committed -> Sum of Committed and Won Opportunity
- Best-case -> Sum of Committed, Best-case and Won Opportunity
- Pipeline -> Sum of all Open/In process Opportunity in (includes Best-case and Committed)
At the below, you can check the opportunity in detailed list.
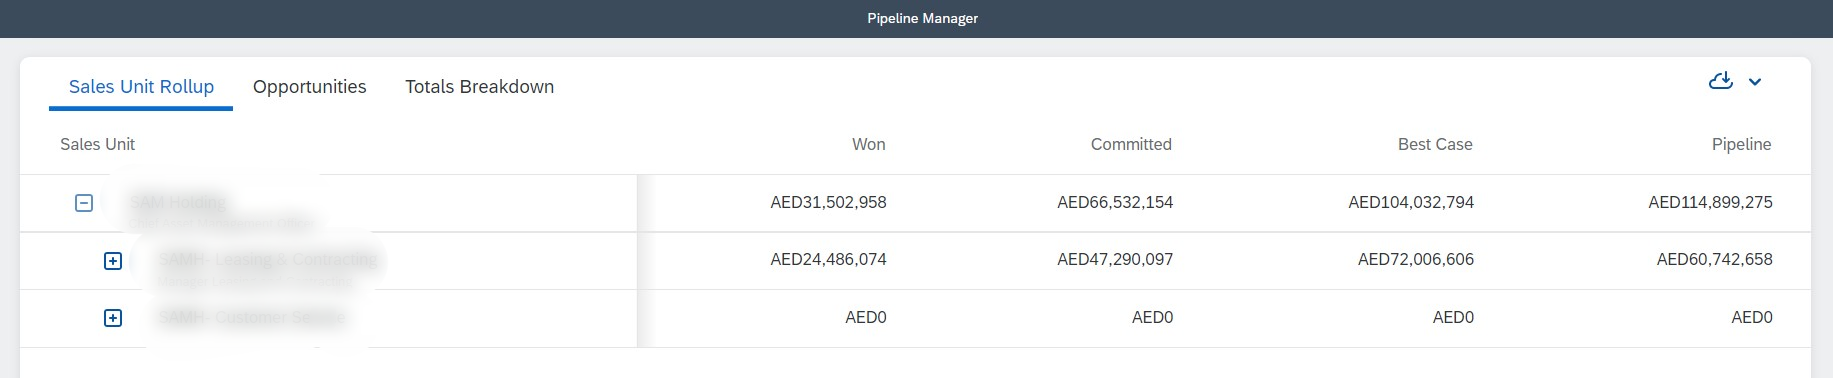 Sales Unit Rollup
 Opportunity list view
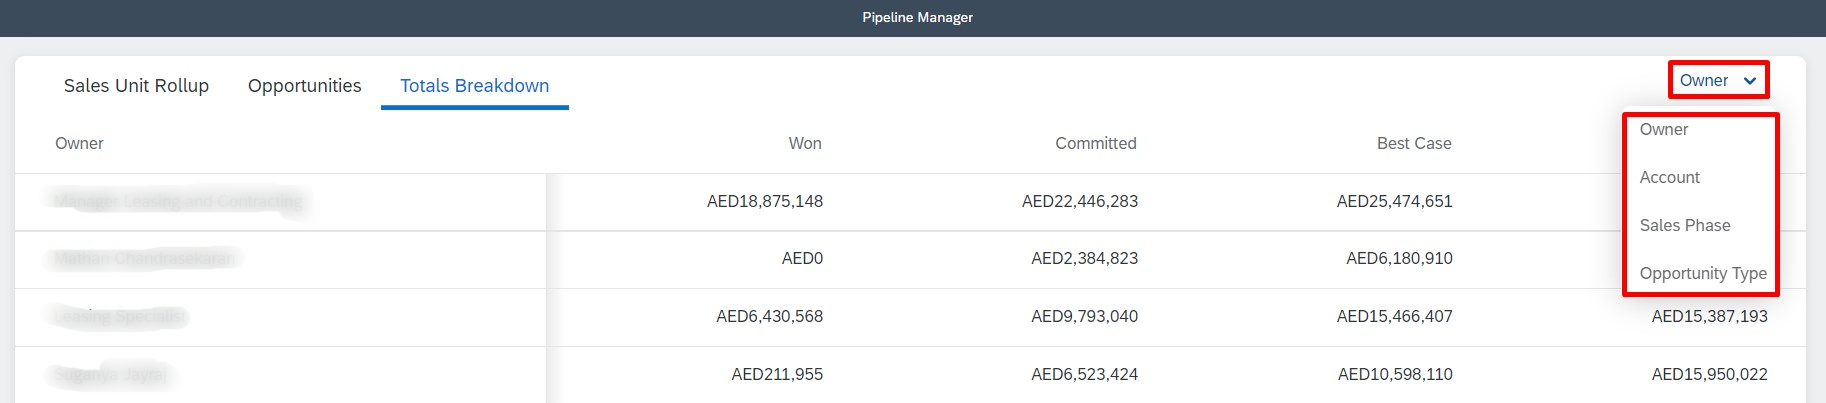 Total Breakdown will show the opportunity value by its Owner, Account, Phase and Type
Pipeline Flow:
This module provides you with real-time insights into how your opportunity pipeline evolves over time and it displays in a visual representation as bucket chart.
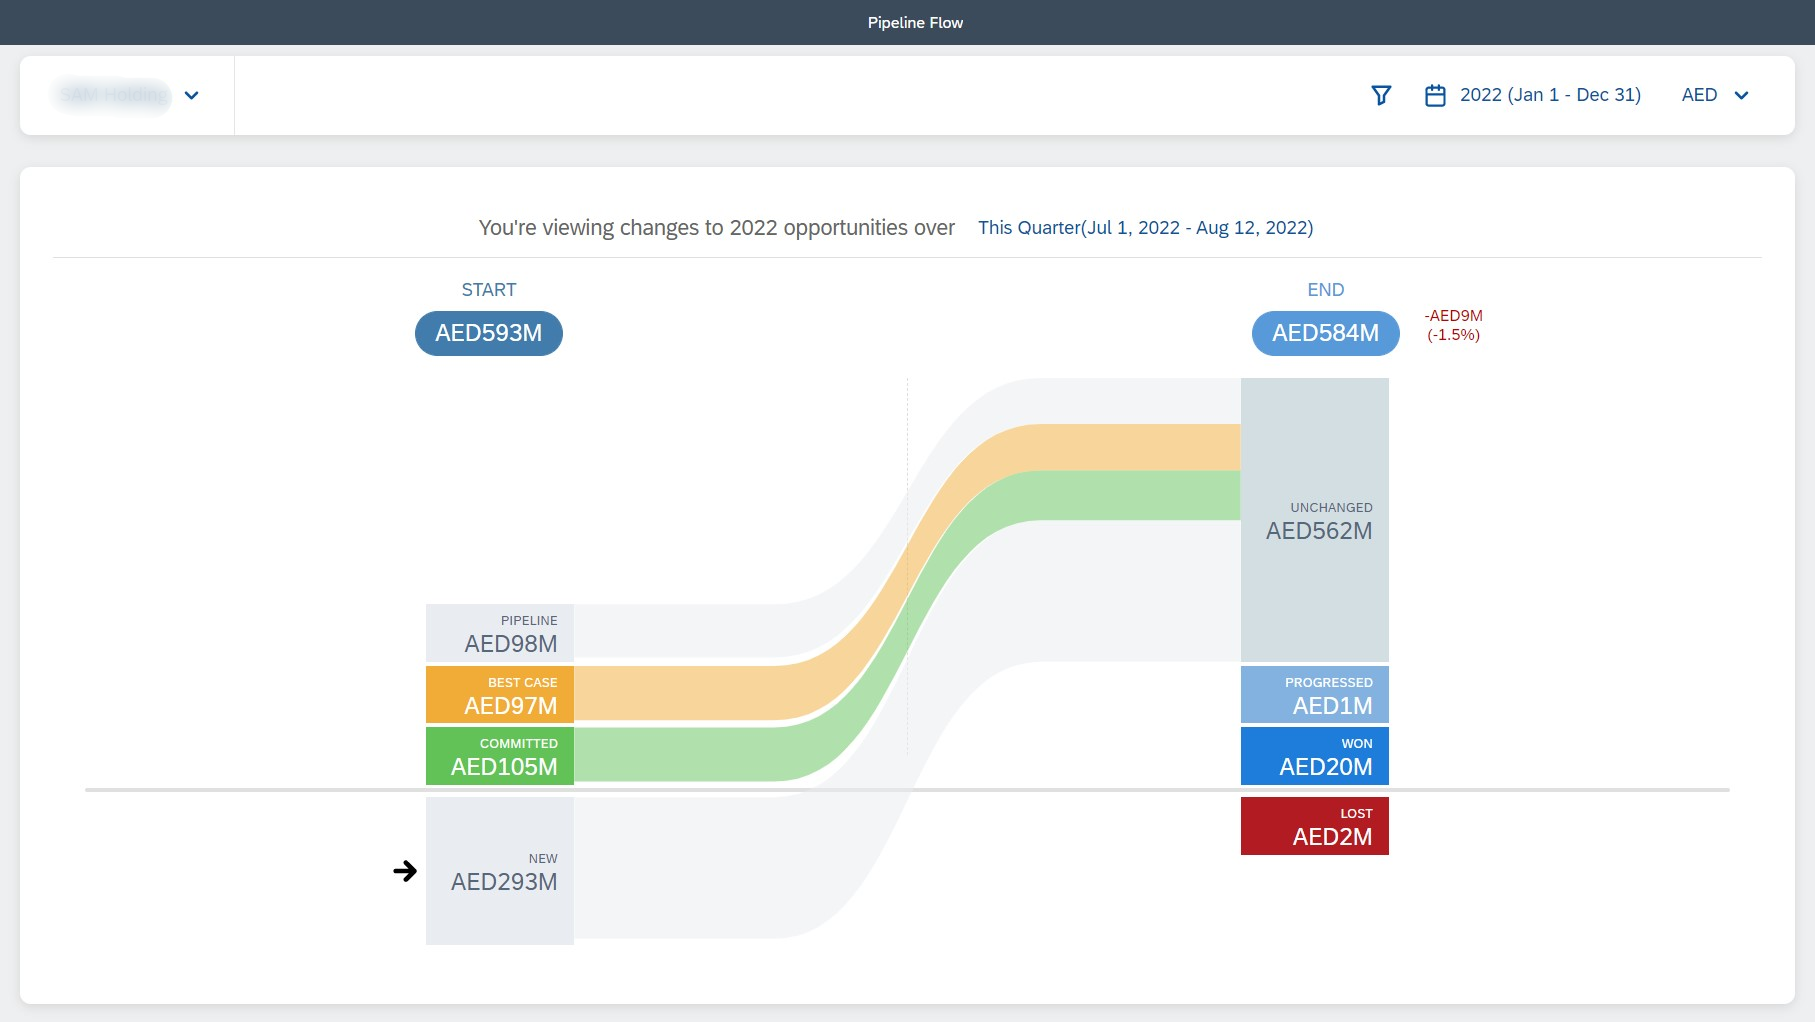 Bucket Chart
- Start column: Represents opportunities at the beginning of the selected fiscal period, and divides them into "buckets", for example committed, best case, and pipeline.
- End column: Represents opportunities at the end of the selected fiscal period, and divides them into status buckets, such as unchanged, progressed, won, or lost.
- The value in each bucket equals to the sum of opportunity values in each corresponding category.
- Above the horizontal line shows opportunities that are already in your pipeline at the beginning of the selected fiscal period. That is opportunities from last fiscal period.
- Below the dividing line, you can see opportunities that are created newly in a selected fiscal period.
- When you select a bucket in either column, the solution will display connectors from Start to End.
Bucket Category:
- New -> A newly created opportunity during the selected fiscal period.
- Unchanged -> Opportunities that haven't changed throughout the given fiscal period.
- Pipeline, Best Case, Committed -> Unchanged opportunities from the previous fiscal period will be separated into categories and appear in the following fiscal period.
- Pushed Out: An opportunity that was created during a particular fiscal period, but its close date was changed by the salesperson.
- Pulled In -> Opportunity from a previous fiscal period that was Pushed Out will show in the current fiscal quarter.
- Won -> Opportunity that are won during the chosen fiscal period.
- Lost -> Opportunity that are lost during the chosen fiscal period.
- Progressed -> Opportunities where forecast category has improved.
- Regressed -> Opportunities where forecast category has deteriorated.
- Omitted -> Opportunities where status is stopped.
Below the chart, you can check the opportunity and sales unit detail.
 Sales Unit Rollup will show amount of each Bucket category achieved by the sales unit
 Opportunity list view of selected Bucket
Forecast Tracker:
Forecast Tracker helps a Sales Manager to see how the Committed and Best-Case opportunities total are increasing over the selected fiscal period.
 Forecast Tracker - Sales Manager View
First as a Sales Manager, you can set a Target for each Sales Units for different time period.
At the end of fiscal period, sales unit has to submit their current forecast. And then a manager can see whether the Sales Unit has achieved the target amount set by him or not.
- The Purple line indicates the target amount set by the Sales Manager.
- The Green dot indicate the Committed opportunity total over the period.
- The Yellow dot indicate the Best-Case opportunity total over the period.
Below we can check the percentage of Won, Committed, Best Case achieved by the sub sales units if Target is set to them.
 Sales Unit Rollup
Trend Analytics:
Trend analytics helps you to visually compare the progress of the current quarter against the progress in previous quarters.
As a Sales Manager you can understand if your sales team is generating more or fewer opportunities this quarter than the last four quarters.
Understand whether your team's success rates are increasing or decreasing over a period of time.
Images will upload later
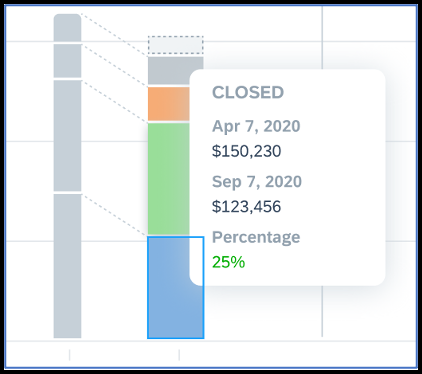
You can also hover over a section on the trend analytics chart to see the numbers behind the visual representation.
For example, if you hover over a commit bucket for Q2 2020, you see how much was in commit at this time and how much of that was closed successfully
Below the visual charts, we can see the summary of opportunity details in a quarter view with success percentage of each category.
 Trend Analytics Summary
Note: All of the above screenshots are taken from sandbox tenant are just for examples. Some might not show a perfect value. And I will update some content in this blog in future.
My Other Blogs:
- Rules and Validations in SAP C4C
- Enhancing Form of Standard Business Objects
- Adding Local Image to C4C Workflow E-mail Template
I hope that this blog post has given you some insight into SAP C4C Intelligent Sales Execution. Kindly like and follow to get more detailed blogs.
Thanks for reading and kindly share with your circle. Feel free to provide your feedback or questions regarding the content in the comment section.
See You Soon 👋🏻,
Abimanyu G
- SAP Managed Tags:
- SAP Sales Cloud,
- SAP Intelligent Sales Execution
3 Comments
You must be a registered user to add a comment. If you've already registered, sign in. Otherwise, register and sign in.
Labels in this area
-
ABAP
1 -
API Rules
1 -
c4c
1 -
CRM
1 -
Custom Key Metrics
1 -
Customer Data
1 -
Determination
1 -
Determinations
1 -
Introduction
1 -
KYMA
1 -
Kyma Functions
1 -
open SAP
1 -
Sales and Service Cloud Version 2
1 -
Sales Cloud
1 -
Sales Cloud v2
1 -
SAP
1 -
SAP Community
1 -
SAP CPQ
1 -
SAP CRM Web UI
1 -
SAP Customer Data Cloud
1 -
SAP Customer Experience
1 -
SAP Integration Suite
1 -
SAP Sales Cloud v2
1 -
SAP Service Cloud v2
1 -
SAP Service Cloud Version 2
1 -
Service Cloud v2
1 -
Validation
1 -
Validations
1
Related Content
- Working with SAFe Epics in the SAP Activate Discover phase in CRM and CX Blogs by SAP
- SAP Premium Engagement Session 'Accelerate Business Transformation with AI' (May 16, 2024) in CRM and CX Blogs by SAP
- SAP Commerce Cloud Q1 ‘24 Release Highlights in CRM and CX Blogs by SAP
- SAP MaxAttention Workshop 'Accelerate Business Transformation with AI and Data' (May 14-15, 2024) in CRM and CX Blogs by SAP
- Unlock the Power of AI with Intelligent Selling Services for SAP Commerce Cloud in CRM and CX Blogs by SAP
Top kudoed authors
| User | Count |
|---|---|
| 1 | |
| 1 | |
| 1 | |
| 1 | |
| 1 |