
- SAP Community
- Products and Technology
- Technology
- Technology Blogs by SAP
- Maintenance Cost Budgeting & Sustainability Planni...
Technology Blogs by SAP
Learn how to extend and personalize SAP applications. Follow the SAP technology blog for insights into SAP BTP, ABAP, SAP Analytics Cloud, SAP HANA, and more.
Turn on suggestions
Auto-suggest helps you quickly narrow down your search results by suggesting possible matches as you type.
Showing results for
Product and Topic Expert
Options
- Subscribe to RSS Feed
- Mark as New
- Mark as Read
- Bookmark
- Subscribe
- Printer Friendly Page
- Report Inappropriate Content
08-05-2022
1:40 PM
This is our 6th blog post and final part of the blog series about Building Intelligent and Sustainability Scenarios on SAP BTP with AI and Planning by gianluigi.bagnoli, yatsea.li, amagnani, cesare.calabria, stuart.clarke2, dayanand.karalkar2, jacobtan, qsmith which showcases our SAP Partners how to create industry cloud solutions for end-to-end industry-specific business processes that embeds intelligence and sustainability.
In the last blog post written by Yatsea Li, we have learned about how about using SAP BTP and we built a custom app named Sustainable Smart Factory App by embedding intelligence and sustainability into a custom application. We now have a means to monitor and gain insights into the daily operations and maintenance of Bagnoli & Co’s plant.
Next, with the help of SAP Analytics Cloud let us see how to incorporate the Sustainability KPIs and Financial KPIs to have a 360 view of Bagnoli & Co’s plant maintenance, such as the quantitive measurement about reduction of energy consumption, CO2 emission and maintenance cost with sound-based Predictive Maintenance between 2020 and 2021. Furthermore, planning the future maintenance cost and sustainability goal for 2022.
1. Building Models – Different Approaches to accomplishing your needs
There are multiple ways to accomplish building data models in SAC. The most common method is by importing data to help analyze the data and build a model from the data structure that we import. This is great for utilizing for building day to day dashboards and have a breakdown of the data and data hierarchies.
In our approach we had a specific goal in what we wanted to accomplish with the data and what kind of data we needed in order to achieve that. So, in our Maintenance cost planning we want to collect the maintenance cost on doing the repairs and maintenance of the plant which is improved with the predictive maintenance from the previous blogs. We also wanted to add additional calculations we can formulate using the specific data points. The maintenance cost planning we bring in all the cost associated to helping maintain the plant for maintenance. For our Sustainability data we want to use our transaction data to help us formulate calculations so we can have a measure to view how we are doing in reducing our CO2, how we are using our energy, and what breakdown each product has and impact it has on our sustainability in the plant.
Above we can see the design of the data we and we will break it down. This approach is quite interesting. For the master data common between the model, we populate into our public dimensions, which allows us to only have to import the data once vs multiple times and then reuse the public dimensions in our different models. The transactions data we will import directly to our models. With this way that we have predefined our models with dimensions we can build the exact fields we need and populate from different transaction data from our Bagnoli & Co. SAP S/4HANA Cloud. Finally, we define calculations that formulate directly in the models allowing us to use different measures defined built new measures like energy consumption by product.
By using this approach, we define and build our models first with measure and dimension and after we populate the models. Below is breakdown of how we define our data structure:
Public Dimensions
Maintenance Cost Planning Model
Figure A Figure B
Sustainability Planning Model
Figure C Figure D
Now we have defined our data models for both our Maintenance Cost Planning and Sustainability Planning and ready to populate the data and ready to build our user interface for Bagnoli & Co’s Sustainable Smart Factory to give us the insight and analysis into data of our plant. To give full guide how to build and create your models, please visit btp-ai-sustainability-bootcamp/EP320_Exercise01_Creating_Public _Dimension_Models.pdf at main · SAP-...
2. Populating our Models – how to map the data to models we build for specific requirements
In SAC, we have four types of modeling:
In our business scenario, we built two new models: one model for maintenance cost budget planning and the other for sustainability planning. Both models contain by default the two dimensions: date and version.
We also did set both model preferences for features such as security, auditing, and currency conversion.
Based on our business process flow, where the Data Preparation has already occurred by creating the necessary planning data models for our use case scenario.
the Business Administrator is usually responsible for such process step.
In the second part of this process step, we will learn the different configuration steps required to integrate SAP S/4HANA Cloud with SAP Analytics Cloud.
After the integration is configured successfully, we will also see the importing and acquiring of the master & transactional data in our previously created models.
With SAP Analytics Cloud, you can either connect to a live data source OR simply acquire data. It is important to mention that Planning models do require a local persistence of data. Integration jobs can also be managed & scheduled within the Data Management feature of a model.
In our business scenario, we can configure SAP S/4HANA Cloud for the integration of the Plant Maintenance - Master Data with the SAP Cloud Analytics as per the following steps:
Afterwards on SAP Analytics Cloud side, use the Acquire Data Connection option of type S/4HANA,

When it comes to the integration of the transactional data, we can configure SAP S/4HANA Cloud for importing Maintenance Order Data (that’s a transactional data) using a different connection option as per the following steps:
Afterwards on SAP Analytics side, use the Acquire Data Connection option of type ODATA Services:
In general, you can import master data from an external data source into a public dimension. In this case dimensions and their attributes can be imported such as:
When you create a model by importing data, dimensions are created from the imported data. But when you create a new blank model, you add dimensions manually and that’s we are doing based on our use case.
Hence in our use case, we create a Public Dimension called “Demo Equipment”, in which we could upload the master data of our Equipment’s using the connection that we did configure earlier with our Bagnoli & Co. SAP S/4HANA Cloud tenant.
Initially in the Equipment master data, we don’t have yet any members manually created. Using the Data Management option, so that we can import data based on a data source based on our SAP S/4HANA Cloud tenant, where we can select the connection which we did configure earlier in the previous step.
Figure M
During the import, we can create a new query where we can simply search for the APIs that are available for the Equipment KPIs. Afterwards we choose the API called “Equipment” where we can import the following properties:
At the end, the system imports the data and shows the mapping as shown above. The imported columns are to be mapped to the corresponding fields, where you need to confirm the Mapping for the system to provide the confirmation of the import job.
Similarly, we can also upload the data for our model from the SAP S/4HANA Cloud Maintenance Cost using the OData service that was created based on Custom CDS view in SAP S/4HANA Cloud.
The process to import data differs depending on your model type, the data source, and the platform you are working on. Well! In our use case, the data source to import data from is our data source - SAP S/4HANA Cloud tenant.
The import step will be applied to our two planning models:
With the help of the Data Management option (Figure M), we can simply select the option to import data from a data source, after then we can simply begin setting up the import.
During the data preparation step, we can simply use the feature - “Map to Target” to apply the data mapping for our pre-defined dimension.
In some case, the source columns are mapped to their corresponding dimensions by default.
At the end, all the columns from the source shall be mapped to the target model.
3. Power of BI – Building a Story and interface for Maintenance Cost Planning
In this phase of our business planning use case’s process flow, we will see how the maintenance planner as well the cost centre owner can build the analytical story of the maintenance cost budget planning.
In addition, the sustainability planner would prepare & configure the prediction scenario for energy rates, and finally create the corresponding analytical story of the sustainability planning.
It is based on the maintenance cost budgeting model which we built earlier.
As we know, in 2020 the organization has implemented Cyclic Maintenance, whilst in 2021 they have maintained a predictive maintenance approach.
Well! our story has got three main pages as the following:

4. Predicative Planning – Utilize the power of the data for Sustainability Planning
Now it’s time for the system do some of the heavy lifting for us. We will utilize our model for sustainability to run predictive scenario using the built in AI/ML to help us generate a planning model using the historical data to analysis and create a prediction for future periods to come. With this we can use the power of the data to help us look into the future. Using the predicative we able to analysis a great deal of the historical data to review the trends that happen, detect outliers in the data that might skew our data, and combing with the ability of machine learning allow the system to adjust with new data over period.
Let’s start having an overview of how we will use Analytics cloud for our Predictive planning scenario.
We can see in our diagram above we have already created and mapped our historical data in our Sustainability planning model. Next, we will build a predictive scenario that we can use our base to create a planning story for our sustainability. By training the model with the historical data it will breakdown the key influences and generate a future prediction based on the data
After reviewal, if cost-center owner is satisfied with the 2022 budget that was created, s/he can simply copy either the predictive maintenance or cyclic maintenance plan into the budget plan to finalize it, in such case the plan data version, and then create a forecast for the production quantities in the sustainability planning.
Also, thanks to the smart factory application, we can monitor the data of the CO2 emissions & energy consumptions per equipment for the end-users to have a look at how exactly the plan is generated based on Cyclic as well based on Predictive maintenance for the energy consumption & CO2 emissions.
In case, the user would like to introduce a new equipment to increase the productivity and plan against that equipment, s/he can also use the option of creating a new equipment in our story.
It is based on the sustainability planning model which we built earlier.
In fact, one of the most important KPIs in sustainability planning is to plan the energy cost based on the Energy Consumption in KWH as well the planned energy rates.
Well! our story has got three main pages as the following:
The Smart Factory application provides us the energy consumption and C02 emission per equipment. Thus, we have loaded that data into the maintenance planning model and created a maintenance plan accordingly. Hence the sustainability planner will need to get that plan and look at the impact of that plan on sustainability KPIs. Also, the sustainability planner will plan the production based on the historical data;
By using the predictive scenario, we will generate a prediction for energy rate. With this we can measure how we are consuming energy in the plant. Companies all over the world is looking through the top to the bottom of their organization to become more sustainable. Sustainability has expanded from just being recycling, reducing waste and being green. We want to reduce the plant energy cost and by predicating how much energy we will use and how much each product uses. We can now plan better for our production in the plant. We can now reduce and conserve more energy in our operations which end of the day reduce cost, reduce waste, and reduce our energy demand. Couple with the predictive maintenance we can ensure of running at optimal capacity and we can analysis how we measure using our predictive scenario.
Here we can see we are now training our predictive scenario with the sustainability model. In this prediction we are using it to predict our energy rate, so we have selected that as our target. As we are using a time series, we will need to will need to select our date field in the model and we will run this against the company code as our entity which will give us prediction based on each company code. This way we can run it same time for multiple companies that apply. We also will use the historical data to predict the next 12 months for us to use in our planning.
We now can build our interface using the actual data and planned data. What’s interesting here is we use the multi action and incorporate it into our story as well. Now as we get more data, we can use the multi action to refresh the data from our S/4 back end and have the system recalculate the energy rate. This way if there is an have increase in production for a period or you have bought new equipment that’s more efficient, with the trigger we can automatically have our story update to reflect the changes happening in our plant. This way we can have more accurate prediction and track of actual data and have our report be fresh each time we review it.
The power of the multi action gives us great flexibly in allowing us to add actions to our story page and allow the user more control in their view of the data. This multi action has lot of functionality from updating the prediction, refreshing data, to incorporating our data actions and allows multiple things to happen in the order we design and allows us to complete multiple steps with one action now. This is great asset and can see in our sustainability planning how that gives us the ability to adjust with the plant without having to spend hours redoing the work in SAC each time.
We can review the steps on how we incorporate and use our prediction scenario by following along the guide here: btp-ai-sustainability-bootcamp/EP320_Exercise04_Sustainability_Planning_Story.pdf at main · SAP-samp....
5. Summary
Throughout this sample, we see how to incorporate sustainability KPIs(Energy Consumption and CO2 Emission) together with financial KPIs(Maintenance Cost) into Bagnoli & Co for comprehensive corporate performance management, and end-to-end planning for maintenance cost and sustainability for Bagnoli & Co with SAP Analytics Cloud for Planning.
As a conclusion of the blog post series about building intelligent and sustainability scenario on SAP BTP, here are all the episodes:
In the last blog post written by Yatsea Li, we have learned about how about using SAP BTP and we built a custom app named Sustainable Smart Factory App by embedding intelligence and sustainability into a custom application. We now have a means to monitor and gain insights into the daily operations and maintenance of Bagnoli & Co’s plant.
Next, with the help of SAP Analytics Cloud let us see how to incorporate the Sustainability KPIs and Financial KPIs to have a 360 view of Bagnoli & Co’s plant maintenance, such as the quantitive measurement about reduction of energy consumption, CO2 emission and maintenance cost with sound-based Predictive Maintenance between 2020 and 2021. Furthermore, planning the future maintenance cost and sustainability goal for 2022.

1. Building Models – Different Approaches to accomplishing your needs
There are multiple ways to accomplish building data models in SAC. The most common method is by importing data to help analyze the data and build a model from the data structure that we import. This is great for utilizing for building day to day dashboards and have a breakdown of the data and data hierarchies.
In our approach we had a specific goal in what we wanted to accomplish with the data and what kind of data we needed in order to achieve that. So, in our Maintenance cost planning we want to collect the maintenance cost on doing the repairs and maintenance of the plant which is improved with the predictive maintenance from the previous blogs. We also wanted to add additional calculations we can formulate using the specific data points. The maintenance cost planning we bring in all the cost associated to helping maintain the plant for maintenance. For our Sustainability data we want to use our transaction data to help us formulate calculations so we can have a measure to view how we are doing in reducing our CO2, how we are using our energy, and what breakdown each product has and impact it has on our sustainability in the plant.

Above we can see the design of the data we and we will break it down. This approach is quite interesting. For the master data common between the model, we populate into our public dimensions, which allows us to only have to import the data once vs multiple times and then reuse the public dimensions in our different models. The transactions data we will import directly to our models. With this way that we have predefined our models with dimensions we can build the exact fields we need and populate from different transaction data from our Bagnoli & Co. SAP S/4HANA Cloud. Finally, we define calculations that formulate directly in the models allowing us to use different measures defined built new measures like energy consumption by product.
By using this approach, we define and build our models first with measure and dimension and after we populate the models. Below is breakdown of how we define our data structure:
Public Dimensions
- Company Code
- Functional Location
- Equipment
- Cost Center
- Maintenance Category
- Plant
Maintenance Cost Planning Model
 |  |
Figure A Figure B
- Transaction Data (Figure A)
- Maintenance Cost LC
- Energy Consumption
- CO2 Emission
- Training Cost
- Travel Cost
- Total Maintenance Cost
- Calculations (Figure B)
- Training Cost per
- Travel Cost per
- Total Overhead Cost LC
Sustainability Planning Model
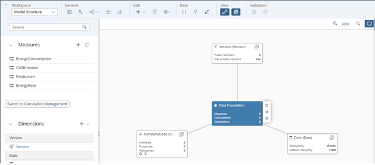 |  |
Figure C Figure D
- Transaction Data (Figure C)
- Energy Consumptions
- Co2 Emissions
- Production
- Energy rate
- Calculations (Figure D)
- Energy Cost
- Energy Consumption per Product
- Co2 Emission Per Product
Now we have defined our data models for both our Maintenance Cost Planning and Sustainability Planning and ready to populate the data and ready to build our user interface for Bagnoli & Co’s Sustainable Smart Factory to give us the insight and analysis into data of our plant. To give full guide how to build and create your models, please visit btp-ai-sustainability-bootcamp/EP320_Exercise01_Creating_Public _Dimension_Models.pdf at main · SAP-...
2. Populating our Models – how to map the data to models we build for specific requirements
In SAC, we have four types of modeling:
- Live Models
- Data is stored in the source system, not in SAP Analytics Cloud
- Data changes in the source data are available in real time
- Acquired Models
- Data is imported & stored in SAP Analytics Cloud
- Data changes in the source system doesn’t affect the imported data
- Analytical Models
- Used to analyze trends and anomalies
- Possible with Live & acquired data connections
- Planning Models
- Prepared & configured to perform business planning tasks
- Require data to be acquired in SAP Analytics Cloud
In our business scenario, we built two new models: one model for maintenance cost budget planning and the other for sustainability planning. Both models contain by default the two dimensions: date and version.
We also did set both model preferences for features such as security, auditing, and currency conversion.
Based on our business process flow, where the Data Preparation has already occurred by creating the necessary planning data models for our use case scenario.
the Business Administrator is usually responsible for such process step.
In the second part of this process step, we will learn the different configuration steps required to integrate SAP S/4HANA Cloud with SAP Analytics Cloud.
After the integration is configured successfully, we will also see the importing and acquiring of the master & transactional data in our previously created models.
- Data Integrations
With SAP Analytics Cloud, you can either connect to a live data source OR simply acquire data. It is important to mention that Planning models do require a local persistence of data. Integration jobs can also be managed & scheduled within the Data Management feature of a model.

- How to define the data Communication for Master Data
In our business scenario, we can configure SAP S/4HANA Cloud for the integration of the Plant Maintenance - Master Data with the SAP Cloud Analytics as per the following steps:
- First Create a Communication User & communication System in SAP S/4HANA Cloud,
- Then create a communication arrangement using the communication scenario SAP_COM_0395 in SAP S/4HANA Cloud,
Afterwards on SAP Analytics Cloud side, use the Acquire Data Connection option of type S/4HANA,
- Simply provide the target SAP S/4HANA Cloud URL, Communication Username & Password.
- How to define the data Communication for Transaction Data
When it comes to the integration of the transactional data, we can configure SAP S/4HANA Cloud for importing Maintenance Order Data (that’s a transactional data) using a different connection option as per the following steps:
- First create a custom CDS View of type API to get the maintenance order actual cost,
- then create a custom communication scenario based on that custom CDS view,
- finally create a communication arrangement using such custom communication scenario.
Afterwards on SAP Analytics side, use the Acquire Data Connection option of type ODATA Services:
- Simply provide the ODATA URL from the S/4HC communication arrangement, plus the Communication User & Password

- Public Dimensions – Populating our Public Dimensions

In general, you can import master data from an external data source into a public dimension. In this case dimensions and their attributes can be imported such as:
- Descriptions
- Properties
- Parent-child hierarchies
When you create a model by importing data, dimensions are created from the imported data. But when you create a new blank model, you add dimensions manually and that’s we are doing based on our use case.
Hence in our use case, we create a Public Dimension called “Demo Equipment”, in which we could upload the master data of our Equipment’s using the connection that we did configure earlier with our Bagnoli & Co. SAP S/4HANA Cloud tenant.
Initially in the Equipment master data, we don’t have yet any members manually created. Using the Data Management option, so that we can import data based on a data source based on our SAP S/4HANA Cloud tenant, where we can select the connection which we did configure earlier in the previous step.

Figure M
During the import, we can create a new query where we can simply search for the APIs that are available for the Equipment KPIs. Afterwards we choose the API called “Equipment” where we can import the following properties:
- Equipment ID
- Functional Location
- Object Description
At the end, the system imports the data and shows the mapping as shown above. The imported columns are to be mapped to the corresponding fields, where you need to confirm the Mapping for the system to provide the confirmation of the import job.
Similarly, we can also upload the data for our model from the SAP S/4HANA Cloud Maintenance Cost using the OData service that was created based on Custom CDS view in SAP S/4HANA Cloud.
- Populating our Models – Import data into a build model
The process to import data differs depending on your model type, the data source, and the platform you are working on. Well! In our use case, the data source to import data from is our data source - SAP S/4HANA Cloud tenant.
The import step will be applied to our two planning models:
- Maintenance Cost Budgeting
- Sustainability Planning
With the help of the Data Management option (Figure M), we can simply select the option to import data from a data source, after then we can simply begin setting up the import.
- Mapping the data to our defined dimensions
During the data preparation step, we can simply use the feature - “Map to Target” to apply the data mapping for our pre-defined dimension.
In some case, the source columns are mapped to their corresponding dimensions by default.
At the end, all the columns from the source shall be mapped to the target model.
3. Power of BI – Building a Story and interface for Maintenance Cost Planning
In this phase of our business planning use case’s process flow, we will see how the maintenance planner as well the cost centre owner can build the analytical story of the maintenance cost budget planning.
In addition, the sustainability planner would prepare & configure the prediction scenario for energy rates, and finally create the corresponding analytical story of the sustainability planning.
- Maintenance Cost Budget Planning Story
It is based on the maintenance cost budgeting model which we built earlier.
As we know, in 2020 the organization has implemented Cyclic Maintenance, whilst in 2021 they have maintained a predictive maintenance approach.
Well! our story has got three main pages as the following:
- Create maintenance plan – generate proposal
- Table control that shows the measure - maintenance cost local currency based on the version - Actual vs the dimension - date “2020-2022” including a hierarchy in years and months, whilst displaying rows based on the dimensions - functional location, equipment, and maintenance category.
- The table can also display two data versions - Predictive Maintenance & Cyclic Maintenance to simulate the plan cost of each version, thanks to the version management feature of tables controls. In addition, we added another version - Maintenance Plan to store the final maintenance budget, so at the end we will have four public versions.
- Styling features in our table control, where we could display the actuals data as non-editable cells. To achieve this, styling rules were defined to make the actual data as read only and shown as greyed out.
- Selection-options based on story filters of some dimensions, where maintenance planners can plan against their own company code, plant, and functional location, as where they can have a look at their actual data for 2020 & actual data for 2021.
- Data actions for maintenance planners to generate different maintenance plans for 2022 based on the historical data, as follows:
- Create predictive plan: DA to generate 2022 maintenance plan based on predictive maintenance,
- Create cyclic plan: DA to generate 2022 maintenance plan based on cyclic maintenance.
- Adjust the generated maintenance Plan for maintenance cost budgeting
- Table control that shows the measure - maintenance cost local currency vs the date dimension including a hierarchy in years, months, whilst displaying rows based on the following dimensions: functional location, equipment, maintenance category and versions “cyclic maintenance” & “predictive” maintenance.
- Data action for maintenance planners to create 2022 maintenance budget either based on Predictive Maintenance or Cyclic Maintenance.
- Table control to manually adjust the maintenance cost
- Chart to show the comparison between predictive, cyclic and plan versions for 2022.

4. Predicative Planning – Utilize the power of the data for Sustainability Planning
Now it’s time for the system do some of the heavy lifting for us. We will utilize our model for sustainability to run predictive scenario using the built in AI/ML to help us generate a planning model using the historical data to analysis and create a prediction for future periods to come. With this we can use the power of the data to help us look into the future. Using the predicative we able to analysis a great deal of the historical data to review the trends that happen, detect outliers in the data that might skew our data, and combing with the ability of machine learning allow the system to adjust with new data over period.
Let’s start having an overview of how we will use Analytics cloud for our Predictive planning scenario.

We can see in our diagram above we have already created and mapped our historical data in our Sustainability planning model. Next, we will build a predictive scenario that we can use our base to create a planning story for our sustainability. By training the model with the historical data it will breakdown the key influences and generate a future prediction based on the data
- Review the Sustainability Requirements
- Table control to display energy consumptions & CO2 emissions vs the date & versions
- Chart to show the energy consumptions & CO2 emissions for different versions for 2022
After reviewal, if cost-center owner is satisfied with the 2022 budget that was created, s/he can simply copy either the predictive maintenance or cyclic maintenance plan into the budget plan to finalize it, in such case the plan data version, and then create a forecast for the production quantities in the sustainability planning.
Also, thanks to the smart factory application, we can monitor the data of the CO2 emissions & energy consumptions per equipment for the end-users to have a look at how exactly the plan is generated based on Cyclic as well based on Predictive maintenance for the energy consumption & CO2 emissions.
In case, the user would like to introduce a new equipment to increase the productivity and plan against that equipment, s/he can also use the option of creating a new equipment in our story.
- Sustainability Story
It is based on the sustainability planning model which we built earlier.
In fact, one of the most important KPIs in sustainability planning is to plan the energy cost based on the Energy Consumption in KWH as well the planned energy rates.
Well! our story has got three main pages as the following:
- Overview of the Sustainability KPIs
- Bar chart to show the energy consumption in KWH for data version – Actual vs the dimension – Date, along with a hierarchy based on years, quarters, and months.
- This chart has got a variance to compare the change in energy consumption resulted due to predictive maintenance between 2020 & 2021.
- Line chart to show the energy consumption per product for data version – Actual vs the dimension – Date, along with a hierarchy based on years, quarters, and months.
- Column chart for CO2 emission comparison.
- Line chart to show the trend of CO2 emission per product.
- Column chart to compare the production after the implementation of predictive maintenance.
 As we can see above the energy consumption is reducing due to the efficiencies of the machine thanks to the predictive maintenance approach. Plus, the CO2 emission is also reducing in 2021 after performing the predictive maintenance. On the other hand, the production is increasing due to the less frequent breakdowns and the increased efficiency of the machines.
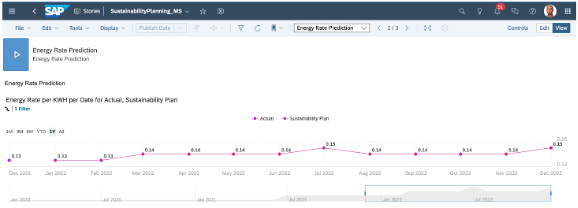
- Energy Rate Prediction
- Using the Table control’s version management feature, we added another version - sustainability plan to store the sustainability planning, so at the end we will have two public versions.
- Time series chart to show the energy rate per KWH for both data versions - Actual & sustainability plan vs the dimension - date, along with a hierarchy based on years, quarters, and months.
- Using the predictive scenario features, we could build a predictive model with the type of a time-series forecast, that’s based on our sustainability planning model. In this model we train the model and forecast the energy rate per KHW for a period of 12 months vs the dimension - date and based on the company’s historical data of energy rates measure.
- Multi-Action trigger to enable end-users to run the predictive scenario forecasting for energy rates in 2022 based on the previously built predictive model.
- Sustainability Planning
The Smart Factory application provides us the energy consumption and C02 emission per equipment. Thus, we have loaded that data into the maintenance planning model and created a maintenance plan accordingly. Hence the sustainability planner will need to get that plan and look at the impact of that plan on sustainability KPIs. Also, the sustainability planner will plan the production based on the historical data;
- Using the Table control’s version management feature, we added another version - sustainability plan to store the sustainability planning, so at the end we will have two public versions.
- Time series chart to show
- Data action to import the energy consumption & co2 emission as well production quantities from maintenance cost planning and create production plan based on such history.
- Value driver tree to provide the key components of sustainability, where the planner can simulate the impact of different components on the sustainability KPIs.
- Table control to display all the sustainability KPIs in a tabular format as well to simulate the change of some KPIs such as the energy rate or the production by some percentage and then analyze the impact on the corresponding measures.

By using the predictive scenario, we will generate a prediction for energy rate. With this we can measure how we are consuming energy in the plant. Companies all over the world is looking through the top to the bottom of their organization to become more sustainable. Sustainability has expanded from just being recycling, reducing waste and being green. We want to reduce the plant energy cost and by predicating how much energy we will use and how much each product uses. We can now plan better for our production in the plant. We can now reduce and conserve more energy in our operations which end of the day reduce cost, reduce waste, and reduce our energy demand. Couple with the predictive maintenance we can ensure of running at optimal capacity and we can analysis how we measure using our predictive scenario.

Here we can see we are now training our predictive scenario with the sustainability model. In this prediction we are using it to predict our energy rate, so we have selected that as our target. As we are using a time series, we will need to will need to select our date field in the model and we will run this against the company code as our entity which will give us prediction based on each company code. This way we can run it same time for multiple companies that apply. We also will use the historical data to predict the next 12 months for us to use in our planning.

We now can build our interface using the actual data and planned data. What’s interesting here is we use the multi action and incorporate it into our story as well. Now as we get more data, we can use the multi action to refresh the data from our S/4 back end and have the system recalculate the energy rate. This way if there is an have increase in production for a period or you have bought new equipment that’s more efficient, with the trigger we can automatically have our story update to reflect the changes happening in our plant. This way we can have more accurate prediction and track of actual data and have our report be fresh each time we review it.
The power of the multi action gives us great flexibly in allowing us to add actions to our story page and allow the user more control in their view of the data. This multi action has lot of functionality from updating the prediction, refreshing data, to incorporating our data actions and allows multiple things to happen in the order we design and allows us to complete multiple steps with one action now. This is great asset and can see in our sustainability planning how that gives us the ability to adjust with the plant without having to spend hours redoing the work in SAC each time.
We can review the steps on how we incorporate and use our prediction scenario by following along the guide here: btp-ai-sustainability-bootcamp/EP320_Exercise04_Sustainability_Planning_Story.pdf at main · SAP-samp....
5. Summary
Throughout this sample, we see how to incorporate sustainability KPIs(Energy Consumption and CO2 Emission) together with financial KPIs(Maintenance Cost) into Bagnoli & Co for comprehensive corporate performance management, and end-to-end planning for maintenance cost and sustainability for Bagnoli & Co with SAP Analytics Cloud for Planning.
As a conclusion of the blog post series about building intelligent and sustainability scenario on SAP BTP, here are all the episodes:
- An overview of sustainability on top of SAP BTP
- Introduction of end-to-end ML ops with SAP AI Core
- BYOM with TensorFlow in SAP AI Core for Defect Detection
- SAP AI Core for sound-based predictive maintenance
- Embedding Intelligence and Sustainability into Custom Applications on SAP BTP
- Maintenance Cost & Sustainability Planning with SAP Analytics Cloud Planning (this blog post)
- SAP Managed Tags:
- SAP Analytics Cloud,
- Data and Analytics,
- SAP AI Core,
- Sustainability
Labels:
You must be a registered user to add a comment. If you've already registered, sign in. Otherwise, register and sign in.
Labels in this area
-
ABAP CDS Views - CDC (Change Data Capture)
2 -
AI
1 -
Analyze Workload Data
1 -
BTP
1 -
Business and IT Integration
2 -
Business application stu
1 -
Business Technology Platform
1 -
Business Trends
1,661 -
Business Trends
87 -
CAP
1 -
cf
1 -
Cloud Foundry
1 -
Confluent
1 -
Customer COE Basics and Fundamentals
1 -
Customer COE Latest and Greatest
3 -
Customer Data Browser app
1 -
Data Analysis Tool
1 -
data migration
1 -
data transfer
1 -
Datasphere
2 -
Event Information
1,400 -
Event Information
64 -
Expert
1 -
Expert Insights
178 -
Expert Insights
273 -
General
1 -
Google cloud
1 -
Google Next'24
1 -
Kafka
1 -
Life at SAP
784 -
Life at SAP
11 -
Migrate your Data App
1 -
MTA
1 -
Network Performance Analysis
1 -
NodeJS
1 -
PDF
1 -
POC
1 -
Product Updates
4,577 -
Product Updates
326 -
Replication Flow
1 -
RisewithSAP
1 -
SAP BTP
1 -
SAP BTP Cloud Foundry
1 -
SAP Cloud ALM
1 -
SAP Cloud Application Programming Model
1 -
SAP Datasphere
2 -
SAP S4HANA Cloud
1 -
SAP S4HANA Migration Cockpit
1 -
Technology Updates
6,886 -
Technology Updates
403 -
Workload Fluctuations
1
Related Content
- It has never been easier to print from SAP with Microsoft Universal Print in Technology Blogs by Members
- SAP Successfactors Implementation and Maintenance in Projects in 2024 in Technology Blogs by Members
- Enhanced Data Analysis of Fitness Data using HANA Vector Engine, Datasphere and SAP Analytics Cloud in Technology Blogs by SAP
- Join and innovate with the SAP Enterprise Support Advisory Council (ESAC) Program in Technology Blogs by SAP
- Partner-2-Partner Collaboration in Manufacturing in Technology Blogs by SAP
Top kudoed authors
| User | Count |
|---|---|
| 12 | |
| 10 | |
| 10 | |
| 7 | |
| 7 | |
| 7 | |
| 6 | |
| 6 | |
| 5 | |
| 4 |