
- SAP Community
- Products and Technology
- Technology
- Technology Blogs by SAP
- Let SAC track your KPIs: Send “Data Change Insight...
Technology Blogs by SAP
Learn how to extend and personalize SAP applications. Follow the SAP technology blog for insights into SAP BTP, ABAP, SAP Analytics Cloud, SAP HANA, and more.
Turn on suggestions
Auto-suggest helps you quickly narrow down your search results by suggesting possible matches as you type.
Showing results for
Product and Topic Expert
Options
- Subscribe to RSS Feed
- Mark as New
- Mark as Read
- Bookmark
- Subscribe
- Printer Friendly Page
- Report Inappropriate Content
07-06-2022
8:37 AM
Update 2023: Please note that this feature is now fully available with the Unified Story! 🙂

The Data Change Insights feature helps you discover chart-level data changes that are important and relevant to you when you aren’t opening and using analytic applications. It needs to be enabled by application designers, so that application users can set daily, weekly or also monthly subscriptions and configure value ranges to trigger data change insights.

How the users will be notified? You can receive notifications from SAC within a configured period via emails (one with data change insights, the other with a PDF attachment of the corresponding analytic application) or SAP Analytics Cloud notifications.
Please note that Data change insights is under the license of scheduling.
For more details about the Data Change Insights feature please check the SAC help: https://help.sap.com/docs/SAP_ANALYTICS_CLOUD/00f68c2e08b941f081002fd3691d86a7/294a10a9e1004d49a83cf...
Now let's start. First I need an analytics application created within the SAC Analytics Designer. Let's use one, which I have created a while ago. It is a simple application based on a live connection on SAP BW/4HANA. Let’s see, what we can do.

Scroll down and select "Enable Data Change Insights". Click "Save" and leave the settings:


A few changes happened. One important change is the new “Data Change Insights” folder in the scripting area with an item inside. In the settings you can specify which version of the analytics application will be used by the Data Change Insights feature. You need to select one version. If you don’t do it and save your analytics application again, you will have a new version and the snapshots can’t be created. So only one version at a time will be compared.

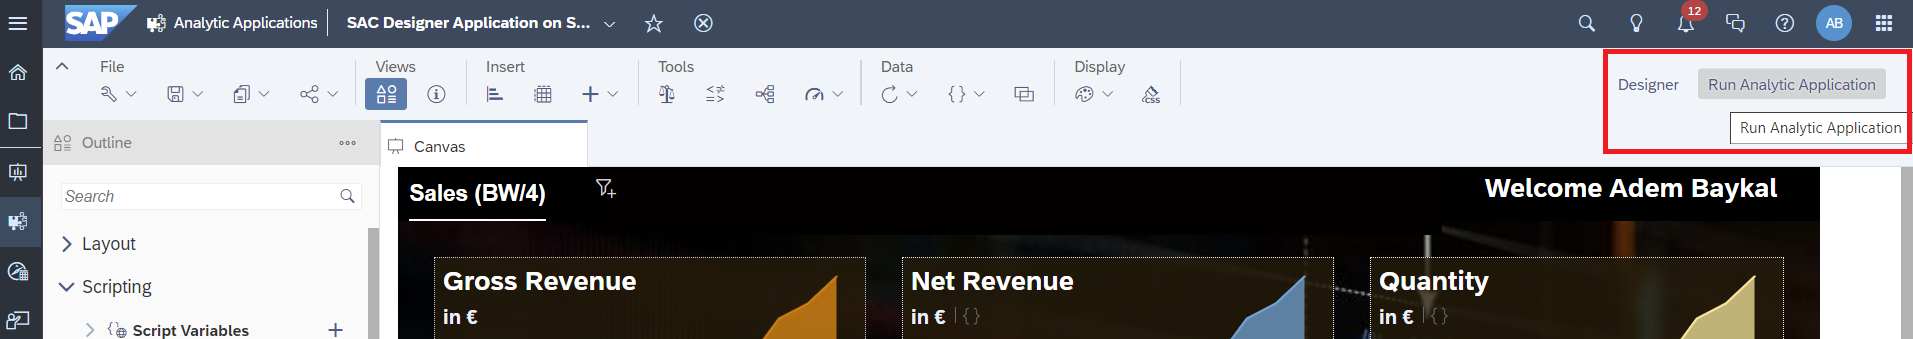
Now we can run our Analytic Application.
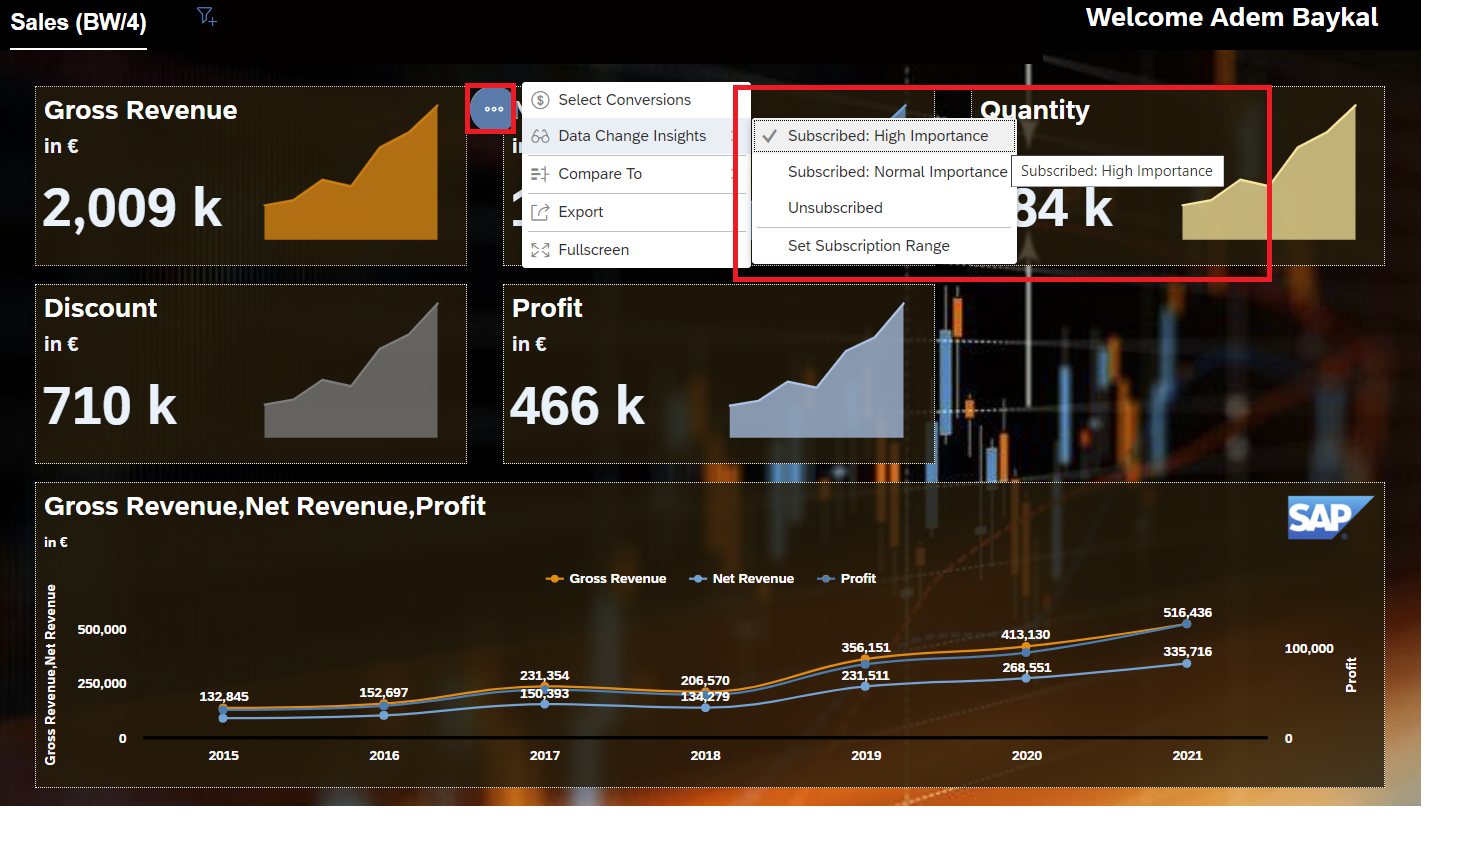 We can also set a subscription range by selecting “Set Subscription Range” in the menu.
Let's use it.

Finally we can set a range. SAC will track the data changes according our settings.
I will set a fixed value for the Gross Revenue:

I leave the settings with "OK". Now we are ready to continue. Select "Tools" -> "Subscribe Data Change Insights" from the menu:

We can now maintain a few settings (name, date, time, recurrence, receivers).

Set the details for the recurrence:

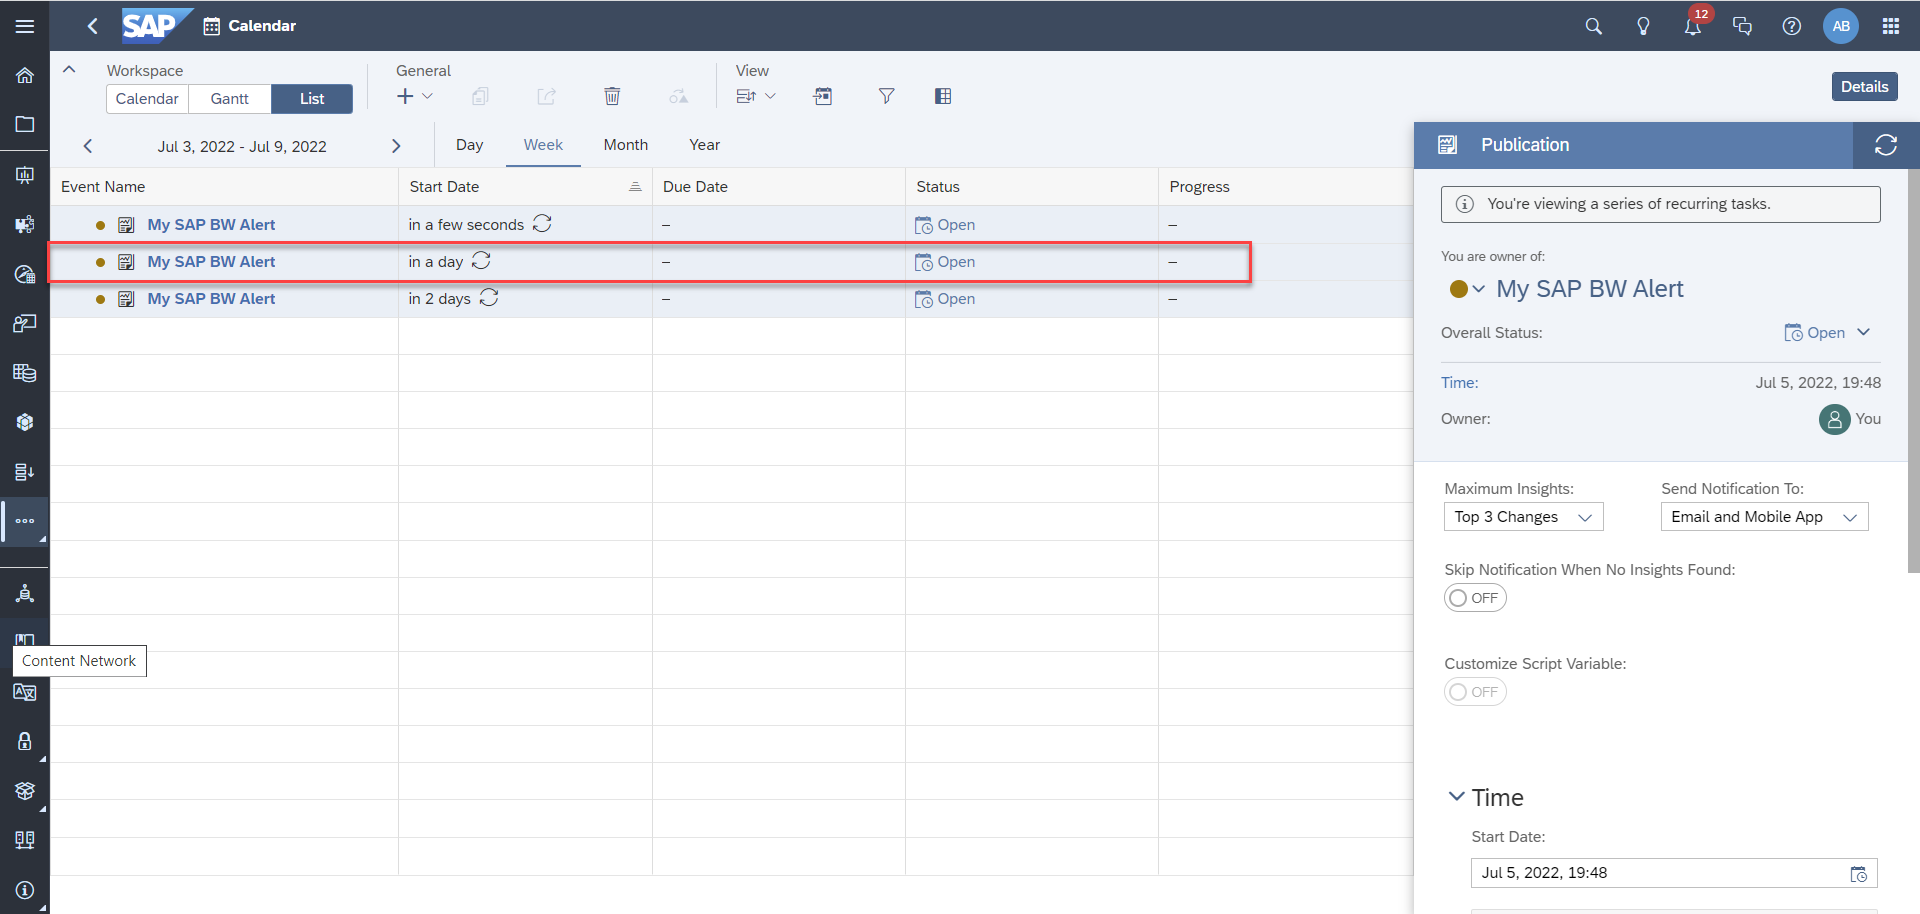
You will see a popup which will guide you to the calendar. You can open the calender also from the navigaion panel on the left side. There you will find the events related to your subscription.

Once the event status wents to "Successful"..........

.... I receive "two" emails from SAC. The first email has a snapshot as PDF inside. The second one shows some details.

One day later we did some changes on SAP BW/4HANA side. Our Gross Revenue is now higher:

As we use SAC in a live mode, we can see the new data from SAP BW/4HANA in our application. In this case the higher Gross Revenue value:

We know that you can be notified via email or SAC notifications. There is also a way to leverage the script API in the SAC Analytics Designer to build some cool stuff around this Data Change Insights feature within applications. But there is another, much simpler way to consume this notifications in SAC - via the SAC home screen.
Since Q1 2022 users can now add Data Change Insights as a tile on the SAP Analytics Cloud Home Screen to include:
In the next step you need to activate "Data Change Insights":

Finally you can see a new tile on your home which shows the Top Data Chance Insights.

If you click on a number, you will see a chart with details:

The following video shows only the result - not the process:
Please note that the snapshos will be saved by default in the "Local Tenant Storage" (A).
SAC Administrators can add their own Data Repository (B) if requested.

Let's summarize the blog content.
Your key takeaways:
I hope you liked the blog and let's see, what we will see in the next one. 🙂
Best regards to all SAC fans out there.
Adem
Today I want to use a nice SAC feature which is called “Data Change Insights” together with a "SAC Application" based on a live connection to SAP BW/4HANA (Note: though I am using SAP BW/4HANA as data source, this should also work with SAP BW on HANA or SAP S/4HANA as live data source).
The Data Change Insights feature helps you discover chart-level data changes that are important and relevant to you when you aren’t opening and using analytic applications. It needs to be enabled by application designers, so that application users can set daily, weekly or also monthly subscriptions and configure value ranges to trigger data change insights.
In addition, data change insights can be triggered when there’re value changes across thresholds, value changes across reference lines and top N member changes. For different types of data changes, different chart types are supported.
How the users will be notified? You can receive notifications from SAC within a configured period via emails (one with data change insights, the other with a PDF attachment of the corresponding analytic application) or SAP Analytics Cloud notifications.
Please note that Data change insights is under the license of scheduling.
For more details about the Data Change Insights feature please check the SAC help: https://help.sap.com/docs/SAP_ANALYTICS_CLOUD/00f68c2e08b941f081002fd3691d86a7/294a10a9e1004d49a83cf...
Now let's start. First I need an analytics application created within the SAC Analytics Designer. Let's use one, which I have created a while ago. It is a simple application based on a live connection on SAP BW/4HANA. Let’s see, what we can do.

In the next step I switch to the “edit mode”, to change a few settings.
Let’s look into the "Analytic Application Details":
Scroll down and select "Enable Data Change Insights". Click "Save" and leave the settings:
A few changes happened. One of them is, that you will see
A few changes happened. One important change is the new “Data Change Insights” folder in the scripting area with an item inside. In the settings you can specify which version of the analytics application will be used by the Data Change Insights feature. You need to select one version. If you don’t do it and save your analytics application again, you will have a new version and the snapshots can’t be created. So only one version at a time will be compared.
There is one important step which needs to be performed as well. For each widget which needs to be tracked by SAC, you need to enable the "Data Change Insights" Feature in the properties of the widget.
Now we can run our Analytic Application.
During the runtime of your analytic application you can activate Data Change Insights for each tile, by just subscribing to it. We will do this only for the Gross Revenue!
We can also set a subscription range by selecting “Set Subscription Range” in the menu.Let's use it.
Finally we can set a range. SAC will track the data changes according our settings.
I will set a fixed value for the Gross Revenue:
I leave the settings with "OK". Now we are ready to continue. Select "Tools" -> "Subscribe Data Change Insights" from the menu:
We can now maintain a few settings (name, date, time, recurrence, receivers).
Set the details for the recurrence:

If the SAP BW Query contains variables, you can edit prompts by clicking on the "Edit Prompts":
If anything is done, we finally create the subscription:
You will see a popup which will guide you to the calendar. You can open the calender also from the navigaion panel on the left side. There you will find the events related to your subscription.
Once the event status wents to "Successful"..........
.... I receive "two" emails from SAC. The first email has a snapshot as PDF inside. The second one shows some details.

But currently nothing happened, as there was not data change on BW side.
We still see the same value as on the screenshots before.
One day later we did some changes on SAP BW/4HANA side. Our Gross Revenue is now higher:
As we use SAC in a live mode, we can see the new data from SAP BW/4HANA in our application. In this case the higher Gross Revenue value:

As you remember, we have created a schedule a few steps ago, where we set a recurrence range around three days. And the next schedule was planned to start one day later.
And one day later SAC checked the snapshots of the data and I have received a notification via email that numbers has been changed 🙂
We know that you can be notified via email or SAC notifications. There is also a way to leverage the script API in the SAC Analytics Designer to build some cool stuff around this Data Change Insights feature within applications. But there is another, much simpler way to consume this notifications in SAC - via the SAC home screen.
Since Q1 2022 users can now add Data Change Insights as a tile on the SAP Analytics Cloud Home Screen to include:
- Subscripted data changes across applications
- Ability to search a certain data change
- Ability to filter data changes with different criteria (top N, time range, importance, and the like).
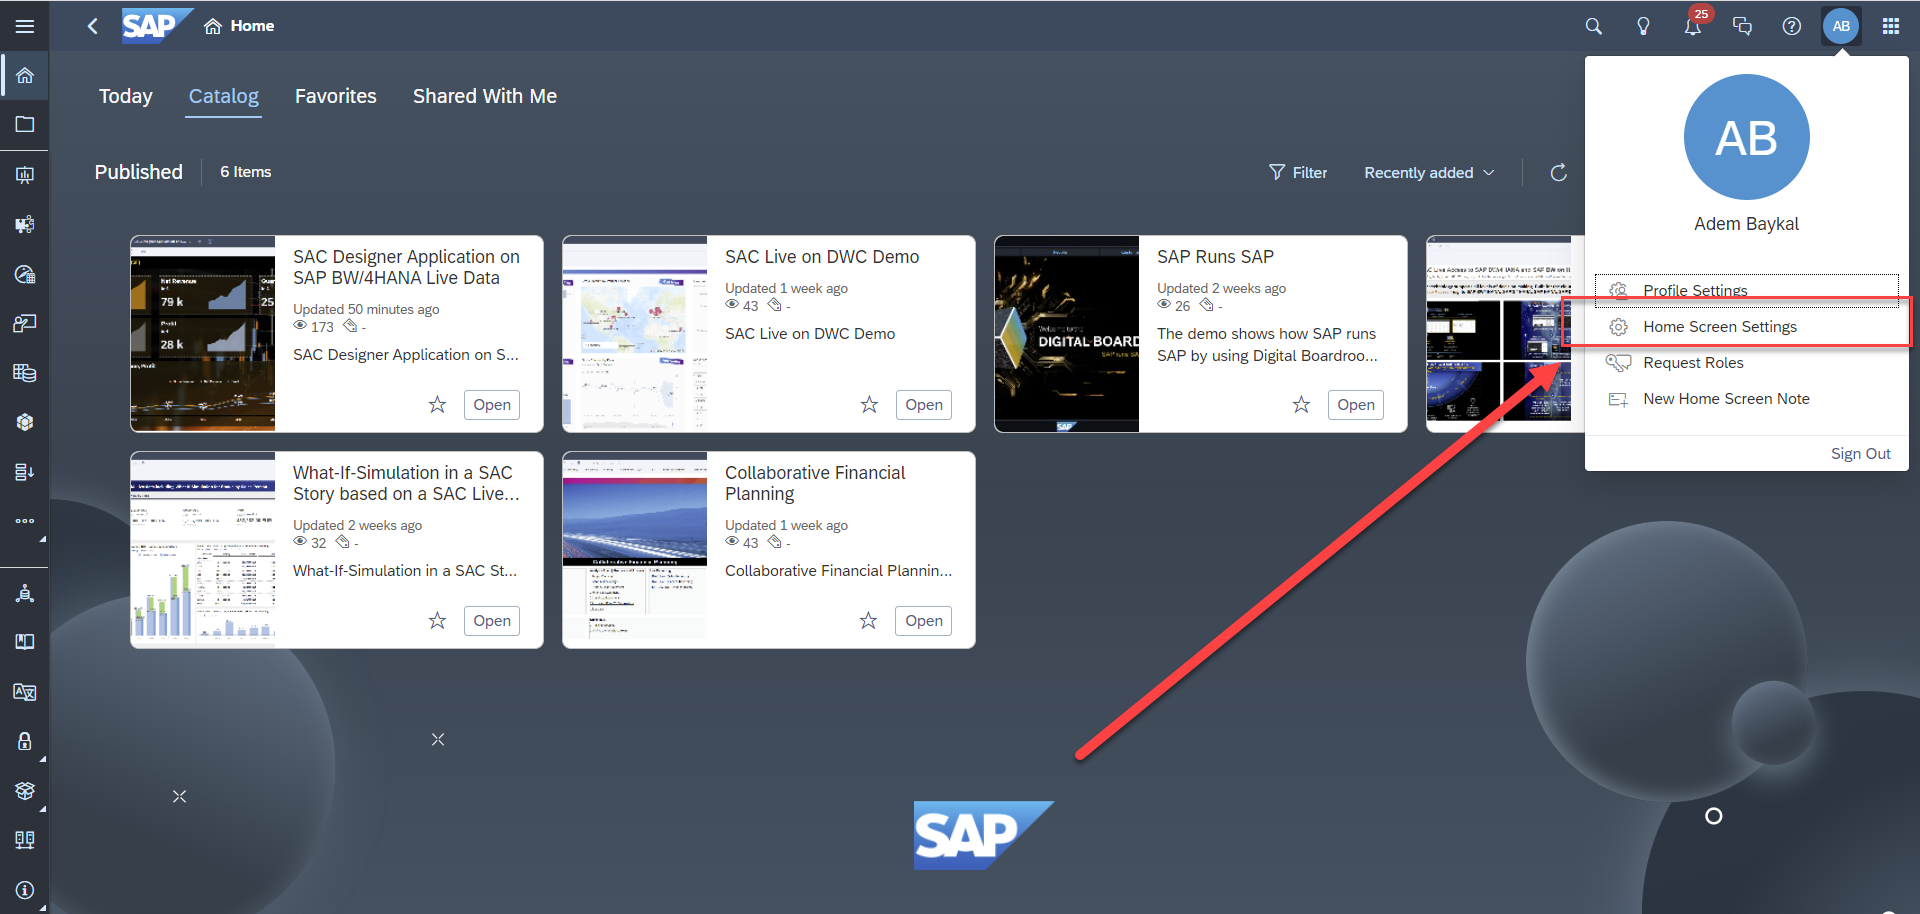
All you need to do is to go to the SAC home screen and there you can maintain the "Home Screen Settings":
In the next step you need to activate "Data Change Insights":
Finally you can see a new tile on your home which shows the Top Data Chance Insights.
If you click on a number, you will see a chart with details:

The SAC Home Screen is really cool and as you know you can move any item on the screen:
The following video shows only the result - not the process:
Cool stuff 🙂
Please note that the snapshos will be saved by default in the "Local Tenant Storage" (A).
SAC Administrators can add their own Data Repository (B) if requested.
Let's summarize the blog content.
Your key takeaways:
- The Data Change Insights feature helps you discover chart-level data changes that are important and relevant to you when you aren’t opening and using “analytic applications”. SAC stories are not supported.
- Data change insights can be triggered when there’re value changes across thresholds, value changes across reference lines and top N member changes. For different types of data changes, different chart types are supported.
- You can track the change of absolute values and the deltas!
- You will be notified via email and SAC notifications
- You can also be notified on the SAC home screen (Data Change Insights from different applications can be shown)
- Data change insights is under the license of scheduling. If you’re an admin, refer to Configure Scheduling of Publication.
- SAC will compare different snapshots of the data. There can be only 1 snapshot a day. If you create more than one a day, the last snapshot will be overwritten.
- Application Designers can enable Data Change Insights and leverage Script APIs.
- Application Users can subscribe to Data Change Insights and view Data Change Insights.
- Application Designers has some more options using the Script API. I can recommend the blog post from avsalynin for further details and examples.
- On application level, no date changes insights will be generated and users will get a warning if:
- The application gets modified during subscription period (two snapshots from different document save versions).
- The application view is a different one.
- The model variables from the URL parameter are changed.
- On chart level, the comparison within a chart will be ignored if:
- A chart's model variable is changed.
- A chart's filter is changed (except for dynamic datetime filter).
- A chart's calculated measure's referenced script variable is changed.
I hope you liked the blog and let's see, what we will see in the next one. 🙂
Best regards to all SAC fans out there.
Adem
- SAP Managed Tags:
- SAP Analytics Cloud,
- SAP Analytics Cloud, analytics designer
Labels:
15 Comments
You must be a registered user to add a comment. If you've already registered, sign in. Otherwise, register and sign in.
Labels in this area
-
ABAP CDS Views - CDC (Change Data Capture)
2 -
AI
1 -
Analyze Workload Data
1 -
BTP
1 -
Business and IT Integration
2 -
Business application stu
1 -
Business Technology Platform
1 -
Business Trends
1,661 -
Business Trends
91 -
CAP
1 -
cf
1 -
Cloud Foundry
1 -
Confluent
1 -
Customer COE Basics and Fundamentals
1 -
Customer COE Latest and Greatest
3 -
Customer Data Browser app
1 -
Data Analysis Tool
1 -
data migration
1 -
data transfer
1 -
Datasphere
2 -
Event Information
1,400 -
Event Information
66 -
Expert
1 -
Expert Insights
178 -
Expert Insights
293 -
General
1 -
Google cloud
1 -
Google Next'24
1 -
Kafka
1 -
Life at SAP
784 -
Life at SAP
12 -
Migrate your Data App
1 -
MTA
1 -
Network Performance Analysis
1 -
NodeJS
1 -
PDF
1 -
POC
1 -
Product Updates
4,577 -
Product Updates
340 -
Replication Flow
1 -
RisewithSAP
1 -
SAP BTP
1 -
SAP BTP Cloud Foundry
1 -
SAP Cloud ALM
1 -
SAP Cloud Application Programming Model
1 -
SAP Datasphere
2 -
SAP S4HANA Cloud
1 -
SAP S4HANA Migration Cockpit
1 -
Technology Updates
6,886 -
Technology Updates
416 -
Workload Fluctuations
1
Related Content
- Analyze Expensive ABAP Workload in the Cloud with Work Process Sampling in Technology Blogs by SAP
- SAP Analytics Cloud - Performance statistics and zero records in Technology Blogs by SAP
- Unify your process and task mining insights: How SAP UEM by Knoa integrates with SAP Signavio in Technology Blogs by SAP
- Capture Your Own Workload Statistics in the ABAP Environment in the Cloud in Technology Blogs by SAP
- Streamline the updates for SAP HANA Cloud with SAP Automation Pilot in Technology Blogs by SAP
Top kudoed authors
| User | Count |
|---|---|
| 29 | |
| 21 | |
| 10 | |
| 7 | |
| 6 | |
| 6 | |
| 6 | |
| 5 | |
| 5 | |
| 4 |