


Datasets
- Adult: The UCI Adult dataset [3] contains US census income survey records. We use the binarized “income” feature as the target variable for our classification task to predict if an individual’s income is above 50k.
- LSAC: The Law School dataset [4] from the law school admissions council’s national longitudinal bar passage study to predict whether a candidate would pass the bar exam. It consists of law school admission records, including gender, race, features like family income, and others derived from the GPA. The classification target is the binary feature “isPassBar”.
- ACS Employment: The ACS employment dataset [6] is derived from the American Community Survey released by the US Census bureau, where the feature informing if a given individual was employed in the year of the data collection is transformed into the prediction target. Here, we use 10% of the survey results for the state of California in 2018. It includes features such as educational attainment, marital status, citizenship, employment status of parents, among others.
- ACS Income: The ACS income dataset [6] was created as a replacement of the UCI Adult dataset. The task is to predict if a person’s income is above 50 thousand dollars. As for the ACS Employment dataset, we use a 10% sample of data from the ACS survey results for the state of California in 2018.
In the experimental results we show here, we considered each subgroup as the intersections between gender and race.
Fairness Notions
We briefly define the fairness notions we used in this work.
Demographic Parity
A predictor that satisfies the demographic parity constraint should yield that each subgroup should receive the positive outcome at equal rates.
Mathematically speaking, demographic parity can be expressed as follows, where Y′ is the predicted label and A is the protected attribute indicating the subgroup:
P(Y’ = 1 | A = a) = P(Y’ = 1 | A = b ), ∀ a, b ∈ A
Demographic parity notion helps preventing the reinforcement of historical biases and supports the underprivileged groups in short term due to the progressive enforcement of a positive feedback loop. However, ensuring demographic parity focuses only on the final outcome and not on the equality of treatment, which can lead to a problem called laziness, where a trained model selects the true positives of the privileged groups while selecting randomly (with a coin toss) subjects from the underprivileged groups as long as the number of selected subjects from each subgroup is valid. In addition, demographic parity could be used in inappropriate context, where the disparity is truly present but is not related to a protected attribute.
Equalized Odds
A predictor that satisfies the equalized odds constraint should predict each of the labels equally well for all the subgroups.
Equalized odds can be expressed as follows, where A is the protected attribute characterizing the subgroup, Y’ is the predicted label and Y is the ground truth label:
P(Y’ = 1 | Y = y, A = a) = P(Y’ = 1| Y = y, A = b), ∀ y ∈ {0,1} and ∀ a, b ∈ A
Unlike Demographic parity, equalized odds can ensure the equality of treatment, which eliminates the laziness issue above-mentioned. However, the equalized odds notion would not help dealing with bias in the long term. It does not take into consideration potential bias outside of the model, which can lead to enforcing the bias, particularly in cases where an extreme disproportionality is present between different subgroups.
The Impossibility Theorem of Fairness [9] states that demographic parity and equalized odds are mutually exclusive, meaning that no more than one of the fairness notions can hold at the same time.
Experiments
We defined a basic neural network architecture for tabular data in Pytorch. We do a 5-fold cross validation hyperparameter search on each dataset to find the best hyperparameter configuration with the goal of maximizing the overall model AUC score. This metric is appropriate because it is insensitive to class imbalance and to the decision threshold. We performed the hyperparameter search four times for each of the datasets:
- With and without the protected attributes (gender and race — remark that in this study we kept all the original race categories present in the dataset);
- With and without differential privacy — we applied DP-SGD using Opacus [7].
The grid search was performed over the following configuration ranges:
- Learning rate: 1e-4, 1e-3,1e-2, 1e-1
- Dropout probability: 0.0, 0.1, 0.2
- Number of hidden blocks: 1 to 3
- Batch size: 256, 512
- Activation: Relu, Tanh
- Optimizer: Adam, SGD
- Max gradient norm (for differential privacy only): 0.01, 0.1, 1
After, we trained the model ten times using the best configuration for each of the four cases (with/without privacy, with/without the protected attributes). We used a hold-out test set (thus not used during the 5 folds cross validation phase) to collect all the metric values that were computed with Fairlearn [8].
We also trained the best non-private model configuration with the addition of differential privacy. In this case, we did not adjust any other hyperparameters. Using the default model with differential privacy approximates what has occurred in most previous research, where differential privacy was added to the baseline models with minor adjustments (perhaps batch size or learning rate).
In the following the results, we decided to omit the case where we did not use the protected attributes, to make this article concise. Overall, most metrics are better when the protected attributes are present in the training data.
Results
Below we discuss the detailed results for each of the datasets.
ACS Income
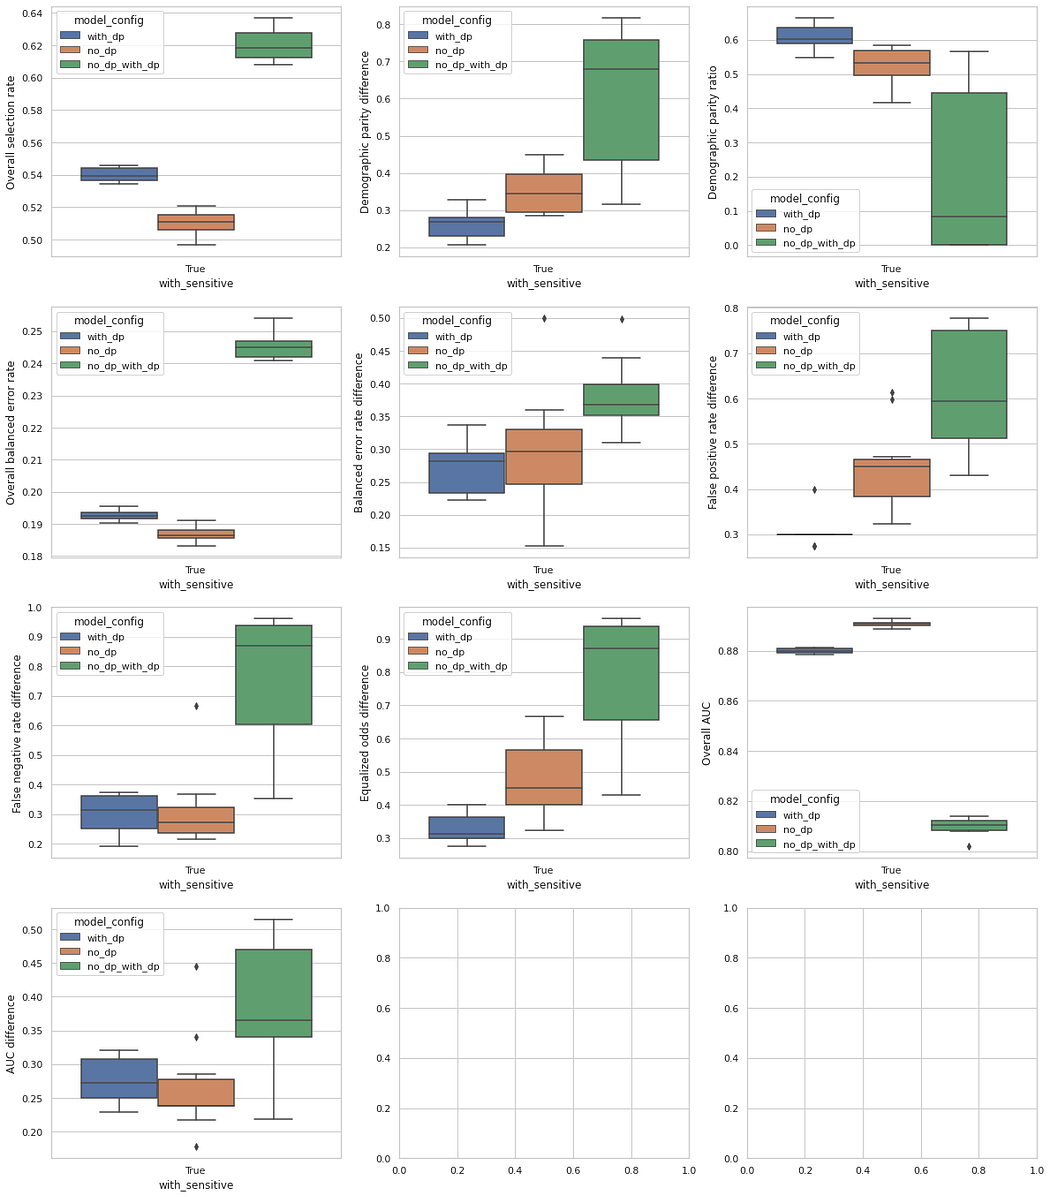
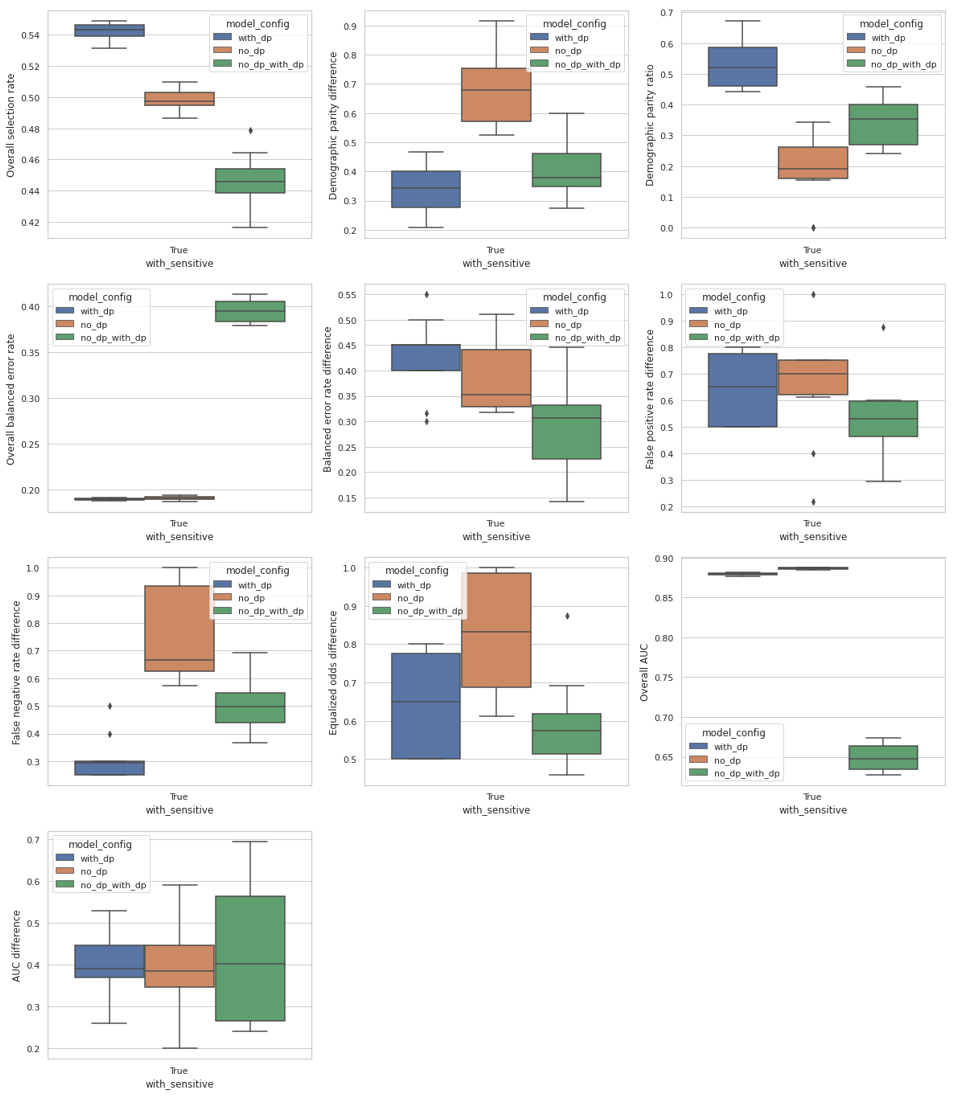
In the plots below we present several metrics for the ACS Income dataset. The blue boxes represent the best model configuration with differential privacy. The orange boxes represent the baseline model, which is the best model configuration without differential privacy. The green box uses the same configuration as the baseline model, but we train with differential privacy. We can observe that differential privacy decreases considerably the demographic parity, equalized odds difference, and AUC difference, while maintaining a very close overall AUC when compared to the baseline model. Simply adding differential privacy to the baseline model presents poor results overall.
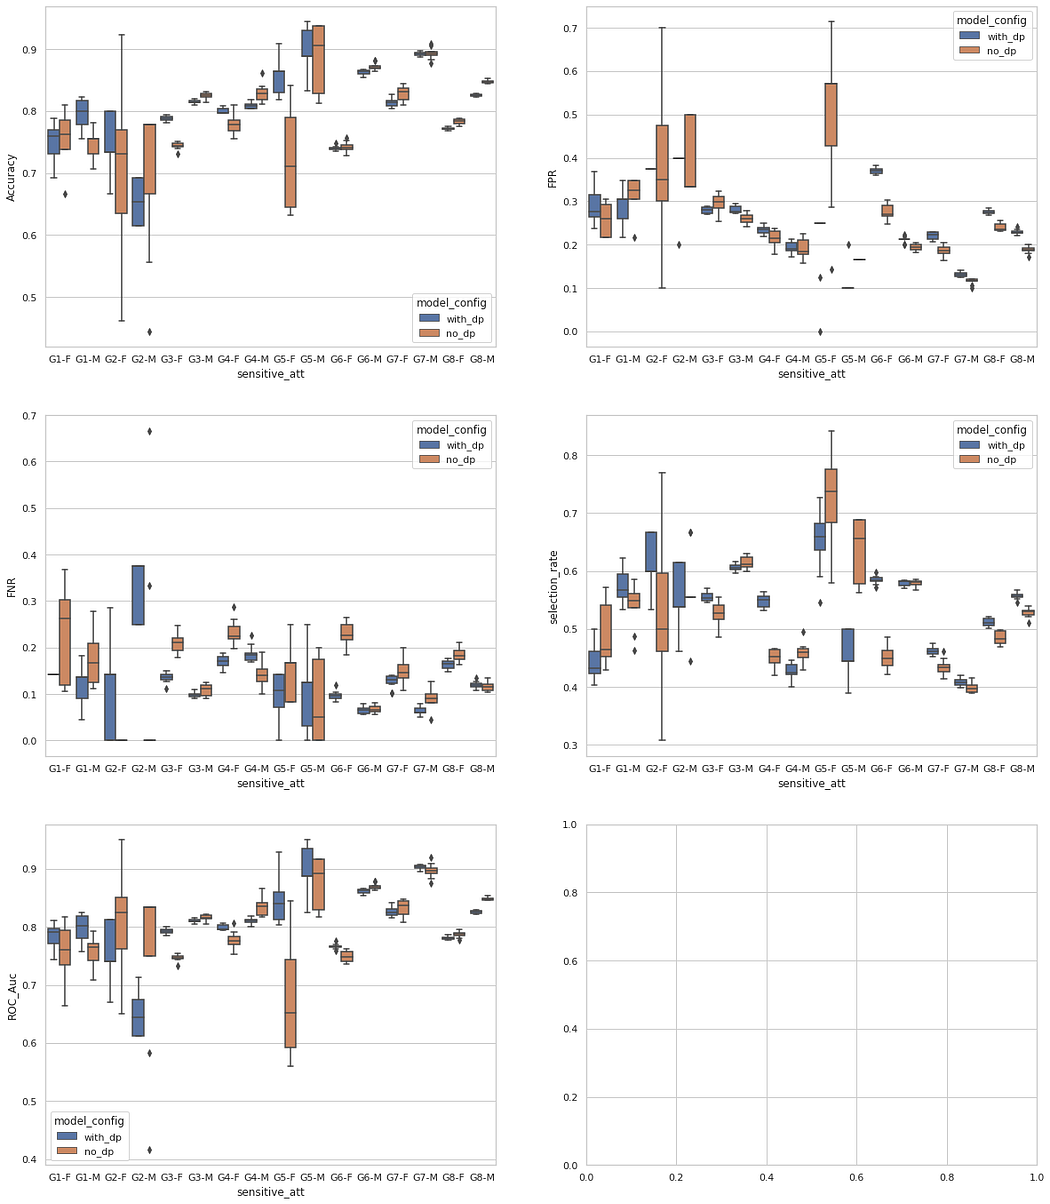
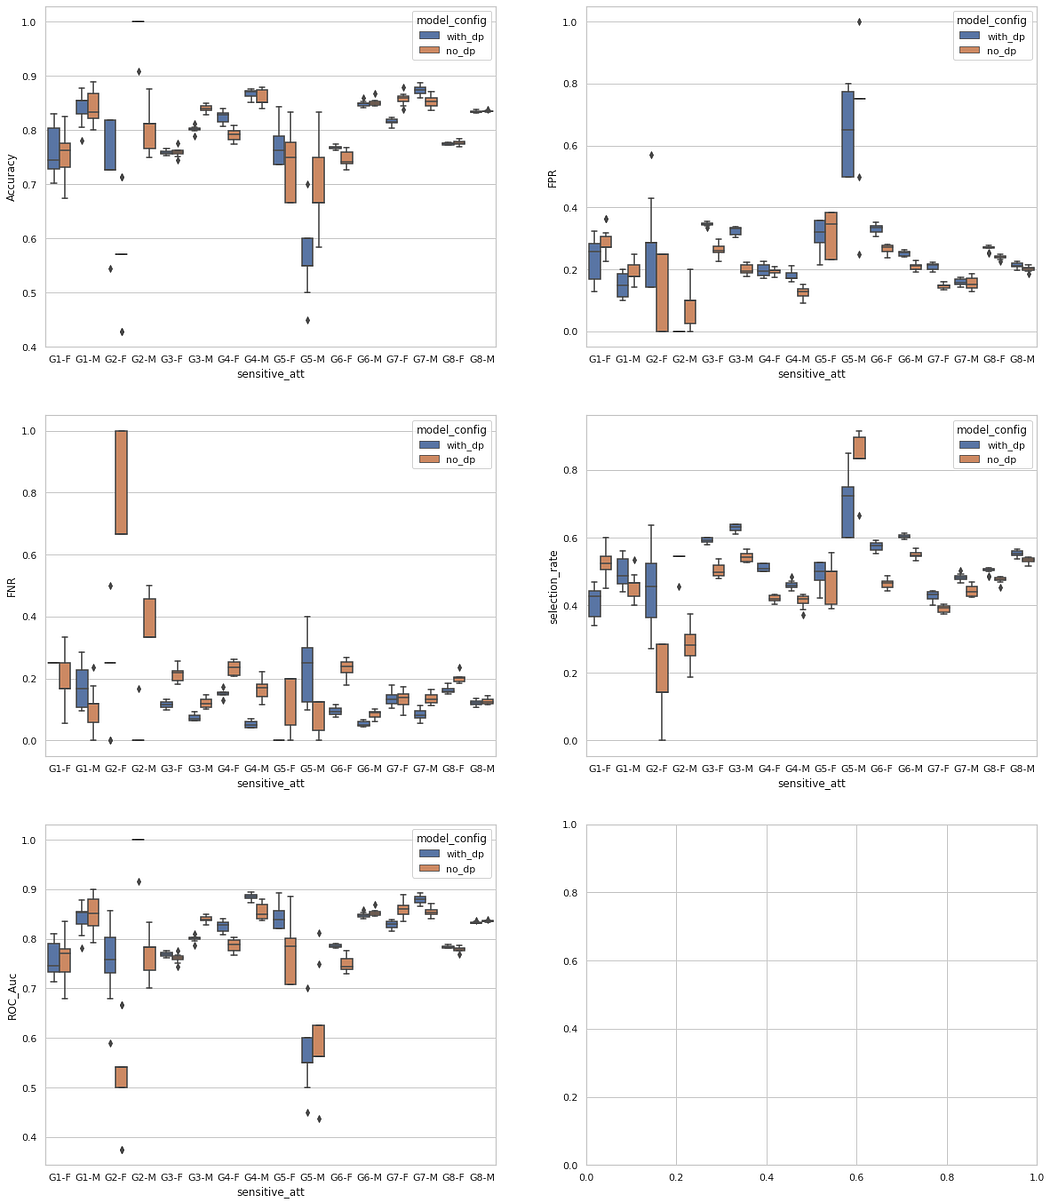
The plots below display the mean values and standard deviation over 10 model training runs for accuracy, false positive and negative rates, AUC score, and selection rate for each group combination among the race and gender attributes. While we can observe differences in the private and non-private versions of the models, it does not seem to consistently penalize a given minority group.
Below, the performance metrics per group plots contain the following group combinations in this order (listed because they become unreadable in the plot):
- G1: American Indian
- G2: Amerindian Tribes
- G3: Asian
- G4: Black
- G5: Native Hawaiian
- G6: Some Other Race
- G7: Two or More Races
- G8: White
LSAC
Below we can see the fairness metrics results for the Law School Admissions dataset. This is a more standard fairness problem since the majority groups are white-male and white-female.

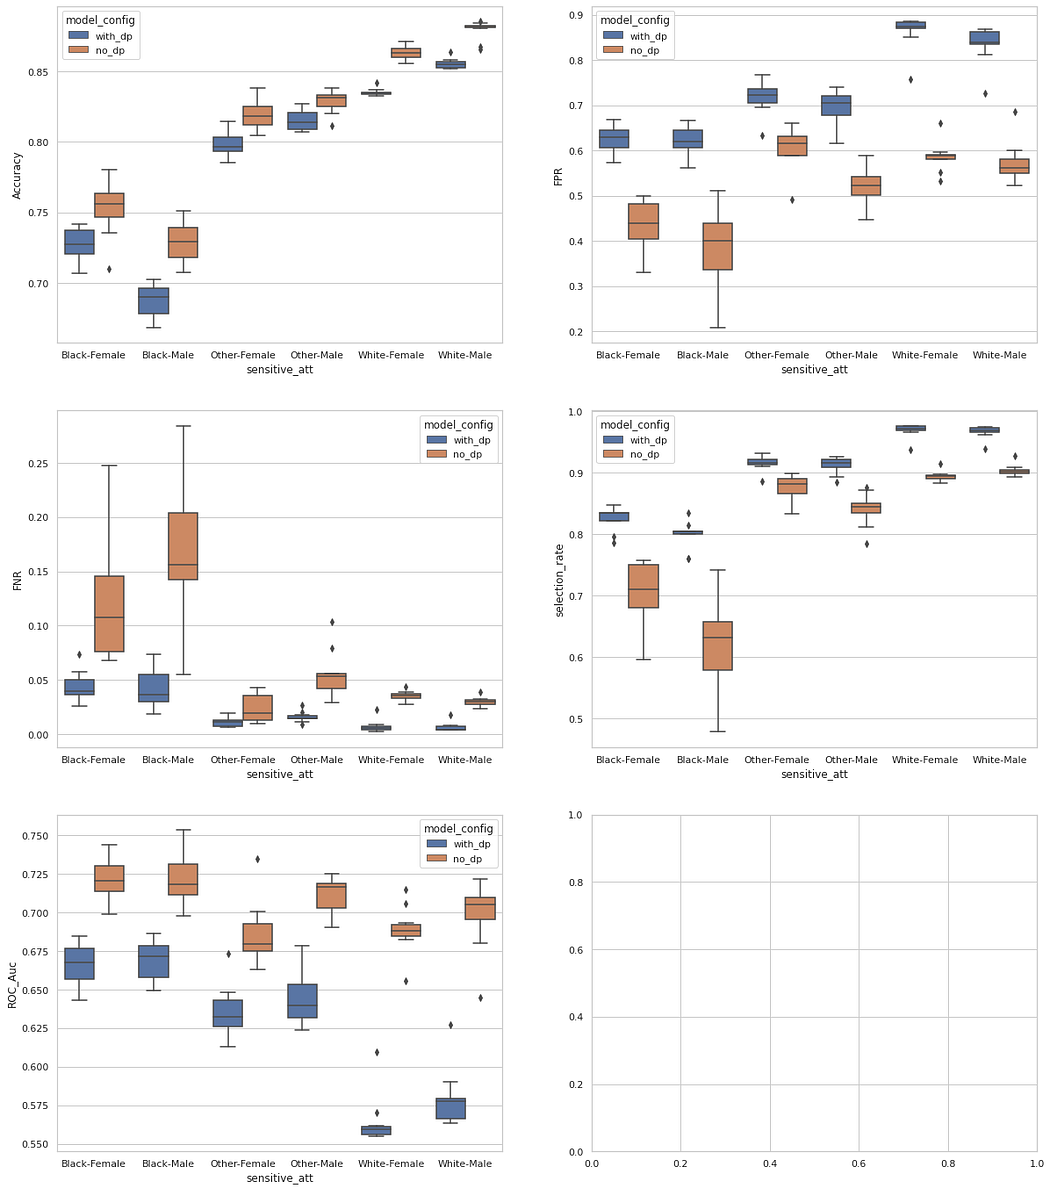
We can see here a more accentuated drop in performance (Accuracy and AUC) when using differential privacy. But notice that the greater intensity of the accuracy drop for black males is explained by the higher false positive rate, which combined with a smaller false negative rate for this minority group, would necessarily improve its selection rate; thus improving fairness overall.
Adult
This is a controversial but widely studied dataset for fairness research — it has been criticized, for instance, because the 50k income threshold makes the class imbalance too high. We report our results below. We decided to maintain all the racial groups that appear in the original dataset. This explains the disparities we can observe in the metric values because some groups are poorly represented. Still, differential privacy helped to decrease the differences across groups.

We remark that, for this dataset, the performance metrics drop in the differentially-private model remains small across groups.
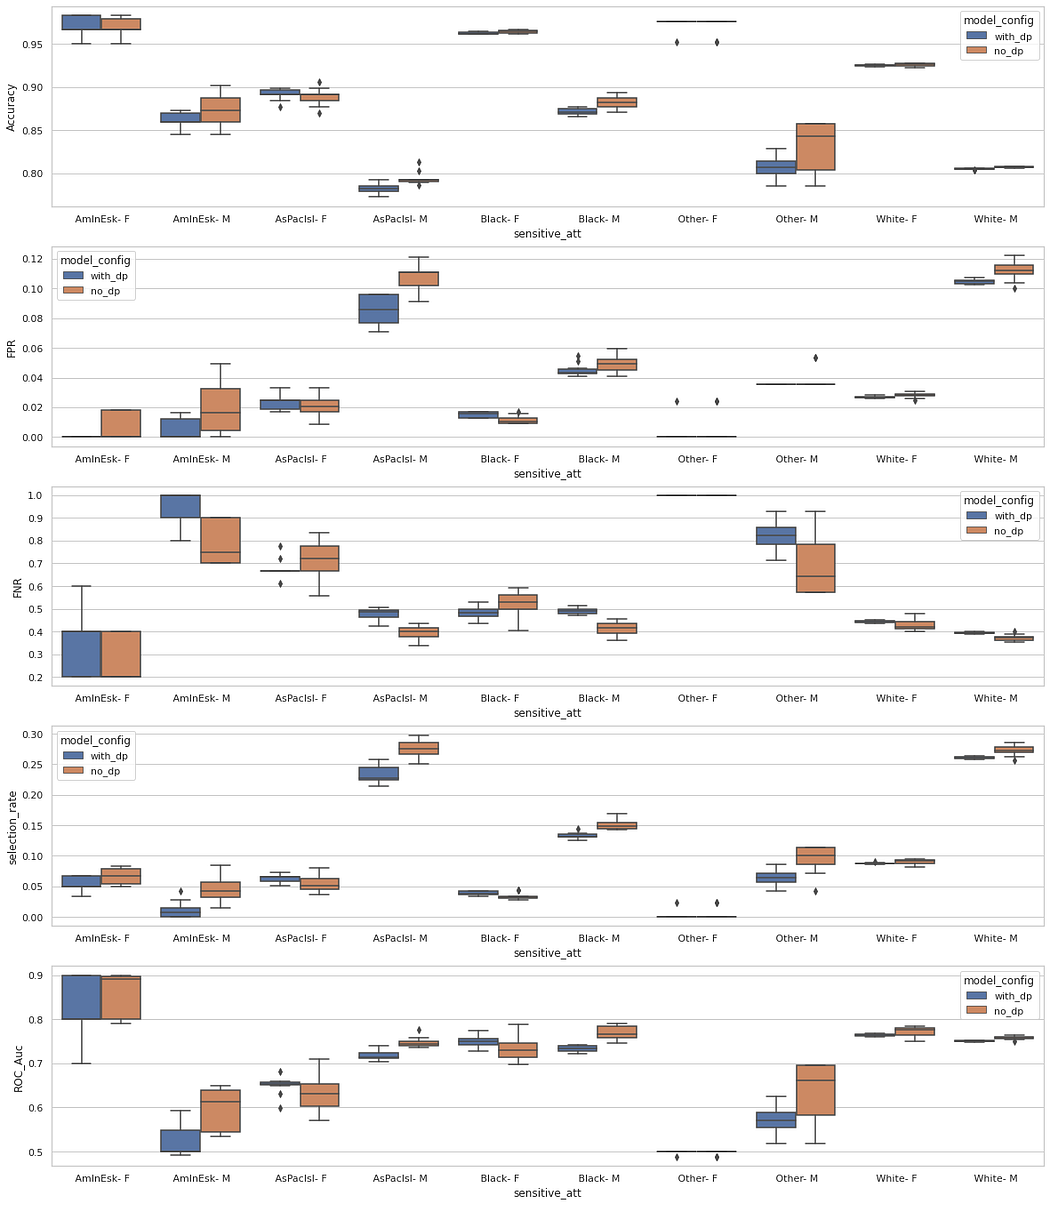
ACS Employment
In this dataset, differential privacy’s beneficial effects are easily visible.
The same groups for ACS Income are found in the performance metrics per group below:
For certain metrics and groups, we can see considerable variations in FPR and FNR that happen in the baseline model. The noise introduced by differential privacy seems to have a balancing effect, by bringing a smaller variation for certain metrics on a given subgroup.
Discussion
Differential privacy certainly reduces the model utility. We can observe slight decreases in the overall AUC scores. On the other hand, differential privacy brings considerable changes to the False Positive and Negative rates. This softens the disparities across groups for all datasets. The demographic parity differences were drastically reduced in all datasets, while equalized odds differences either remained almost equal (for LSAC) or were reduced (a 4% reduction for Adult, 19% reduction for ACS Employment, and 55% reduction for ACS Income).
Previous research has insisted on the fact that differential privacy adversely impacts accuracy for underrepresented groups, while this may be the case when adding differential privacy to an existing non-private model configuration, by using a model optimized for privacy one can observe that the resulting model can often be more “fair” than its non-privacy preserving counterpart.
References
[1] Bagdasaryan, E., Poursaeed, O., & Shmatikov, V. (2019). Differential privacy has disparate impact on model accuracy. Advances in Neural Information Processing Systems, 32.
[2] Tramer, F., & Boneh, D. (2020). Differentially private learning needs better features (or much more data). arXiv preprint arXiv:2011.11660.
[3] B. Becker R. Kohavi. 1996. UCI ML Repository. http://archive.ics.uci.edu/ml
[4] L. F Wightman. 1998. LSAC National Longitudinal Bar Passage Study. LSAC Research Report Series. (1998).
[5] J. Angwin, J. Larson, S. Mattu, and L. Kirchner. 2016. Machine bias: There’s software used across the country to predict future criminals and it’s biased against blacks. ProPublica (2016).
[6] Ding, F., Hardt, M., Miller, J., & Schmidt, L. (2021). Retiring adult: New datasets for fair machine learning. Advances in Neural Information Processing Systems, 34.
[9] Friedler, Sorelle A., Carlos Scheidegger, and Suresh Venkatasubramanian. “The (im) possibility of fairness: Different value systems require different mechanisms for fair decision making.” Communications of the ACM 64.4 (2021): 136–143.


