Have you ever been working on a project where you need some real-world geographical location dashboards to track ?? for example, say, how many incentives/commissions are generated through this particular location/city or how many sales reps are in this particular locality selling faster?

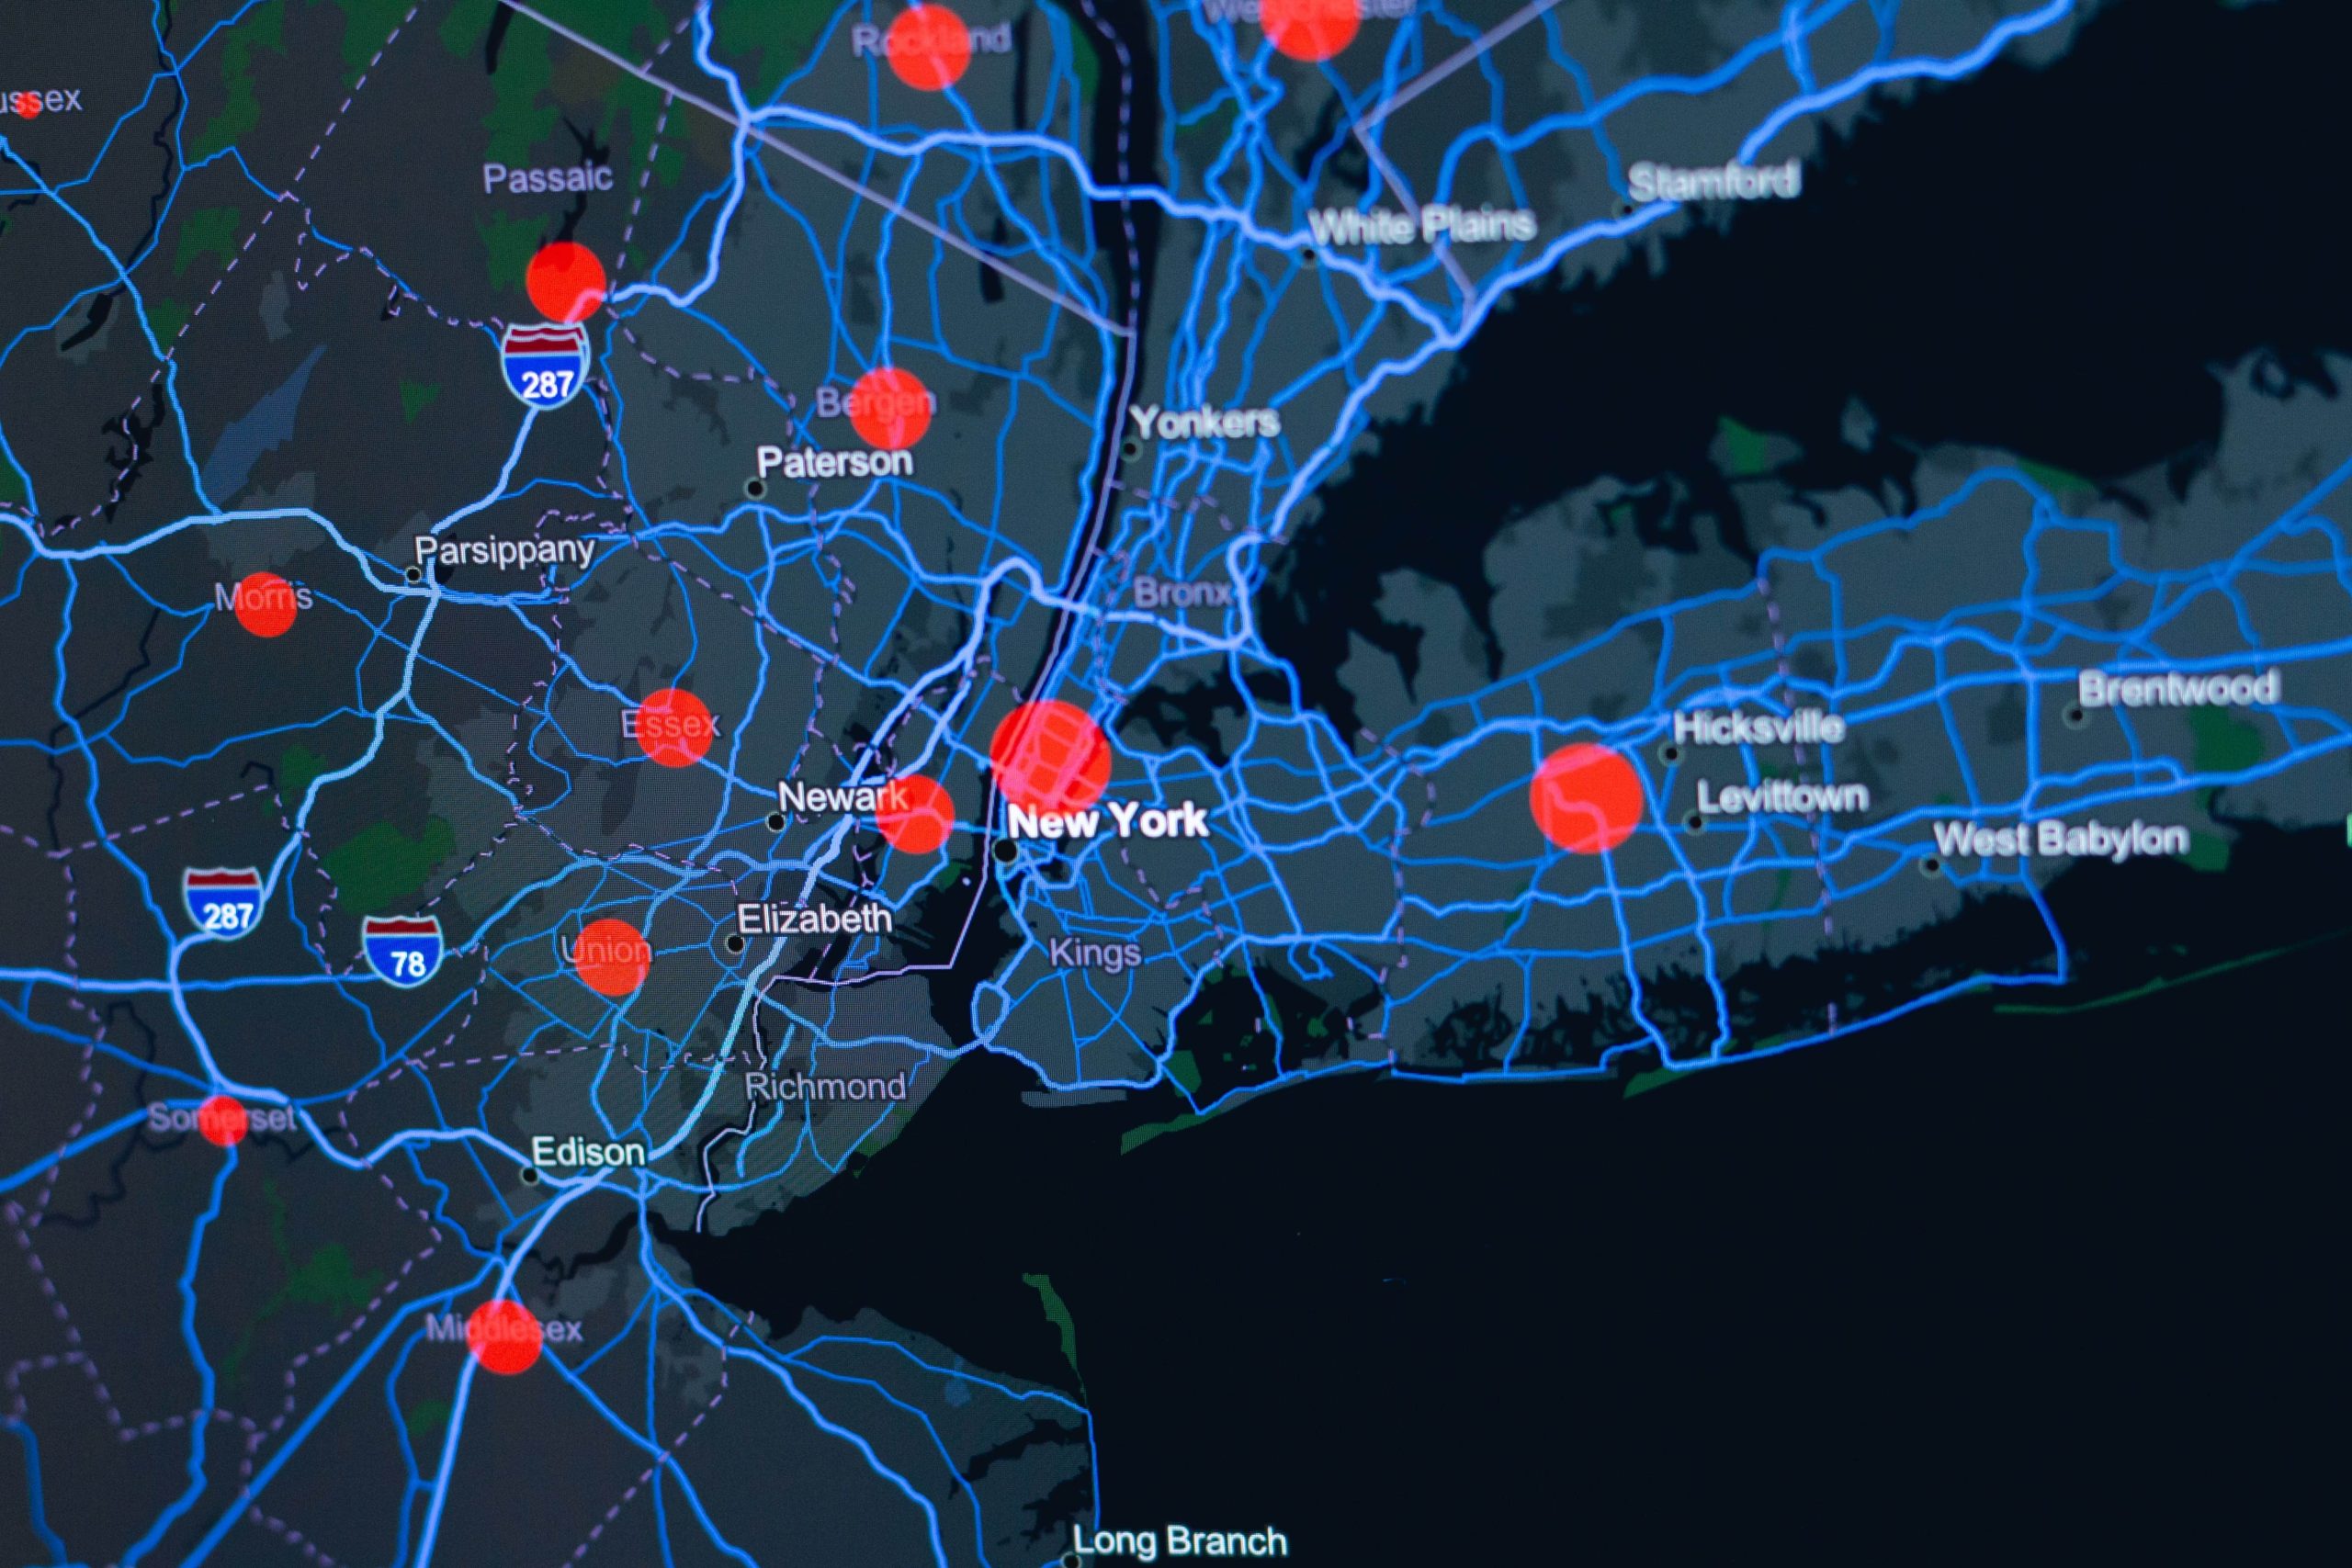
OpenStreetMap is a great open-source map of the world that can give us some insight into these and similar questions. There is a lot of data hidden in the data set, full of useful labels and geographic information.
Also, Geospatial data analytics have become a common place in data science. Beyond mapping and visualisations, it broadly consists of extracting knowledge by detecting & recognising patterns, and building models for making predictions.

Let's go over Current Challenges of your data
One major problem that organizations face is the unification of all the data- Data is spread across formats in various database and combining them to have a clear and intuitive visual representation becomes challenging. If your organization has a large foot-print or has lots of moving parts in the real world, then this process becomes all the more challenging, given the frequency and scale of data being collected.
Once access to the data gets solved, the second challenge becomes being able to visualize the data in the right way- to get the right insights & take the right decisions.
However, along with data visibility, you also need the ability to find gaps and drill down and get further insights in order to make the right decisions and have the ability to respond to potential challenges or roadblocks. The right dashboard only tells you where the gap exists but also why there is such a gap in the first place.
There is lot much to tell the story on the map for making an interactive analysis and that can be found ...

Let's get start with SAP Commissions use case
Prerequisites
The following are prerequisite tasks that must be completed before proceeding with this task:
- Developing in Local – Visual Studio Code with Nodejs Installed or whichever the language your familar
- NPM packages for Leafletjs
- SAP Commissions Portal access for Payment’s API
- SAP BTP - Cloud Foundry for deploying and access the portal in real time information
In this example, we can visualize/track each sales reps payments in google map to see most of the sales commissions performance coming from which areas

To map the location of every Sales rep, you need to have ( State or location) or ( postal code or zipcode) or city name to make digital boundry to represent in map.
In Participant workspace, in this example we have stored the boundry of Office Location for each sales rep to track every information generated in SAP Commissions
 SAP Commissions API Documentation for Payments
 NPM Package for Leaflet
📢
Leaflet is the leading open-source JavaScript library for mobile-friendly interactive maps.
Weighing just about 39 KB of JS, it has all the mapping features most developers ever need. |
Next Coming Blog - Deep dive into developing
References
Leaflet was created 11 years ago by Vladimir Agafonkin, an Ukrainian citizen living in Kyiv.
for more information -
https://leafletjs.com/
Image sources : unsplash
