
- SAP Community
- Products and Technology
- CRM and Customer Experience
- CRM and CX Blogs by SAP
- Prepare Business Analytics for Sales Business Stak...
CRM and CX Blogs by SAP
Stay up-to-date on the latest developments and product news about intelligent customer experience and CRM technologies through blog posts from SAP experts.
Turn on suggestions
Auto-suggest helps you quickly narrow down your search results by suggesting possible matches as you type.
Showing results for
Product and Topic Expert
Options
- Subscribe to RSS Feed
- Mark as New
- Mark as Read
- Bookmark
- Subscribe
- Printer Friendly Page
- Report Inappropriate Content
02-18-2022
3:34 PM
Sales Cloud is where in C4C sales teams can manage their activities. It supports sales reps to engage in a complete way with customers. Sales teams can use sales cloud to gain customer insights or to get to know who their prospects are, define what is the right product to position or the right pricing, be guided in the selling process, have the information at the tips of their fingers, anytime, anywhere, to keep on track with goals or even to be capable to forecast and to improve selling execution.
Among the different activities’ sales reps need to work, there will be different business outcomes to expect and whatever those are should be your starting point. Sales Cloud managers would typically seek information about different aspects of the process:
Each of these aspects require certain data and it is not only about which data they need or where data is sitting, but also how do you treat data. From collection to transformation whether by filtering data, comparing, or calculating you need to make sure you know the measures of success (…or failure!).
Let’s investigate the KPIs now. Below are some ideas but don’t take them as yours. Make sure to discuss and agree with your business stakeholders which ones make sense, which ones not and ask them: What metrics do Sales Managers think about?
(*) While planning your KPIs consider your scope you have adopted the core solution and the possible addons
The next two steps in building analytics should be worked in tandem, define how you will build the visuals considering who they need to serve. How you want to build the story behind the numbers?
If you work already with Business Analytics, I’m sure by now you have identified all the standard reports delivered by SAP and made them available to your users. As users started to use them you were probably heard some specific requirements addressed via customizations, views and through personalization. Well done, but there is more…You probably have also identified there are different ways to consume those reports, you may have tried the Analytics Work Center or view them embedded, used the excel plug in or even to distributed them with email via broadcast option (this one may actually be a good way if you have a long running report to distribute). That is really a great start! But let’s move further.
Think user experience wise. Who doesn’t like to check the business insights in a concise way, or get its critical tasks in the blink of an eye? You’re right: your users. We need to make data handy and easy to consume, here 3 options to apply individually or on a combined way:
Option one dashboards. You can start from SAP standard ones or create your own. With dashboards you can:
Your dashboards should relate to what sales managers aim to control, therefore provide them a view on the business outcomes they plan to achieve (sales funnel, deal execution or other). Consider they want to view the data quickly and nicely, so avoid long running and unaggregated reports in your dashboards and plan for mobile use cases where possible.
Some inspiration for you Win-Loss Dashboard
Option two design KPIs. The KPIs allow you to:
Option 3 user role specific homepages, this is the best way to create that user specific flavour to your user experience, you can play not only with the analytics requirements but also with quick launches, e-learning videos etc. For the Analytics make sure to combine a fair nr of KPIs (2-4 per business role) but don’t overcrowd or turn it into a launchpad.
As you think about personas and the business roles you will certainly conclude they have different needs. As sales business manager you may want to understand the state of your team’s deal execution, the state of the pipeline or the workforce development needs. But as a sales agent, you may want to know the status of your opportunities or the state of your sales activities. So think about this: Who is your analytics audience, what access do they have? Which data can they see?
Once you answer the questions you can then decide if you make them available to business users by assigning the reports to a specific work center, a work center view or if you want to restrict access assigning them to specific business roles. The later provides more flexibility and allows you to restrict access. You need to enable role assignment during fine tunning step of completing the activity list for your implementation. At this point it is also important to mentioned that it is not recommended to select the Allowed Access checkbox so to prevent unauthorized users to see certain data, however bear in mind analytics is context sensitive which means the data is normally displayed to users allowed to view it. Keep the number of reports only as much as is easy to work with for an end user. Instead of 200 reports, they would most likely use 20 reports. Likewise, dashboards should only have a maximum of 9 tiles Assign only relevant reports to the respective roles.
At this point we have gone through the different steps to build your analytics, so now that you have understood the process you will want to do it yourself. Here is your chance to roll up your sleeves and get hands on the job. Adoption Lab - Create a Sales Cloud dashboard using Business Analytics, will show you how to create a dashboard for your business stakeholders. It is 103 minutes packed with information and instructions to learn on the job.
If you want more inspiration about which metrics to discuss with the sales team, we then invite you to attend the Webinar - Drive your Sales process by smart decision making with the help of analytics
We hope this provides you a complete end to end process on how to work with cloud for customer built in analytics capabilities. But there is more so we will keep adding to these series as we prepare more content to you.
We hope you enjoy the reading!
CX Intelligent Adoption & Consumption Team
Among the different activities’ sales reps need to work, there will be different business outcomes to expect and whatever those are should be your starting point. Sales Cloud managers would typically seek information about different aspects of the process:
- Usage and quality of sales data – understand sales teams’ commitment to the process and adherence to golden rules (this is the right point to get IT and Sales responsible in a trustworthy handshake, where they both meet and learn where the business challenges and opportunities are)
- Sales funnel – understand the health of new business generation
- Deal Execution – understand the health of the process, productivity, velocity, and efficiency to start and close deals
- Pipeline and forecast – where do sales need to be, what is current versus planned
- Prescription on best action – understand patterns and trends to define where to spend effort in the process
Each of these aspects require certain data and it is not only about which data they need or where data is sitting, but also how do you treat data. From collection to transformation whether by filtering data, comparing, or calculating you need to make sure you know the measures of success (…or failure!).
Let’s investigate the KPIs now. Below are some ideas but don’t take them as yours. Make sure to discuss and agree with your business stakeholders which ones make sense, which ones not and ask them: What metrics do Sales Managers think about?
| Business Outcome | Metrics |
| Commitment from sales teams | · %users logged in the last month · # New accounts / # New opportunities · Unassigned leads · Overdue opportunities · Top 5/ bottom 5 activity creation |
| Sales Funnel Health | · # New leads by status or source · # Qualified leads by employee or source · Lead conversion rate |
| Deal Execution Health | · Opportunities by close date and geography · Top 10 opportunities per employee · Won deals by employee · Loss rate by sales phase |
| Pipeline and Forecast (*) | · Forecast vs Sales Target vs Pipeline · Forecast revenue by employee · Top opportunities by forecast category |
| Prescriptive Analytics (*) | · # Opportunities with higher propensity · Win rate by sales rep · # days in current phase |
(*) While planning your KPIs consider your scope you have adopted the core solution and the possible addons
The next two steps in building analytics should be worked in tandem, define how you will build the visuals considering who they need to serve. How you want to build the story behind the numbers?
If you work already with Business Analytics, I’m sure by now you have identified all the standard reports delivered by SAP and made them available to your users. As users started to use them you were probably heard some specific requirements addressed via customizations, views and through personalization. Well done, but there is more…You probably have also identified there are different ways to consume those reports, you may have tried the Analytics Work Center or view them embedded, used the excel plug in or even to distributed them with email via broadcast option (this one may actually be a good way if you have a long running report to distribute). That is really a great start! But let’s move further.
Think user experience wise. Who doesn’t like to check the business insights in a concise way, or get its critical tasks in the blink of an eye? You’re right: your users. We need to make data handy and easy to consume, here 3 options to apply individually or on a combined way:
Option one dashboards. You can start from SAP standard ones or create your own. With dashboards you can:
- create role specific interactive dashboards connecting data from different tiles
- add drilldown advanced analysis to allow your user to navigate directly from the dashboard to the report where you can slice and dice data
- use global filters and pass filters that allow you to change the selection of the reports within the dashboard at once and set different tiles
Your dashboards should relate to what sales managers aim to control, therefore provide them a view on the business outcomes they plan to achieve (sales funnel, deal execution or other). Consider they want to view the data quickly and nicely, so avoid long running and unaggregated reports in your dashboards and plan for mobile use cases where possible.
Some inspiration for you Win-Loss Dashboard
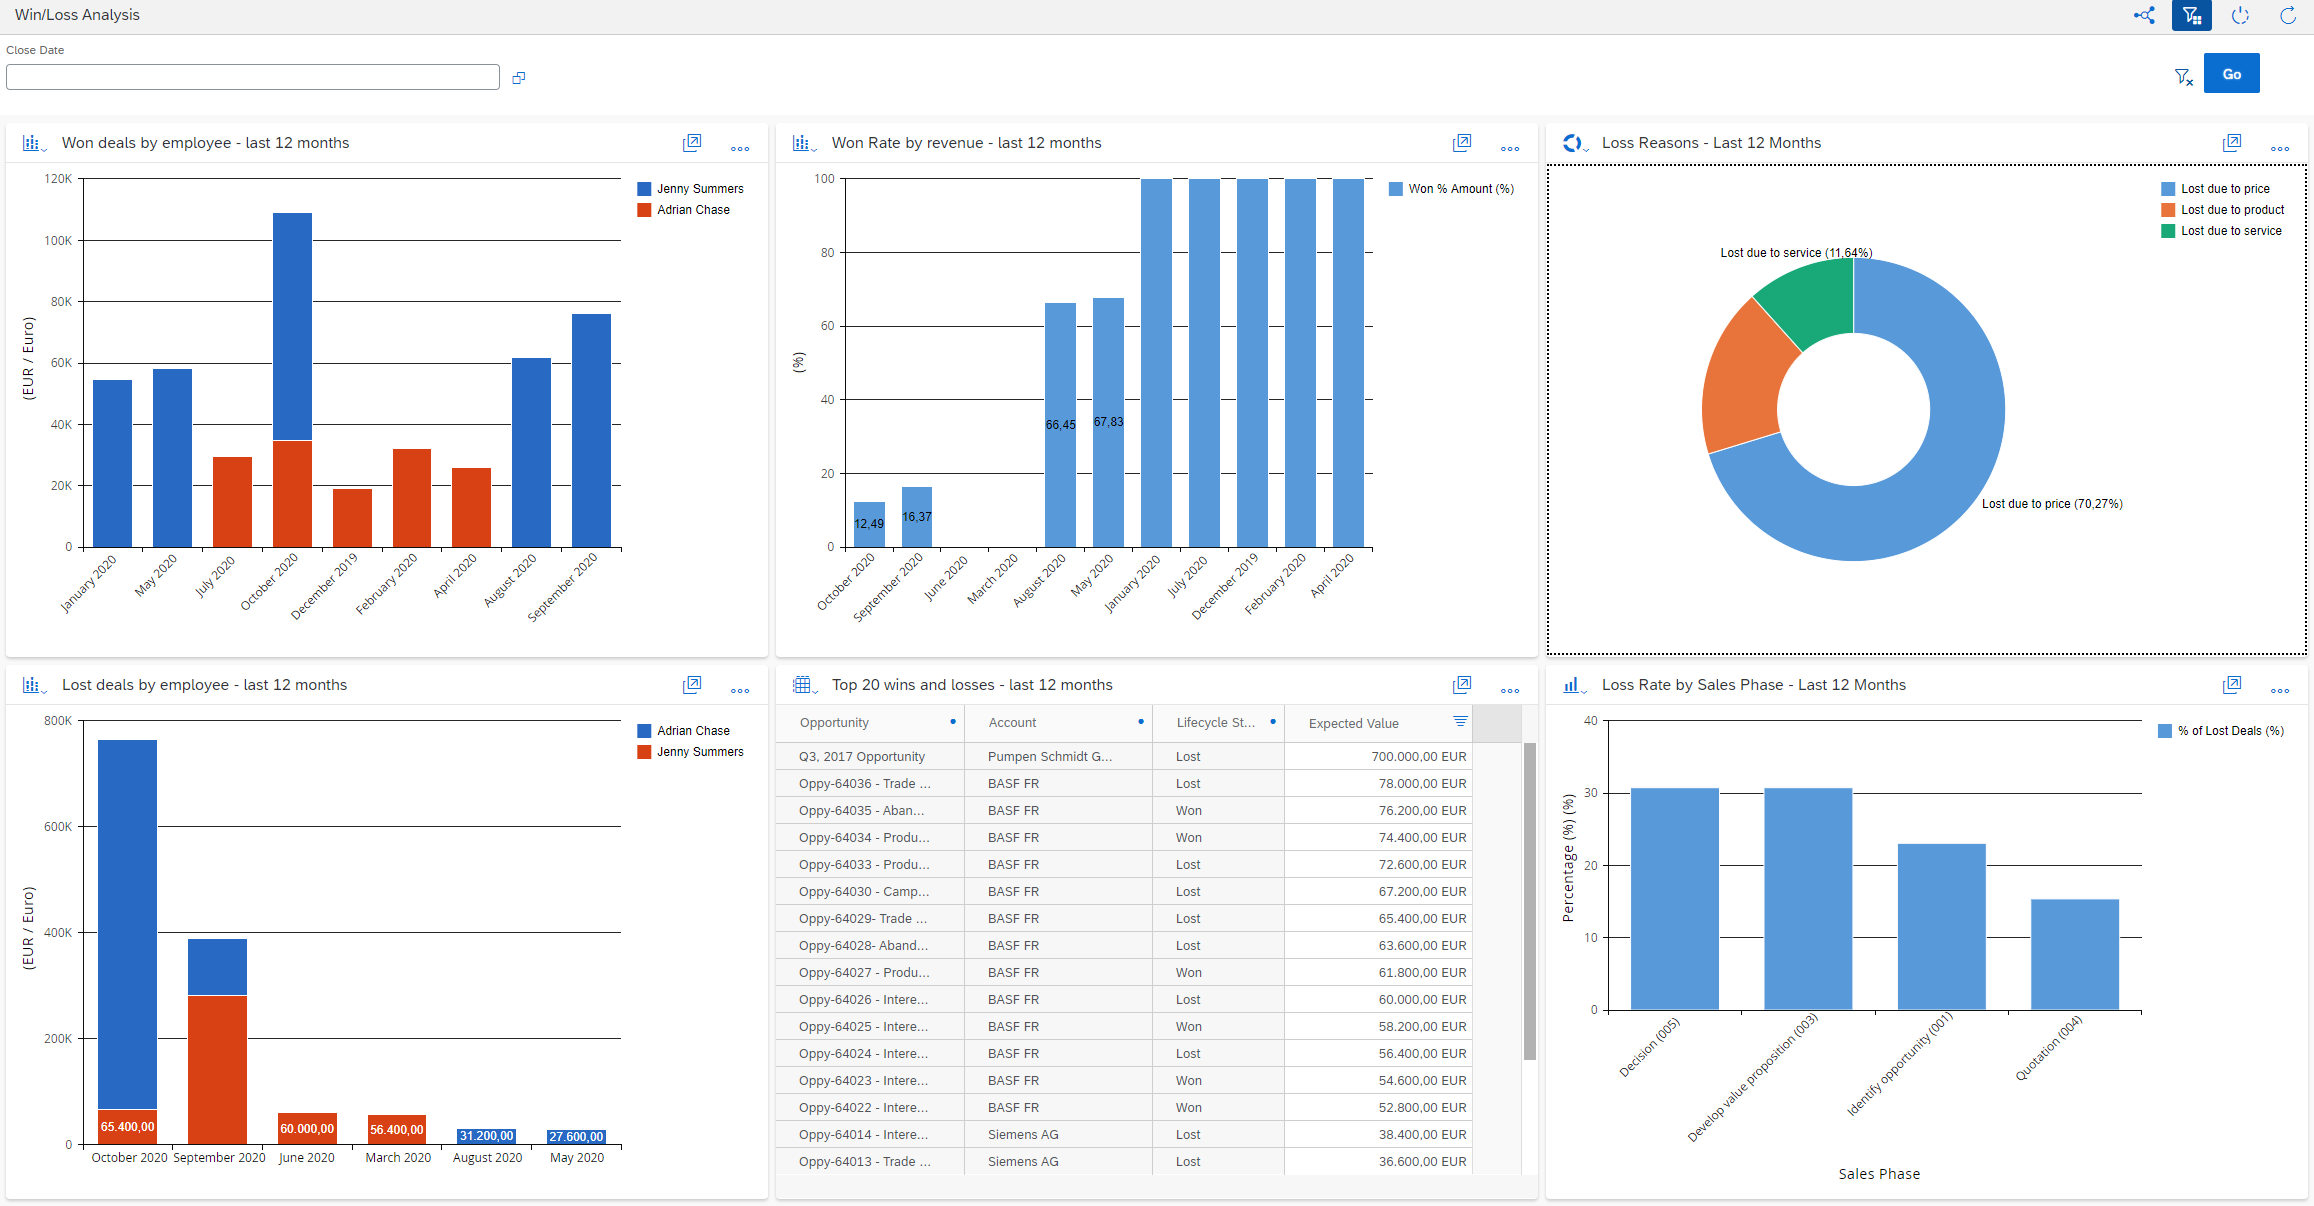
Dashboard example
Option two design KPIs. The KPIs allow you to:
- compare the results against a pre-defined target or reference value
- define a threshold with alert and warnings
- open the door to a specific report of dashboard

KPI example
Option 3 user role specific homepages, this is the best way to create that user specific flavour to your user experience, you can play not only with the analytics requirements but also with quick launches, e-learning videos etc. For the Analytics make sure to combine a fair nr of KPIs (2-4 per business role) but don’t overcrowd or turn it into a launchpad.

Home page example
As you think about personas and the business roles you will certainly conclude they have different needs. As sales business manager you may want to understand the state of your team’s deal execution, the state of the pipeline or the workforce development needs. But as a sales agent, you may want to know the status of your opportunities or the state of your sales activities. So think about this: Who is your analytics audience, what access do they have? Which data can they see?
Once you answer the questions you can then decide if you make them available to business users by assigning the reports to a specific work center, a work center view or if you want to restrict access assigning them to specific business roles. The later provides more flexibility and allows you to restrict access. You need to enable role assignment during fine tunning step of completing the activity list for your implementation. At this point it is also important to mentioned that it is not recommended to select the Allowed Access checkbox so to prevent unauthorized users to see certain data, however bear in mind analytics is context sensitive which means the data is normally displayed to users allowed to view it. Keep the number of reports only as much as is easy to work with for an end user. Instead of 200 reports, they would most likely use 20 reports. Likewise, dashboards should only have a maximum of 9 tiles Assign only relevant reports to the respective roles.
At this point we have gone through the different steps to build your analytics, so now that you have understood the process you will want to do it yourself. Here is your chance to roll up your sleeves and get hands on the job. Adoption Lab - Create a Sales Cloud dashboard using Business Analytics, will show you how to create a dashboard for your business stakeholders. It is 103 minutes packed with information and instructions to learn on the job.
If you want more inspiration about which metrics to discuss with the sales team, we then invite you to attend the Webinar - Drive your Sales process by smart decision making with the help of analytics
We hope this provides you a complete end to end process on how to work with cloud for customer built in analytics capabilities. But there is more so we will keep adding to these series as we prepare more content to you.
We hope you enjoy the reading!
CX Intelligent Adoption & Consumption Team
- SAP Managed Tags:
- SAP Cloud for Customer core applications,
- C4C Analytics,
- C4C Sales
Labels:
You must be a registered user to add a comment. If you've already registered, sign in. Otherwise, register and sign in.
Labels in this area
-
Business Trends
270 -
Business Trends
10 -
chitchat
1 -
customerexperience
1 -
Event Information
256 -
Event Information
17 -
Expert Insights
30 -
Expert Insights
48 -
Life at SAP
133 -
Life at SAP
1 -
Product Updates
666 -
Product Updates
24 -
SAP HANA Service
1 -
SAPHANACloud
1 -
SAPHANAService
1 -
Technology Updates
453 -
Technology Updates
15
Related Content
- SAP Commerce Cloud Q1 ‘24 Release Highlights in CRM and CX Blogs by SAP
- Innovate Faster: The Power Duo of SAP Activate and Scaled Agile Framework (SAFe) in CRM and CX Blogs by SAP
- SAP Premium Engagement Session 'A new SAP UX experience utilizing the BTP platform', April 11, 2024 in CRM and CX Blogs by SAP
- SAP Sales Cloud: 2023 Wrap-up and Forward Direction in CRM and CX Blogs by SAP
- Get Started with Embedded SAP Analytics Cloud in SAP Sales & Service Cloud (C4C) in CRM and CX Blogs by SAP
Top kudoed authors
| User | Count |
|---|---|
| 4 | |
| 2 | |
| 2 | |
| 2 | |
| 2 | |
| 1 | |
| 1 | |
| 1 | |
| 1 | |
| 1 |