
- SAP Community
- Products and Technology
- Technology
- Technology Blogs by SAP
- What’s New in SAP Analytics Cloud and SAP Digital ...
Technology Blogs by SAP
Learn how to extend and personalize SAP applications. Follow the SAP technology blog for insights into SAP BTP, ABAP, SAP Analytics Cloud, SAP HANA, and more.
Turn on suggestions
Auto-suggest helps you quickly narrow down your search results by suggesting possible matches as you type.
Showing results for
Product and Topic Expert
Options
- Subscribe to RSS Feed
- Mark as New
- Mark as Read
- Bookmark
- Subscribe
- Printer Friendly Page
- Report Inappropriate Content
02-02-2022
10:35 AM
SAP Analytics Cloud is a single solution for business intelligence (BI), augmented and predictive analytics, and enterprise planning with the power of artificial intelligence and machine learning technology. It helps everyone in your organization make fast, confident decisions.
This blog post highlights the new features and enhancements of SAP Analytics Cloud Q1 2022 Quarterly Release (QRC).
Several improvements have been made when data changes are logged:
Customer system banner notifications can now include optional custom hyperlinks, allowing administrators to provide more information beyond the 140 character banner content limit. (SAP Road Map Explorer) (Video)
Administrators can now customize the shell bar by configuring the default logo in the shell with another logo of the customer's choice. (SAP Road Map Explorer) (Video)
During content export, users can now transport content stored in the Workspace from one SAP Analytics Cloud tenant to another. Both the workspace and objects stored in the workspace can be transported as part of the package. (SAP Road Map Explorer) (Video)
Content creators and consumers can now maintain user variants selections within the variable prompt dialog box. This is a pure BW feature that can be used in design and view mode of a Story, Analytic Application, and Data Analyzer. (SAP Road Map Explorer) (Video)
Different functions for Variants include:
Optimized View Mode now supports Manual PDF Export.
The following export options are available:
For more information on Optimized View Mode, check out the following resources:
Support has been added to the new model for identifying missing currency conversion rates:
Calendar process notifications have been simplified. Upon activation of a calendar process, users who are involved in the process as well as its child events will now receive only one notification instead of notifications for each event. The email notification contains a list of all events that are relevant for the user and specifies their roles.
In advanced formulas, the flexibility and ability to define the scope of a linked model has been improved. The MODEL/ENDMODEL and MEMBERSET statement can be used to define scope of reference models. In combination with the definition of the linked model scope, dimensions existing only in the linked model but not in the default model (missing dimensions) can be omitted in the definition of the LINK function. (SAP Road Map Explorer) (Video)
Once the linked model scope is defined:
Mass Data Entry mode has been enhanced. All calculations that have been created via ‘add column’ and/or ‘add row’ and have been modeled using the formula bar are affected. When Mass Data Entry mode is active, formulas will recalculate automatically upon data entry and changes can be shown immediately. (SAP Road Map Explorer)
Multiple parent/child account hierarchies are now supported, simplifying plan modeling and enabling more flexibility to support management reporting requirements. This is supported for the Account model and New model. (SAP Road Map Explorer) (Video)
SAP Analytics Cloud mobile app is now certified to work on Android 12.
The SAP Analytics Cloud iOS SDK now supports Xcode 13. The introduction of XCode 13 support makes the app future-ready for upcoming iOS releases, fulfilling App store review guidelines and creating a base for leveraging new XCode/iOS features.
The SAP Analytics Cloud mobile app for Android now supports proxy settings via MDM allowing customers to securely split internet traffic inside the VPN tunnel.
Smart Predict is now able to combine piecewise trend and data sources influencers within the same forecasting model. This further improves the handling of disrupted time series, the overall forecast quality is improved, and the explanations become more intuitive.
Analytic designers can now use the navigation panel for analytic applications that run on bigger mobile devices such as tablets and iPad. This allows users to perform ad-hoc analysis on the table, such as adding or removing dimensions and measures.
The navigation panel is supported in the SAP Analytics Cloud mobile app, and in Safari browser. Smaller devices, like smart phones, are not fully supported for the time being. (SAP Road Map Explorer) (Video)
Application designers can now build more performant and optimized analytic applications faster thanks to performance optimization tips displayed during design time. (SAP Road Map Explorer) (Video)
Related best practices include:
Application designers assigned with the corresponding privileges can now copy private bookmarks when saving or copying analytic applications. (SAP Road Map Explorer) (Video)
The Linked Analysis Diagram has been renamed to Linked Widgets Diagram as it can now visualize more than linked analysis and filter line relationships.
Application designers can now manage cascading relationships between input controls through the Linked Widget Diagram. Users can have a graphic view of relationships among input controls, namely cascading effects, and edit related settings directly on the diagram. (SAP Road Map Explorer) (Video)
Application designers now have the ability to link dimensions and blend data from multiple sources. A primary data source with secondary data sources that contain common dimensions can be joined. Additionally, charts and tables can be defined based on a blended data source, as well as filters that can simultaneously update all the charts and tables with a linked dimension. Lastly, Script APIs are available for blended charts or tables, while they work only on the primary data source. (SAP Road Map Explorer) (Video)
Custom Widgets developers now have more flexibility to define their own API type for data structure to cover their scenario by creating custom data types.
The ability to select or deselect all measure has been greatly improved. Users can now quickly select and deselect all measures with one click via the “Select All” checkbox in the builder panel. (SAP Road Map Explorer) (Video)
Advanced options are now available when saving an insight in Data Analyzer. Users can choose to keep the last saved values for dynamic variables and allow the variable prompt dialog to open when opening an insight. These additional settings provide end users with more flexibility in customizing variable settings. (SAP Road Map Explorer) (Video)
SAP Analytics Cloud folder structure is now supported in the Select Data Source dialog. The enhanced search feature highlights a respective models exact folder location for easy access.
Keyboard shortcuts can be used on desktop versions of Excel to make reporting, and planning data entry faster. The shortcuts are available for Windows and Mac. (SAP Road Map Explorer) (Video)
Users can now switch on/off zero suppression to hide cells with zero value.
Users can use and define specific cell formatting in a Microsoft Excel grid as percentage, decimal, or currency displays. (SAP Road Map Explorer)
Users can now choose to refresh selective, or an individual table as opposed to all tables in a workbook. This enables users to refresh certain tables while continuing to update another table. (SAP Road Map Explorer) (Video)
Report creation can be accelerated with the ability to use cell-based formulas to set dedicated filters on a dimension's members from a Microsoft Excel grid. This simplifies tasks such as retrieving data directly in the Excel grid without the need to use the right-side panel as in the past. (SAP Road Map Explorer)
Additional flexibility has been added to make it easier and quicker to select on specific members. In addition to the existing options (e.g., descendants only, self only, etc.), users can now select only the leaf member of a particular node, simplifying the steps for adding data at the lowest level of a hierarchy of a dimension. (SAP Road Map Explorer) (Video)
Workbooks can be designed with a prompt screen that allows end users to restrict result sets or to change currency conversion applied as desired. (SAP Road Map Explorer) (Video)
Schedule owners can send personalized publications through e-mail, based on the recipient’s data-authorization settings. (SAP Road Map Explorer) (Video)
Visit the SAP Analytics Cloud Help Portal for more information on scheduling publications.
When a user is tagged in a page or widget comment with the “@User” notation, delivery of an e-mail notification is sent that they have received a comment, providing both the comment details and a link to open the story where the comment was added. As a result, users will receive notice of comments quicker by sending notification by e-mail alert to an external system, as opposed to sending notification only within the SAP Analytics Cloud notifications center. (SAP Road Map Explorer) (Video)
This blog post only provides a high-level overview of the latest features and enhancements of SAP Analytics Cloud. For more details on these features, please visit the SAP Analytics Cloud Help Portal. You can also visit the SAP Roadmap Explorer to see the upcoming features of SAP Analytics Cloud.
This blog post highlights the new features and enhancements of SAP Analytics Cloud Q1 2022 Quarterly Release (QRC).
Release Highlights
- Administration and Service Management
- Administration Cockpit
- Customer Notification Banner Hyperlink
- Disable sharing to “All Users”
- Custom Logo in Shell Bar
- Transport Content Stored in Workspaces
- Data Integration
- Import Connections
- Live Connections to SAP Business Warehouse
- Import Connections
- Dashboard and Story Design
- Data Modeling
- Enterprise Planning
- Keyboard Support for Value Driver Tree Value Entry
- Pasting Empty Cells to Booked Data Cells
- Open API for Data Export
- Handing of Many People in the Calendar Designer Panel
- Calendar Process Notifications
- Enhanced Cross Model Calculation in Advanced Formulas
- Enhancement of Mass Data Entry mode
- Multiple Account Hierarchy Support
- Mobile Analytics
- SAP Analytics Cloud iOS mobile app now supports iOS 15 and iPad OS 15
- Enhanced Support for Analytics Catalog in SAP Analytics Cloud Mobile on iOS
- Android 12 Support with SAP Analytics Cloud Mobile
- XCode 13 support for SAP Analytics Cloud SDK for iOS
- Android App Proxy Support via MDM
- Augmented Analytics
- Smart Predict
- Separation of Influencers from the Trend and Cycles in Time Series Breakdown | More Relevant Calcula...
- Piecewise Trend & Data Source Influencers in the same Forecasting Model
- Predictive Planning
- Smart Predict
- Analytics Catalog
- Analytics Designer
- Generic widget access API
- New Responsive Rule in Flow Layout Panel to Hide Certain Widgets
- Accessing Data Change on the Home Screen
- Navigation Panel Running on Tablets and iPads
- Performance Best Practices at Application Design Time
- Copy Private Bookmarks by Privileged Users
- Linked Widgets Diagram
- Support for Linked Dimensions
- Custom API types supported for Custom Widgets
- Data Exploration
- Microsoft Office Integration
- DWC Integration and Enhanced Open Dialog
- Planning: keep formula on data cell
- Drill-to-Level
- Open Dialog: Folder Structure
- Keyboard Shortcuts
- Zero Suppression
- Define Specific Number Format
- Single Table Refresh
- Set or Retrieve Dedicated Filters on Data
- Hierarchy-based Selection of Leaf Members
- Support Prompt Pop-ups
- User Collaboration
System Administration
Several improvements have been made when data changes are logged:
- If data audit is enabled in the modeler, a log entry with activity “Create” is generated.
- If data audit is disabled in the modeler, a log entry with activity “Delete” is generated (together with the information on how many rows were deleted).
- If in the “Data Changes” dialog, some audit entries were deleted, a log entry with activity “Data Change” is generated, together with some deletion information.
- When a private version is published, a log entry with activity “Data Change” is created, along with some publishing information.
- When facts are deleted in the modeler, a log entry with activity “Data Change” is created, along with some deletion information.
Administration and Service Management
Custom Notification Banner Hyperlink
Customer system banner notifications can now include optional custom hyperlinks, allowing administrators to provide more information beyond the 140 character banner content limit. (SAP Road Map Explorer) (Video)

Custom Logo in Shell Bar
Administrators can now customize the shell bar by configuring the default logo in the shell with another logo of the customer's choice. (SAP Road Map Explorer) (Video)

Transport Content Stored in Workspaces
During content export, users can now transport content stored in the Workspace from one SAP Analytics Cloud tenant to another. Both the workspace and objects stored in the workspace can be transported as part of the package. (SAP Road Map Explorer) (Video)

Data Integration
Live Connections to SAP Business Warehouse
BW Save Query Variants
Content creators and consumers can now maintain user variants selections within the variable prompt dialog box. This is a pure BW feature that can be used in design and view mode of a Story, Analytic Application, and Data Analyzer. (SAP Road Map Explorer) (Video)
Different functions for Variants include:
- Save (Creating) variants
- Overwrite variants
- Manage variants
- Delete variants

Dashboard and Story Design
Export stories to PDF format from Optimized View Mode
Optimized View Mode now supports Manual PDF Export.
The following export options are available:
- Insert Appendix
- Export All Pages OR Range

For more information on Optimized View Mode, check out the following resources:
Data Modeling
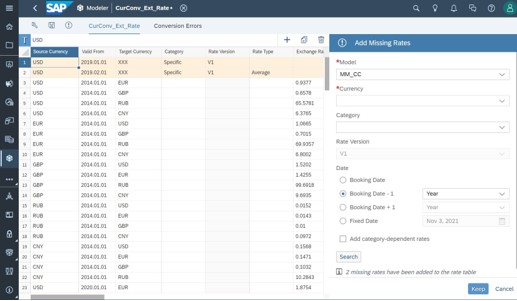
New Model support for identifying missing currency conversion rates
Support has been added to the new model for identifying missing currency conversion rates:
- There is improved error handling for new models with currency conversion
- Users can trigger a missing rate analysis with required parameters directly from an error pop-up in stories
- Conversion errors in tables based on new models are now logged in the rate table’s conversion error log

Enterprise Planning
Calendar Process Notifications
Calendar process notifications have been simplified. Upon activation of a calendar process, users who are involved in the process as well as its child events will now receive only one notification instead of notifications for each event. The email notification contains a list of all events that are relevant for the user and specifies their roles.
Enhanced Cross Model Calculation in Advanced Formulas
In advanced formulas, the flexibility and ability to define the scope of a linked model has been improved. The MODEL/ENDMODEL and MEMBERSET statement can be used to define scope of reference models. In combination with the definition of the linked model scope, dimensions existing only in the linked model but not in the default model (missing dimensions) can be omitted in the definition of the LINK function. (SAP Road Map Explorer) (Video)
Once the linked model scope is defined:
- Use dimensions and attributes from a linked model in the IF or FOREACH scope.
- Use the LINK function to return a certain range of data from the linked model and redirect the calculation scope of the default model by using attributes of dimensions from the linked model in the DATA function.


Enhancement of Mass Data Entry mode
Mass Data Entry mode has been enhanced. All calculations that have been created via ‘add column’ and/or ‘add row’ and have been modeled using the formula bar are affected. When Mass Data Entry mode is active, formulas will recalculate automatically upon data entry and changes can be shown immediately. (SAP Road Map Explorer)

Multiple Account Hierarchy Support
Multiple parent/child account hierarchies are now supported, simplifying plan modeling and enabling more flexibility to support management reporting requirements. This is supported for the Account model and New model. (SAP Road Map Explorer) (Video)

Mobile Analytics
Android 12 Support with SAP Analytics Cloud Mobile
SAP Analytics Cloud mobile app is now certified to work on Android 12.
XCode 13 support for SAP Analytics Cloud SDK for iOS
The SAP Analytics Cloud iOS SDK now supports Xcode 13. The introduction of XCode 13 support makes the app future-ready for upcoming iOS releases, fulfilling App store review guidelines and creating a base for leveraging new XCode/iOS features.
Android App Proxy Support via MDM
The SAP Analytics Cloud mobile app for Android now supports proxy settings via MDM allowing customers to securely split internet traffic inside the VPN tunnel.

Augmented Analytics
Smart Predict
Piecewise Trend & Data Source Influencers in the same Forecasting Model
Smart Predict is now able to combine piecewise trend and data sources influencers within the same forecasting model. This further improves the handling of disrupted time series, the overall forecast quality is improved, and the explanations become more intuitive.

Analytics Designer
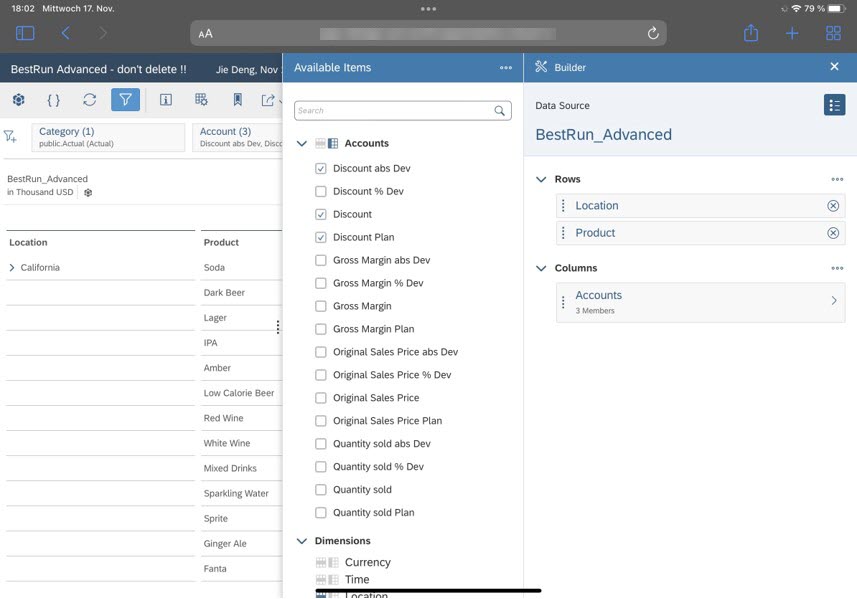
Navigation Panel Running on Tablets and iPads
Analytic designers can now use the navigation panel for analytic applications that run on bigger mobile devices such as tablets and iPad. This allows users to perform ad-hoc analysis on the table, such as adding or removing dimensions and measures.
The navigation panel is supported in the SAP Analytics Cloud mobile app, and in Safari browser. Smaller devices, like smart phones, are not fully supported for the time being. (SAP Road Map Explorer) (Video)
Performance Best Practices at Application Design Time
Application designers can now build more performant and optimized analytic applications faster thanks to performance optimization tips displayed during design time. (SAP Road Map Explorer) (Video)
Related best practices include:
- Enabling optimized view mode
- Collapsing input controls
- Manually setting Top N
- Keeping images small

Copy Private Bookmarks by Privileged Users
Application designers assigned with the corresponding privileges can now copy private bookmarks when saving or copying analytic applications. (SAP Road Map Explorer) (Video)

Linked Widgets Diagram
The Linked Analysis Diagram has been renamed to Linked Widgets Diagram as it can now visualize more than linked analysis and filter line relationships.
Application designers can now manage cascading relationships between input controls through the Linked Widget Diagram. Users can have a graphic view of relationships among input controls, namely cascading effects, and edit related settings directly on the diagram. (SAP Road Map Explorer) (Video)

Support for Linked Dimensions
Application designers now have the ability to link dimensions and blend data from multiple sources. A primary data source with secondary data sources that contain common dimensions can be joined. Additionally, charts and tables can be defined based on a blended data source, as well as filters that can simultaneously update all the charts and tables with a linked dimension. Lastly, Script APIs are available for blended charts or tables, while they work only on the primary data source. (SAP Road Map Explorer) (Video)

Custom API types supported for Custom Widgets
Custom Widgets developers now have more flexibility to define their own API type for data structure to cover their scenario by creating custom data types.

Data Exploration
Select or Deselect all Measures
The ability to select or deselect all measure has been greatly improved. Users can now quickly select and deselect all measures with one click via the “Select All” checkbox in the builder panel. (SAP Road Map Explorer) (Video)

Save Insight with Advanced Options
Advanced options are now available when saving an insight in Data Analyzer. Users can choose to keep the last saved values for dynamic variables and allow the variable prompt dialog to open when opening an insight. These additional settings provide end users with more flexibility in customizing variable settings. (SAP Road Map Explorer) (Video)

Microsoft Office Integration
Open Dialog: Folder Structure
SAP Analytics Cloud folder structure is now supported in the Select Data Source dialog. The enhanced search feature highlights a respective models exact folder location for easy access.

Keyboard Shortcuts
Keyboard shortcuts can be used on desktop versions of Excel to make reporting, and planning data entry faster. The shortcuts are available for Windows and Mac. (SAP Road Map Explorer) (Video)

Zero Suppression
Users can now switch on/off zero suppression to hide cells with zero value.

Define Specific Number Format
Users can use and define specific cell formatting in a Microsoft Excel grid as percentage, decimal, or currency displays. (SAP Road Map Explorer)
Single Table Refresh
Users can now choose to refresh selective, or an individual table as opposed to all tables in a workbook. This enables users to refresh certain tables while continuing to update another table. (SAP Road Map Explorer) (Video)

Set or Retrieve Dedicated Filters on Data
Report creation can be accelerated with the ability to use cell-based formulas to set dedicated filters on a dimension's members from a Microsoft Excel grid. This simplifies tasks such as retrieving data directly in the Excel grid without the need to use the right-side panel as in the past. (SAP Road Map Explorer)

Hierarchy-based Selection of Leaf Members
Additional flexibility has been added to make it easier and quicker to select on specific members. In addition to the existing options (e.g., descendants only, self only, etc.), users can now select only the leaf member of a particular node, simplifying the steps for adding data at the lowest level of a hierarchy of a dimension. (SAP Road Map Explorer) (Video)

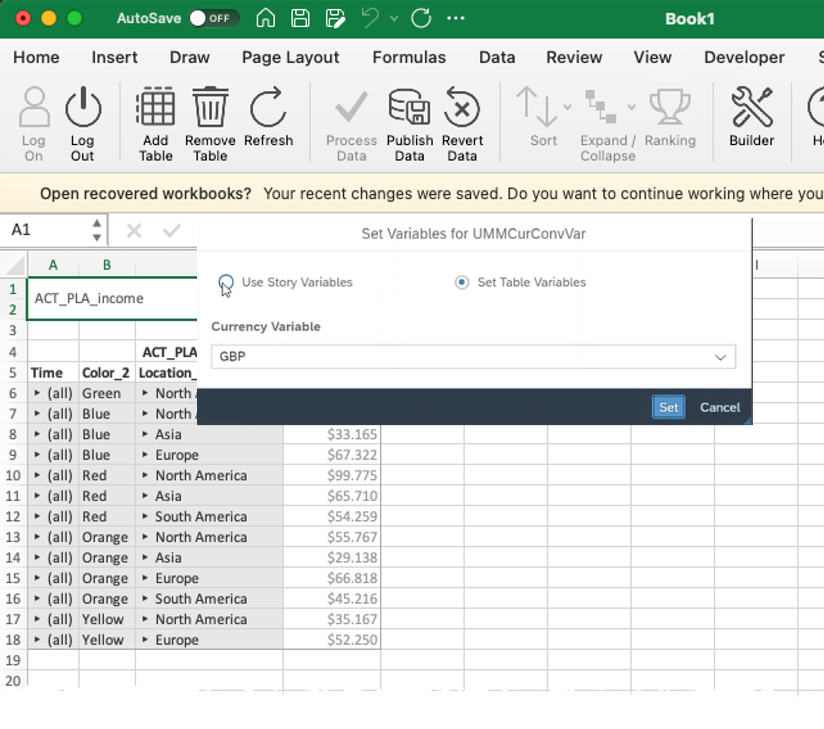
Support Prompt Pop-up Screen
Workbooks can be designed with a prompt screen that allows end users to restrict result sets or to change currency conversion applied as desired. (SAP Road Map Explorer) (Video)
User Collaboration
Bursting Publications on Recipient-based Authorization
Schedule owners can send personalized publications through e-mail, based on the recipient’s data-authorization settings. (SAP Road Map Explorer) (Video)
- Respect Access restrictions with acquired data models
- Respect access restrictions on live data models
- Respect profile settings of recipients such as language preferences and formatting
- For non-SAP Analytics Cloud Users – Schedule owners data authorizations would be respected

Visit the SAP Analytics Cloud Help Portal for more information on scheduling publications.
Notifications for Widget Comments
When a user is tagged in a page or widget comment with the “@User” notation, delivery of an e-mail notification is sent that they have received a comment, providing both the comment details and a link to open the story where the comment was added. As a result, users will receive notice of comments quicker by sending notification by e-mail alert to an external system, as opposed to sending notification only within the SAP Analytics Cloud notifications center. (SAP Road Map Explorer) (Video)

This blog post only provides a high-level overview of the latest features and enhancements of SAP Analytics Cloud. For more details on these features, please visit the SAP Analytics Cloud Help Portal. You can also visit the SAP Roadmap Explorer to see the upcoming features of SAP Analytics Cloud.
Labels:
15 Comments
You must be a registered user to add a comment. If you've already registered, sign in. Otherwise, register and sign in.
Labels in this area
-
ABAP CDS Views - CDC (Change Data Capture)
2 -
AI
1 -
Analyze Workload Data
1 -
BTP
1 -
Business and IT Integration
2 -
Business application stu
1 -
Business Technology Platform
1 -
Business Trends
1,658 -
Business Trends
93 -
CAP
1 -
cf
1 -
Cloud Foundry
1 -
Confluent
1 -
Customer COE Basics and Fundamentals
1 -
Customer COE Latest and Greatest
3 -
Customer Data Browser app
1 -
Data Analysis Tool
1 -
data migration
1 -
data transfer
1 -
Datasphere
2 -
Event Information
1,400 -
Event Information
66 -
Expert
1 -
Expert Insights
177 -
Expert Insights
299 -
General
1 -
Google cloud
1 -
Google Next'24
1 -
Kafka
1 -
Life at SAP
780 -
Life at SAP
13 -
Migrate your Data App
1 -
MTA
1 -
Network Performance Analysis
1 -
NodeJS
1 -
PDF
1 -
POC
1 -
Product Updates
4,577 -
Product Updates
344 -
Replication Flow
1 -
RisewithSAP
1 -
SAP BTP
1 -
SAP BTP Cloud Foundry
1 -
SAP Cloud ALM
1 -
SAP Cloud Application Programming Model
1 -
SAP Datasphere
2 -
SAP S4HANA Cloud
1 -
SAP S4HANA Migration Cockpit
1 -
Technology Updates
6,873 -
Technology Updates
422 -
Workload Fluctuations
1
Related Content
- IoT - Ultimate Data Cyber Security - with Enterprise Blockchain and SAP BTP 🚀 in Technology Blogs by Members
- 体验更丝滑!SAP 分析云 2024.07 版功能更新 in Technology Blogs by SAP
- 10+ ways to reshape your SAP landscape with SAP BTP - Blog 4 Interview in Technology Blogs by SAP
- 10+ ways to reshape your SAP landscape with SAP Business Technology Platform – Blog 4 in Technology Blogs by SAP
- Sneak Peek in to SAP Analytics Cloud release for Q2 2024 in Technology Blogs by SAP
Top kudoed authors
| User | Count |
|---|---|
| 40 | |
| 25 | |
| 17 | |
| 13 | |
| 7 | |
| 7 | |
| 7 | |
| 6 | |
| 6 | |
| 6 |