About the Author
I am a Product Owner for SAP PLM Process Industries, helping customers and defining requirements towards the development team.
Related blog posts
Part 1 -
Basic concept
Part 2 -
Layouts, per stream calculation, not maintained data and nutrients
Part 3 -
Composition, Cost, Intra-formula contribution calculations, losses
Part 4 -
Scaling, exporting, PO limits, Energy based contribution
1 Introduction
This guide is meant to give an overview on the C
ontribution view within SAP PLM Recipe Development. As the content would be too much for a single blog post I separated it into smaller chunks (see above). I will focus on to describing the functionalities that are available there and to give some hints on how to start working with it. I will also mention some important aspects from my perspective. This guide is not meant to cover all the functionalities in detail. Information also can be found on Help Portal see
here.
2 Prerequisites
Contribution view is introduced with the SAP S/4HANA On-Premise 1909 release thus SAP S/4HANA On-Premise 1909 or later release can be used. PLM Recipe Development with properly configured EHS Specification Management and Recipe Development shall be available. Relevant standard recipe calculations should run (Intra-formula, Cost, Composition, Hierarchical Nutrient, total solids/evaporation) on the existing recipe formula screen.
3 Basic Concept
The main purpose with this screen is to use it as a formulation tool (not just as a data repository). The main target user for it is the formula developer who creates recipe formulas. This guide is focusing on their point of view.
The Contribution view can be found on the recipe screen under Formula > Contribution.

Contribution View (Source SAP)
Contribution view functionalities by design are an integrated part of the recipe screen. What does this mean practically, you may wonder?
This means that certain functions are re-used from other screens. There are objects that are defined/created on other screens, but visualised and used by the contribution view. Good examples are the following:
- Process hierarchy elements: Stage, operation, actions are defined under the process tab, but the actual structure is used by the contribution view to visualise them.
- Key parameters: for contribution calculations are defined in the key parameters header section.
- Cost calculation source types (manual, material, Specification😞 Also defined in the cost tab but are displayed by the contribution view.
The following picture describes the basic concept how the
Contribution view is built

Overview (source SAP)
3.1 “Act” section
This is the part where your actual recipe structure with all the formula items can be seen, organised into process hierarchy nodes. The actual recipe process hierarchy can be defined under the process tab. If you have a flat recipe just with formula items, then it will be a simple list. Quantity, UOM, Component type columns are part of this section as well. These are the columns where you as a formula developer can change values according to your needs.
Suggestion: These columns in this section shall be kept together and fixed (always visible, cannot be scrolled) in your layout.
You can also notice that the Primary Output line can be found at the bottom of the hierarchy (opposite to the input/output tab where PO is on the top).
3.2 “Analyze” section
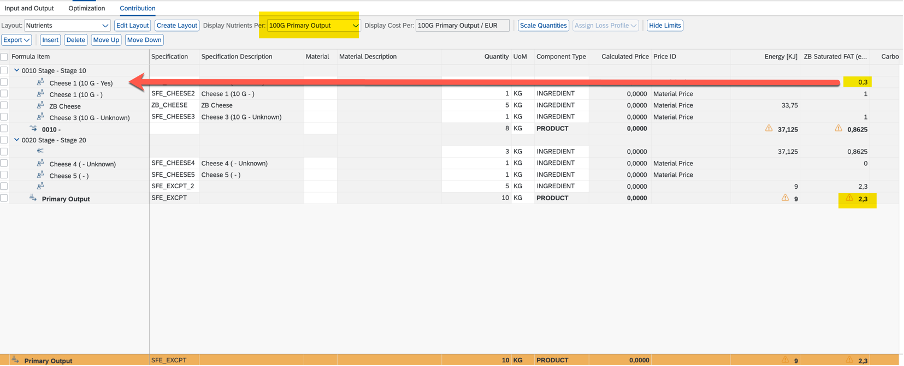
In my opinion this the most beneficial part of the screen. Each individual column here can be defined by the formula developer (via the related user specific layout – will be discussed later), which can give a huge flexibility content wise. You can see here individual nutrients, composition items as columns as well as intra-formula columns (Mass per PO etc.) based on your needs. In the cells you can see what I call
contribution values related to each input ingredient.
Example:
This picture shows how the value shall be read here. Example shows that „
ZB saturated FAT” nutrient has a total of 2.3g in a 100 g of Primary Output where 0.3g (out of it) is coming from the
„Cheese 1 (10g – yes)” ingredient.
Example (Source SAP)
3.3 “Evaluate” section
This where you can see the Primary Output line with all the values related to the reference quantity of the PO and see the min/target/max limit lines per column. These values coming from the Primary Output specification (from upper/lower limits) if they are maintained there.
In my next post functional details will come starting with the layout handling and nutrients. Stay tuned.
