
- SAP Community
- Products and Technology
- Technology
- Technology Blogs by SAP
- Measure your Application's Performance and Resourc...
Technology Blogs by SAP
Learn how to extend and personalize SAP applications. Follow the SAP technology blog for insights into SAP BTP, ABAP, SAP Analytics Cloud, SAP HANA, and more.
Turn on suggestions
Auto-suggest helps you quickly narrow down your search results by suggesting possible matches as you type.
Showing results for
Advisor
Options
- Subscribe to RSS Feed
- Mark as New
- Mark as Read
- Bookmark
- Subscribe
- Printer Friendly Page
- Report Inappropriate Content
12-23-2021
12:26 PM
Imagine that you have designed and implemented this great app your users have been waiting for. But if it is too slow, they will not like it. System administrators will hate it if its resource consumption is too high. How do you know ahead of time that your app offers great functions and also runs fast and lean? You use transaction
In this blog post I explain how you obtain statistics records with high quality and how you analyze them with transaction
As owner and developer of transaction
You can use
Statistics records are logs of activities performed in SAP NetWeaver Application Server for ABAP or on the ABAP platform. During the execution of any task by a work process in an ABAP instance, the SAP kernel collects header information to identify the task, and captures various measurements, like the task’s response time and total memory consumption. When the task ends, the gathered data is combined into a statistics record. These records are stored chronologically in a file in the application server instance’s file system. Collecting statistics records is a technical feature of the ABAP runtime environment and requires no manual effort.
The measurements in these records provide useful insights into the performance and resource consumption of the application whose execution triggered the records’ capture. Especially helpful is the breakdown of the response times of the associated tasks into DB requests, ABAP processing, remote communication, or other contributors.
The value of your performance analysis depends on the quality of the underlying measurements. While the collection of data into the statistics records is performed autonomously by the SAP kernel, you need some preparation to ensure that the captured information accurately reflects the performance of the application.
After this preparation, you execute the measurement run, during which the SAP kernel writes the statistics records that you will use for the analysis.
Under Display Layout, select the domain you want to focus on and how the associated subset of key performance indicators (KPIs)—the captured data—will be arranged in the tabular display of statistics records. The Main KPIs layouts provide an initial overview with the most important data and is a good starting point.
The table lists the selected statistics records in chronological order and contains their main KPIs. The header columns—shown with a blue background—uniquely link each record to the corresponding task that was executed by the work process. The data columns contain the KPIs and indicate the performance and resource consumption of the tasks. Measurements for times and durations are given in milliseconds (ms). Memory consumptions and data transfers are measured in kilobytes (KB).
The table of statistics records is displayed within an ALV grid control and inherits all functions of this SAP GUI tool: You can sort or filter records; rearrange, include, or exclude columns; calculate totals and subtotals; or export the entire list. You can also switch to another display layout or modify the currently used layout. To access these and other standard functions, expand the toolbar by clicking on the Show Standard ALV Functions button (the black triangle that points to the right).
The measurements most relevant for assessing performance and resource consumption are the task’s Response Time and Total Memory Consumption. The Response Time measurement starts on the application server instance when the request enters the dispatcher queue and ends when the response is returned. It does not include navigation or rendering times on the front end, or network times for data transfers between the front end and the back end. It is strictly server Response Time. (Exception: For SAP GUI transactions that use GUI controls, the RFC-based communication with them occurs in roundtrips. Their total time is measured as GUI Time and included in the Response Time. Parts of GUI Time may be contained in Roll Wait Time, the remainder will contribute to Processing Time.) The end-to-end response time experienced by your application’s users may be significantly longer than the server Response Time. The most important contributors to server Response Time are Processing Time (mostly the time it takes for the task’s ABAP statements to be handled in the work process) and DB Request Time (the time that elapses while database requests triggered by the application are processed). In most cases, Total Memory Consumption is identical to the Extended Memory Consumption, but Paging Memory or Heap Memory may also contribute to the total.
From this list of statistics records, using criteria appropriate to your investigation, you find and inspect statistics records for tasks that are too slow or require too many resources.
At the top, it identifies the statistics record via its header data. With the up and down triangles to the left of the header data you can navigate from record to record within this pop-up. The available technical data is grouped into categories, such as Time, DB, or Memory and Data. Use the tabs to switch between categories. Tabs for categories without data for the current statistics record are inactive and grayed out. Documentation is available by single-clicking the field name.
To assess the data captured in a statistics record, consider the purpose that the corresponding task serves.
OLTP (Online Transaction Processing) applications usually spend about 25% of their server Response Time as DB Request Time and the remainder as Processing Time on the application server. For tasks that invoke synchronous RFCs or communication with SAP GUI controls on the front end, associated Roll Wait Time may also contribute significantly to server Response Time. For OLTP applications, the expected end-to-end response time is about 1,000 ms and the typical order of magnitude for Total Memory Consumption is 10,000 KB. Records that show significant upward deviations may indicate a performance problem in your application. You should analyze them carefully and use dedicated analysis tools such as transactions
In comparison, OLAP (Online Analytical Processing) applications typically create more load on the database (absolute as well as relative) and may consume more memory on the application server. Users of OLAP applications may have slightly relaxed demands of their end-to-end response times.
You want to optimize the performance of your applications and you want to ensure their linear scalability. For this you need reliable data that indicates the software’s response times and resource consumption. For ABAP-based applications, this data is contained in the statistics records that the SAP kernel captures automatically for every task handled by a work process. Using this information, you can identify critical steps in an application, determine which component is the bottleneck, and define the best approach for optimization.
The Performance Monitor (transaction
As a developer, and in the interest of your application's users, you are primarily interested in short end-to-end response times, but
Additionally, one of your interactions with the application may trigger multiple HTTP round trips into the ABAP back end. All associated statistics records must be considered for a complete account of the resource consumption, but their attribution is not always straightforward.
To fill these gaps, SAP's UI frameworks (especially SAPUI5 underlying SAP Fiori applications) collect relevant data on the front end and subsequently send it in front-end statistics records to the ABAP back end. There these front-end statistics records can be combined with the corresponding main statistics records.
I will describe the front-end statistics records in a sequel to this blog post. I will also introduce and explain transaction
Parts of this blog post are taken from my SAPinsider article on transaction
Identifying Performance Problems in ABAP Applications
Details on the collection and interpretation of statistics records are explained in SAP Notes:
579462 - Runtime parameter of the statistics collection
8963 - Definition of SAP response time/processing time/CPU time
1063061 - Information about response time in STAD/ST03
364625 - Interpretation of response time in 4.6
552845 - FAQ: RFC Statistics in Transactions ST03/ST03N and STAD
Statistical Records Part 1: Inside STAD
Statistical Records Part 2: RFC Statistics
STATS to evaluate statistics records associated with your application's executions.In this blog post I explain how you obtain statistics records with high quality and how you analyze them with transaction
STATS. In the best case, such an analysis proves that your app combines excellent single user performance with low resource consumption and is scalable. In all other situations, the analysis will indicate the bottleneck where optimizations shall be applied.As owner and developer of transaction
STATS I am more than happy to share tips and tricks that will help you to efficiently work with the tool and to obtain insights into your application's performance.You can use
STATS since SAP NetWeaver 7.40. I am continuously improving it and this blog post presents the tool’s state for SAP NetWeaver 7.57 as of late December 2021.What are Statistics Records?
Statistics records are logs of activities performed in SAP NetWeaver Application Server for ABAP or on the ABAP platform. During the execution of any task by a work process in an ABAP instance, the SAP kernel collects header information to identify the task, and captures various measurements, like the task’s response time and total memory consumption. When the task ends, the gathered data is combined into a statistics record. These records are stored chronologically in a file in the application server instance’s file system. Collecting statistics records is a technical feature of the ABAP runtime environment and requires no manual effort.
The measurements in these records provide useful insights into the performance and resource consumption of the application whose execution triggered the records’ capture. Especially helpful is the breakdown of the response times of the associated tasks into DB requests, ABAP processing, remote communication, or other contributors.
The value of your performance analysis depends on the quality of the underlying measurements. While the collection of data into the statistics records is performed autonomously by the SAP kernel, you need some preparation to ensure that the captured information accurately reflects the performance of the application.
- Ensure that the test system you will use for the measurements is configured and customized correctly.
- Verify that the test system is not under high load from concurrently running processes during your measurements
- Carefully define the test scenario to be executed by your application. It must adequately represent the application’s behavior in production.
- Provide a set of test data that is representative of your productive data. Only then will the business scenario execution resemble everyday use.
- Execute the scenario a few times to fill the buffers and caches of all the involved components (e.g., DB cache, application server’s table buffer, web browser cache). Otherwise, your measurements will not be reproducible, but will be impaired by one-off effects that load data into these buffers and caches. It is then much harder to draw reliable conclusions.
After this preparation, you execute the measurement run, during which the SAP kernel writes the statistics records that you will use for the analysis.
How Do You Analyze Statistics Records?
To display the statistics records of your measurement run, you call transaction STATS. Its start screen (Fig. 1) consists of four areas, where you specify criteria for the subset of statistics records you want to view and analyze.
Figure 1: On the STATS start screen, you define filter conditions for the subset of statistics records you want to analyze, specify from where the records are retrieved, and select the layout of the data display.
In the topmost area, you determine the Monitoring Interval. By default, it extends 10 minutes into the past and 1 minute into the future. Records written during this period are displayed if they fulfill the conditions specified in the other areas of the start screen. Adjust this interval based on the start and end times of your measurement run so that STATS shows as few unrelated records as possible.
In the Record Filter area, you define additional criteria that the records must meet—for example, client, user, or lower thresholds for measurement data, such as response time or memory consumption. Be as specific and restrictive as possible, so that only records relevant for your investigation will be displayed.
By default, statistics records are read from all application instances of the system. In the Configuration section, you can change this to the local instance, or to any subset of instances within the current system. Restricting the statistics records retrieval to the instance (or instances) where the application was executed shortens the runtime of STATS. The option Include Statistics Records from Memory is selected by default, so that STATS will also process records that have not yet been flushed from the memory buffer into the file system.
Under Display Layout, select the domain you want to focus on and how the associated subset of key performance indicators (KPIs)—the captured data—will be arranged in the tabular display of statistics records. The Main KPIs layouts provide an initial overview with the most important data and is a good starting point.
What do You Learn from Statistics Records?
Fig. 2 shows the statistics record display based on the settings specified in the STATS start screen (Fig. 1).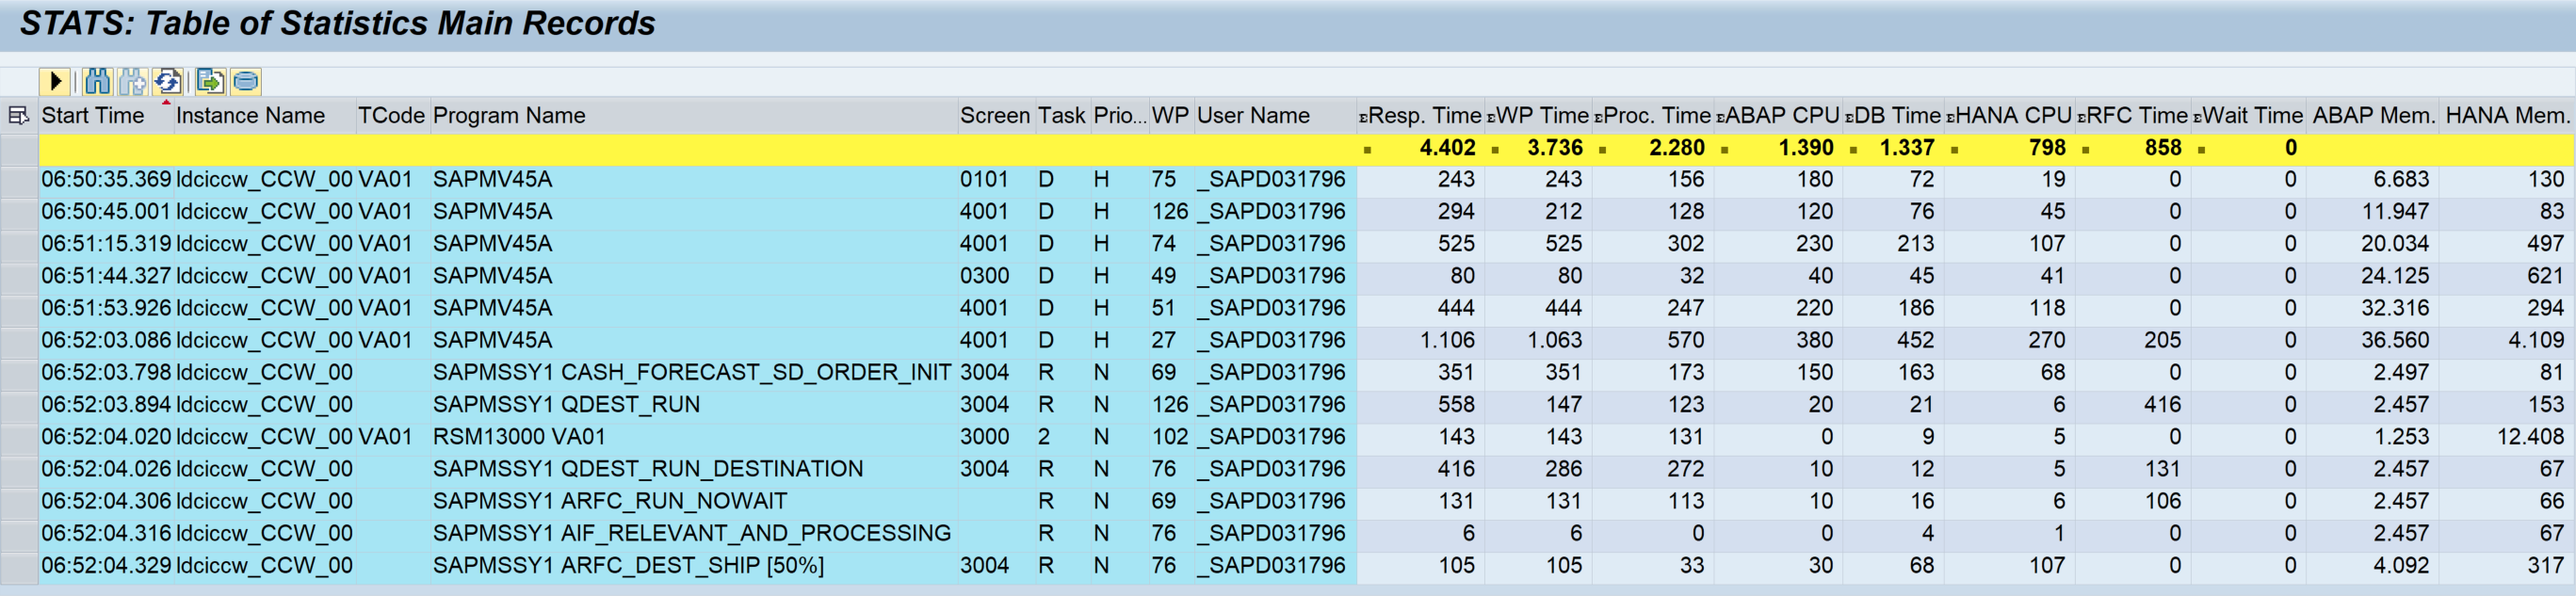
Figure 2: Statistics records matching the criteria specified on the STATS start screen.
The list shows statistics records that correspond to the creation of a sales order with SAP GUI transaction VA01.
The table lists the selected statistics records in chronological order and contains their main KPIs. The header columns—shown with a blue background—uniquely link each record to the corresponding task that was executed by the work process. The data columns contain the KPIs and indicate the performance and resource consumption of the tasks. Measurements for times and durations are given in milliseconds (ms). Memory consumptions and data transfers are measured in kilobytes (KB).
The table of statistics records is displayed within an ALV grid control and inherits all functions of this SAP GUI tool: You can sort or filter records; rearrange, include, or exclude columns; calculate totals and subtotals; or export the entire list. You can also switch to another display layout or modify the currently used layout. To access these and other standard functions, expand the toolbar by clicking on the Show Standard ALV Functions button (the black triangle that points to the right).
The measurements most relevant for assessing performance and resource consumption are the task’s Response Time and Total Memory Consumption. The Response Time measurement starts on the application server instance when the request enters the dispatcher queue and ends when the response is returned. It does not include navigation or rendering times on the front end, or network times for data transfers between the front end and the back end. It is strictly server Response Time. (Exception: For SAP GUI transactions that use GUI controls, the RFC-based communication with them occurs in roundtrips. Their total time is measured as GUI Time and included in the Response Time. Parts of GUI Time may be contained in Roll Wait Time, the remainder will contribute to Processing Time.) The end-to-end response time experienced by your application’s users may be significantly longer than the server Response Time. The most important contributors to server Response Time are Processing Time (mostly the time it takes for the task’s ABAP statements to be handled in the work process) and DB Request Time (the time that elapses while database requests triggered by the application are processed). In most cases, Total Memory Consumption is identical to the Extended Memory Consumption, but Paging Memory or Heap Memory may also contribute to the total.
From this list of statistics records, using criteria appropriate to your investigation, you find and inspect statistics records for tasks that are too slow or require too many resources.
Since even the most basic statistics record contains too much data to include in a tabular display, STATS gives you access to all measurements—most notably the breakdowns of the total server Response Time and the DB Request Time, and the individual contributions to Total Memory Consumption—of a selected record by double-clicking any of its columns. This leads you to an itemized view of the record’s measurements in a pop-up window (Fig. 3).
Figure 3: Pop-up window with all available measurements for a statistics record, subdivided into semantic categories on separate tabs.
At the top, it identifies the statistics record via its header data. With the up and down triangles to the left of the header data you can navigate from record to record within this pop-up. The available technical data is grouped into categories, such as Time, DB, or Memory and Data. Use the tabs to switch between categories. Tabs for categories without data for the current statistics record are inactive and grayed out. Documentation is available by single-clicking the field name.
To assess the data captured in a statistics record, consider the purpose that the corresponding task serves.
OLTP (Online Transaction Processing) applications usually spend about 25% of their server Response Time as DB Request Time and the remainder as Processing Time on the application server. For tasks that invoke synchronous RFCs or communication with SAP GUI controls on the front end, associated Roll Wait Time may also contribute significantly to server Response Time. For OLTP applications, the expected end-to-end response time is about 1,000 ms and the typical order of magnitude for Total Memory Consumption is 10,000 KB. Records that show significant upward deviations may indicate a performance problem in your application. You should analyze them carefully and use dedicated analysis tools such as transactions
ST05 (Performance Trace) or SAT (Runtime Analysis).In comparison, OLAP (Online Analytical Processing) applications typically create more load on the database (absolute as well as relative) and may consume more memory on the application server. Users of OLAP applications may have slightly relaxed demands of their end-to-end response times.
Conclusions
You want to optimize the performance of your applications and you want to ensure their linear scalability. For this you need reliable data that indicates the software’s response times and resource consumption. For ABAP-based applications, this data is contained in the statistics records that the SAP kernel captures automatically for every task handled by a work process. Using this information, you can identify critical steps in an application, determine which component is the bottleneck, and define the best approach for optimization.
The Performance Monitor (transaction
STATS) is a tool for selecting, displaying, and analyzing statistics records. It helps developers and operators find the best balance between fast response times, large data throughput, high concurrency, and low hardware cost. The tool is easy and convenient to use and comes with a feature-rich user interface framework so that you can focus on the data and its interpretation.Outlook
As a developer, and in the interest of your application's users, you are primarily interested in short end-to-end response times, but
STATS focusses very much on server Response Time. Especially for modern browser-based or mobile applications, front-end and network times dominate the total duration of many user interaction steps, but their contributions are not contained in the statistics records.Additionally, one of your interactions with the application may trigger multiple HTTP round trips into the ABAP back end. All associated statistics records must be considered for a complete account of the resource consumption, but their attribution is not always straightforward.
To fill these gaps, SAP's UI frameworks (especially SAPUI5 underlying SAP Fiori applications) collect relevant data on the front end and subsequently send it in front-end statistics records to the ABAP back end. There these front-end statistics records can be combined with the corresponding main statistics records.
I will describe the front-end statistics records in a sequel to this blog post. I will also introduce and explain transaction
STATS_FE as the tool to display and analyze them.References
Parts of this blog post are taken from my SAPinsider article on transaction
STATS:Identifying Performance Problems in ABAP Applications
Details on the collection and interpretation of statistics records are explained in SAP Notes:
579462 - Runtime parameter of the statistics collection
8963 - Definition of SAP response time/processing time/CPU time
1063061 - Information about response time in STAD/ST03
364625 - Interpretation of response time in 4.6
552845 - FAQ: RFC Statistics in Transactions ST03/ST03N and STAD
STATS is the successor of transaction STAD. As both tools work with the very same statistics records, the following two blog posts are still relevant:Statistical Records Part 1: Inside STAD
Statistical Records Part 2: RFC Statistics
Labels:
9 Comments
You must be a registered user to add a comment. If you've already registered, sign in. Otherwise, register and sign in.
Labels in this area
-
ABAP CDS Views - CDC (Change Data Capture)
2 -
AI
1 -
Analyze Workload Data
1 -
BTP
1 -
Business and IT Integration
2 -
Business application stu
1 -
Business Technology Platform
1 -
Business Trends
1,658 -
Business Trends
92 -
CAP
1 -
cf
1 -
Cloud Foundry
1 -
Confluent
1 -
Customer COE Basics and Fundamentals
1 -
Customer COE Latest and Greatest
3 -
Customer Data Browser app
1 -
Data Analysis Tool
1 -
data migration
1 -
data transfer
1 -
Datasphere
2 -
Event Information
1,400 -
Event Information
66 -
Expert
1 -
Expert Insights
177 -
Expert Insights
298 -
General
1 -
Google cloud
1 -
Google Next'24
1 -
Kafka
1 -
Life at SAP
780 -
Life at SAP
13 -
Migrate your Data App
1 -
MTA
1 -
Network Performance Analysis
1 -
NodeJS
1 -
PDF
1 -
POC
1 -
Product Updates
4,577 -
Product Updates
344 -
Replication Flow
1 -
RisewithSAP
1 -
SAP BTP
1 -
SAP BTP Cloud Foundry
1 -
SAP Cloud ALM
1 -
SAP Cloud Application Programming Model
1 -
SAP Datasphere
2 -
SAP S4HANA Cloud
1 -
SAP S4HANA Migration Cockpit
1 -
Technology Updates
6,873 -
Technology Updates
421 -
Workload Fluctuations
1
Related Content
- How to use AI services to translate Picklists in SAP SuccessFactors - An example in Technology Blogs by SAP
- IoT - Ultimate Data Cyber Security - with Enterprise Blockchain and SAP BTP 🚀 in Technology Blogs by Members
- ABAP Cloud Developer Trial 2022 Available Now in Technology Blogs by SAP
- Analyze Expensive ABAP Workload in the Cloud with Work Process Sampling in Technology Blogs by SAP
- SAP Document and Reporting Compliance - 'Colombia' - Contingency Process in Technology Blogs by SAP
Top kudoed authors
| User | Count |
|---|---|
| 38 | |
| 25 | |
| 17 | |
| 13 | |
| 7 | |
| 7 | |
| 7 | |
| 7 | |
| 6 | |
| 6 |