
- SAP Community
- Products and Technology
- Technology
- Technology Blogs by SAP
- Direct Spatial Shape Consumption in SAP Analytics ...
Technology Blogs by SAP
Learn how to extend and personalize SAP applications. Follow the SAP technology blog for insights into SAP BTP, ABAP, SAP Analytics Cloud, SAP HANA, and more.
Turn on suggestions
Auto-suggest helps you quickly narrow down your search results by suggesting possible matches as you type.
Showing results for
stephbutler
Explorer
Options
- Subscribe to RSS Feed
- Mark as New
- Mark as Read
- Bookmark
- Subscribe
- Printer Friendly Page
- Report Inappropriate Content
12-23-2021
7:57 PM
In this blog post, I will share how to transform and store spatial data in SAP HANA Cloud and directly expose into SAP Analytics Cloud using Calculation Views created within SAP Business Application Studio.
Implementation Scenarios
This implementation was based on a scenario where spatial data was collected from 3rd party APIs from IoT devices and sent through SAP Cloud Platform Integration and Node js applications into SAP HANA Cloud.
Once the spatial data was stored in SAP HANA Cloud, it was transformed into meaningful insights.
Pre-requisites
Refer to blog Creating an SAC Geo Map from WebIDE (HDI) based Calculation Views by Ian Henry for setting up a SAP Business Application Studio project with the correct namespace and making sure the system has spatial reference system ID 3857. This is required for SAP Analytics Cloud reporting.
Required Steps
- Transform Location Data
- Create Geo Cube/Dimensional Calculation Views with Shapes
- Create a Live Connection Data model in SAP Analytics Cloud based on Calculation Views
- Create a Geo Map Story
1. Transform Location Data
The spatial data in the SAP HANA Cloud table exists as two separate columns: longitude and latitude.

Figure:1 SAP HANA Cloud Table
The table contains data about truck trips. A truck trip forms a route. In this scenario, we are going to make polygons out of the route. In order to create a polygon the first and last point on the trip have to be identical.
We will be creating a new table to hold the polygon shape data for each truck trip using the datatype ST_GEOMETRY(3857).
CREATE COLUMN TABLE "SPATIAL_PRACTICE"."POLYGONS" (

"TRIP_ID" NVARCHAR(150) NOT NULL ,

"POLYGON" ST_GEOMETRY(3857)

INTERNAL LAYOUT PLAIN SPATIAL INDEX PREFERENCE DEFAULT VALIDATION BASIC BOUNDARY CHECK OFF) UNLOAD PRIORITY 5 AUTO MERGE;
We will use a SELECT statement to get the trip data from the table and using the ST_GeomFromTxt spatial function to string together the longitude and latitude columns to form the polygon shape. The shape will then be inserted into the new table.
Key Points:
- Longitude and latitude points are in SRID 4326. The ST_Transform function converts the points to SRID 3857.
- We added a new column NEWID to the table based off of the original ID column. This column is used in determining the order of points.
INSERT INTO SPATIAL_PRACTICE.POLYGONS (TRIP_ID, POLYGON)

select TRIP_ID, ST_GeomFromText('Polygon((' || STRING_AGG(LONGITUDE || ' ' || LATITUDE, ',' ORDER BY NEWID) || '))', 4326).ST_TRANSFORM(3857)

from SPATIAL_PRACTICE.TRUCK_TRIPS

GROUP BY TRIP_ID;

Figure 2: Example Polygon Shapes
2. Create Geo Cube/Dimensional Calculation Views with Shapes
In the SAP Business Application Studio, create two new calculation views using the new polygon table. One will be a cube and one will be a dimensional view.
2a. Create a Cube Calculation View
This calculation view can be created under the src/Models folder within the database module. A cube view is needed for SAP Analytics Cloud reporting.

Figure 3: Database Module Structure

Figure 4: Polygon Table Added to Calculation View
Since it is a cube, I have added a count measure and used the spatial function ST_AREA() to determine the area of each polygon as well as ST_BUFFER() to add additional area onto the polygon within a calculated column. These spatial functions do not need to be included.
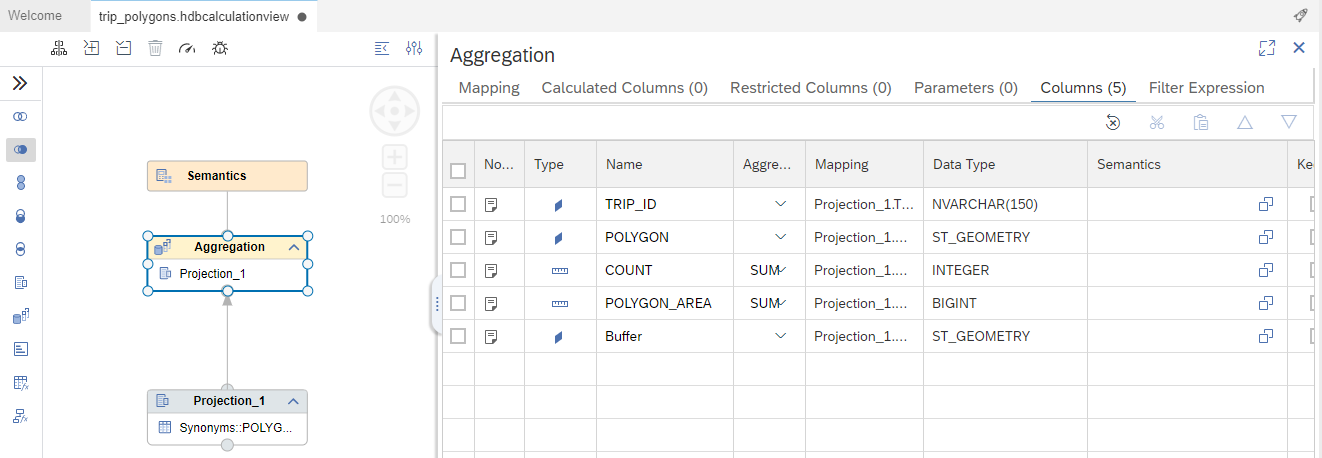
Figure 5: Calculation View with Measures
2b. Create a Dimensional Calculation View
This calculation view needs to be created under the src/SAP_BOC_SPATIAL folder for SAP Analytics Cloud reporting (check pre-requisites).

Figure 6: Polygon Table Added to Calculation View
It is important to change the names and labels of the columns so that they do not match the previous calculation view. This is a limitation when creating a location dimension in SAP Analytics Cloud. No additional columns were added here.

Figure 7: Dimensional Calculation View Output Columns
3. Create a Live Connection Data model in SAP Analytics Cloud based on Calculation Views
Make sure a role has been created in the HDI container for calculation view consumption and assign it to the SAP Analytics Cloud user which is used to create the connection from SAP HANA Cloud to SAP Analytics Cloud.
In SAP Analytics Cloud data modeler, create a live data model and select the cube calculation view.
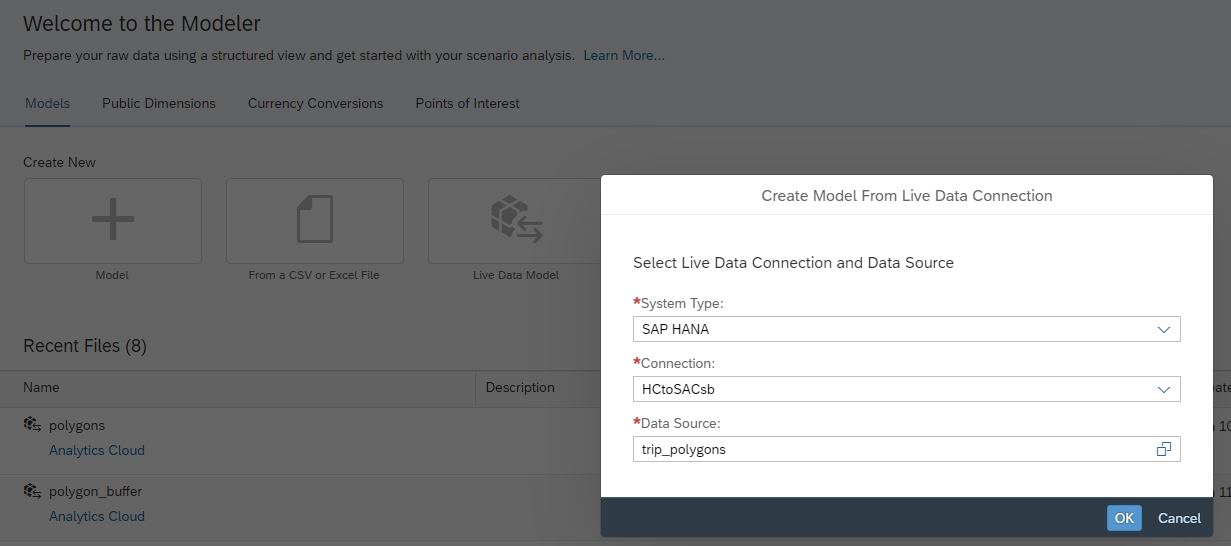
Figure 8: Live Data Model Connection
In the modeler, you can see the measures from the view and all the dimensions.

Figure 9: Measures from Cube Calculation View

Figure 10: Dimensions from Cube Calculation View
Add a location dimension by selecting the trip id from the cube view and choosing the dimensional calculation view. You will notice the Location Dimension Name is the polygon shape. The Location Identifier and the Identifier for Mapping need to be the same column from both calculation views which is used for joining in the model.
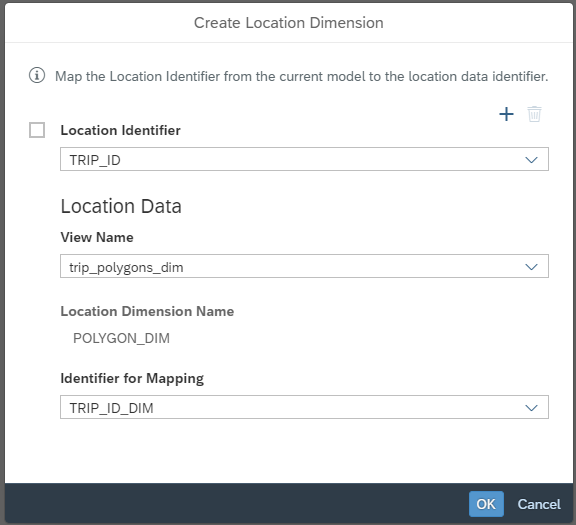
Figure 11: Create a Location Dimension in the Model
4. Create a Geo Map Story
In SAP Analytics Cloud, create a responsive story based on the presentation template. Click the + sign on the map.

Figure 12: SAP Analytics Cloud Responsive Story Template
In Edit and Designer mode, add a layer and choose the live data model we just created.
Choose the Choropleth/Drill layer with Bubbles (remove the hierarchies of the layer).

Figure 13: Remove Default Hierarchies
Under the Location Dimension, add the polygon shape.
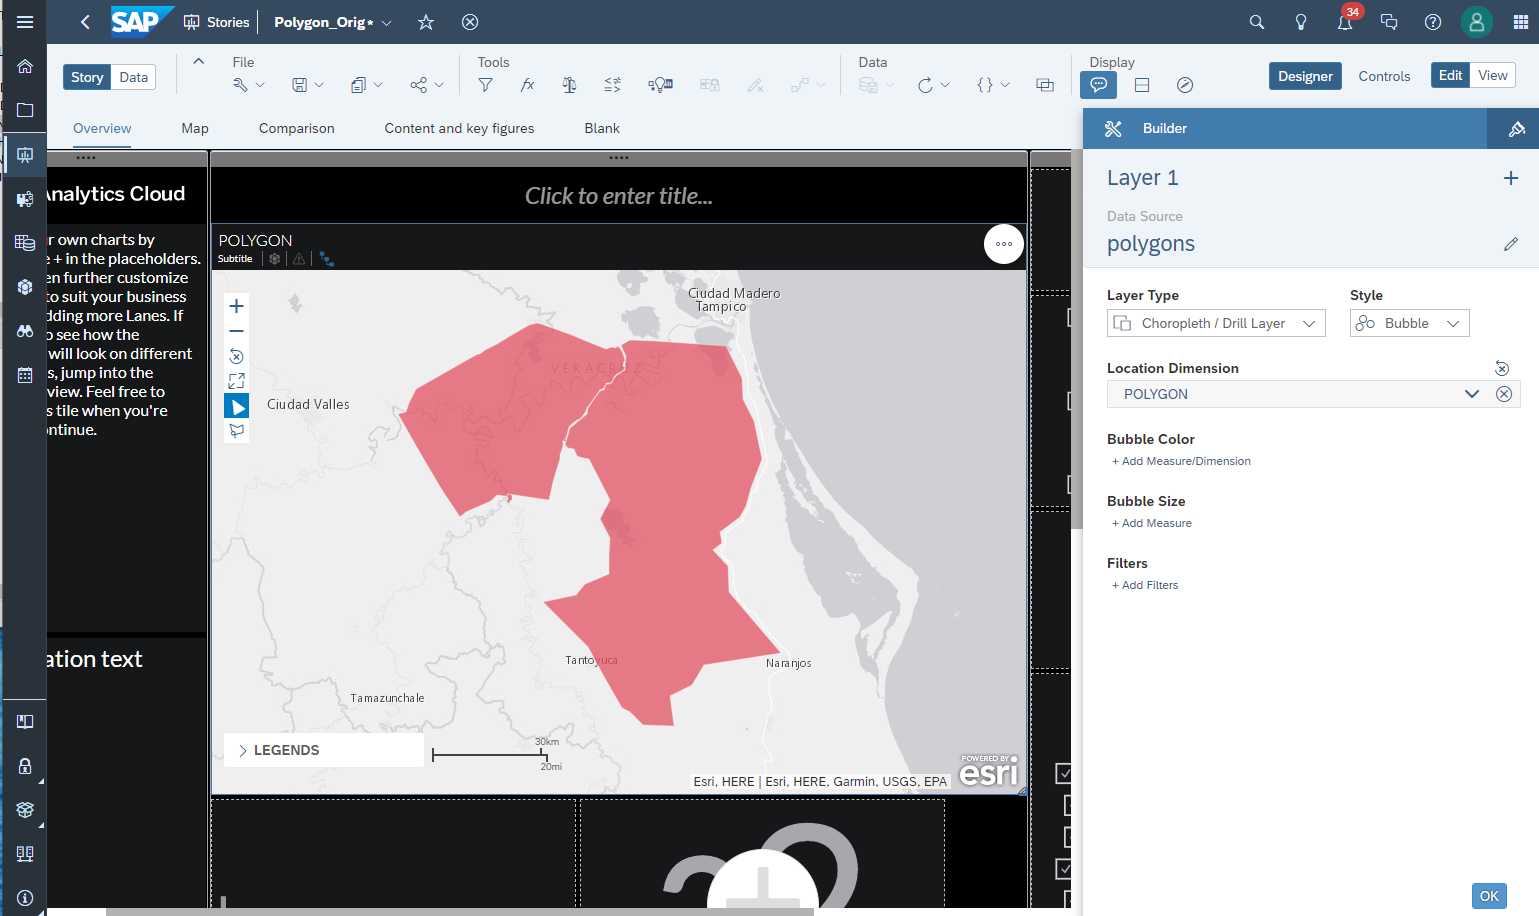
Figure 14: Select Polygon Shape for Location Dimension
You can add measures like POLYGON_AREA to change the colors of the polygons.

Figure 15: Add a Measure to Change Bubble Color
Conclusion
Using the Spatial engine and functions, you now have transformed spatial data into shapes and stored the shapes directly in SAP HANA Cloud. With SAP Business Application Studio you created calculation views that are used in SAP Analytics Cloud for reporting.
Try it out yourself!
If you would like to set up the same in your own environment, refer to the mission “Visualize Truck Routes & Hazards Using Geo Spatial Processing" in the SAP Discovery Center. Instead of direct shape consuming in SAP Analytics Cloud, the mission shows how to create linestrings for truck routes that are not complete polygons. Also, see more about the mission in the blog post Discovery Mission: Visualize Hazards & Truck Routes using SAP HANA Cloud – The Engine for Spatial An... by vivek.rr which highlights another spatial transformation scenario.
Questions?
Please feel free to reach out to me or vivek.rr for any questions related to SAP HANA Spatial topics. You can see additional topics and post questions in the community page, SAP HANA Spatial.
- SAP Managed Tags:
- SAP Business Application Studio,
- SAP HANA Cloud,
- SAP HANA Spatial
Labels:
1 Comment
You must be a registered user to add a comment. If you've already registered, sign in. Otherwise, register and sign in.
Labels in this area
-
ABAP CDS Views - CDC (Change Data Capture)
2 -
AI
1 -
Analyze Workload Data
1 -
BTP
1 -
Business and IT Integration
2 -
Business application stu
1 -
Business Technology Platform
1 -
Business Trends
1,658 -
Business Trends
92 -
CAP
1 -
cf
1 -
Cloud Foundry
1 -
Confluent
1 -
Customer COE Basics and Fundamentals
1 -
Customer COE Latest and Greatest
3 -
Customer Data Browser app
1 -
Data Analysis Tool
1 -
data migration
1 -
data transfer
1 -
Datasphere
2 -
Event Information
1,400 -
Event Information
66 -
Expert
1 -
Expert Insights
177 -
Expert Insights
293 -
General
1 -
Google cloud
1 -
Google Next'24
1 -
Kafka
1 -
Life at SAP
780 -
Life at SAP
13 -
Migrate your Data App
1 -
MTA
1 -
Network Performance Analysis
1 -
NodeJS
1 -
PDF
1 -
POC
1 -
Product Updates
4,577 -
Product Updates
341 -
Replication Flow
1 -
RisewithSAP
1 -
SAP BTP
1 -
SAP BTP Cloud Foundry
1 -
SAP Cloud ALM
1 -
SAP Cloud Application Programming Model
1 -
SAP Datasphere
2 -
SAP S4HANA Cloud
1 -
SAP S4HANA Migration Cockpit
1 -
Technology Updates
6,873 -
Technology Updates
419 -
Workload Fluctuations
1
Related Content
- Support for API Business Hub Enterprise in Actions Project in Technology Blogs by SAP
- How to quantify memory usage of an ABAP instance via Linux commands in Technology Q&A
- How to use AI services to translate Picklists in SAP SuccessFactors - An example in Technology Blogs by SAP
- ABAP Cloud Developer Trial 2022 Available Now in Technology Blogs by SAP
- Analyze Expensive ABAP Workload in the Cloud with Work Process Sampling in Technology Blogs by SAP
Top kudoed authors
| User | Count |
|---|---|
| 35 | |
| 25 | |
| 14 | |
| 13 | |
| 7 | |
| 7 | |
| 6 | |
| 6 | |
| 5 | |
| 5 |