We are fast approaching the end of Calendar Year 2021 and this means that there are developments which became readily available as part of our beloved SAP Profitability and Performance Management 3.0. This time around, I would formally introduce you to the second SAP Note to be included in the forthcoming Support Package 16. This SAP Note 3115700 ,coined with the title, FS-PER Rel. 3.0 SP16: Visual Modeler Screens enhancements and fixes (02) brings enhancements and features for the NEO UI side of the application.
Let’s start with covering the enhancements and improvements for better visualization and user experience across the Studio Application.
Modeling Screen (Read-Only)
- Join Rule Hierarchy Links
Hierarchy links in join are enhanced to provide consistent visualization links in case of several expand and collapse actions on the rules node. This is evident especially if there are several join predicates within the join rules.

- Process Activity Show Results data
Result after execution of process activity has been enhanced to provide data results based on the Process Template executed. Show button provides the data results from this specific process template where parameters and selection, which a user set, is considered.

Process Management Screen (Read-Only)
- Process Default Value Selection
Process Management’s Selection Defaults section in the property panel is now improved to render properly even with many selection conditions.

Visualize Screen/Report Management Screen (Editable)
- Displaying Custom Added values in Value Selection
Value selection is enhanced to consider custom field addition eventhough this is not part of input table.

- Heatmap ChartThis note provides enhancement on displaying different currencies within different heat map areas contained in a heat map chart.


After clicking 'Save All' button, The Report together with all report elements and their updated layout variants is now saved.

Order option in Chart is supplemented to support order in case field data are of numeric nature.


- Keeping drilldown state for visualize/report elements
In this update, Drilldown functionality is augmented to keep the state when chart is re-rendered like changing chart types, changing some configuration and applying the changes. Also, minimizing/maximizing the embedded chart report element in Report Management is considered in keeping drilldown state.

On top of these enhancements and improvements, the note also introduces the following features:
Modeling Screen (Read-Only)


Process Management Screen (Read-Only)
- Overdue indicator showing the current day.
Vertical line containing information of the current day is available.

- Bar fill for in Progress or Completed Process Activities and Nodes
Previously, there is no progress ball fill for processes and it always has the same color without clear information on the current progress based on the bar. This is now enhanced to show progress updates based on the activity updates of all activities.

Visualize Screen/Report Management Screen (Editable)
- Inline image and image alignment options.
- Inline image option is added
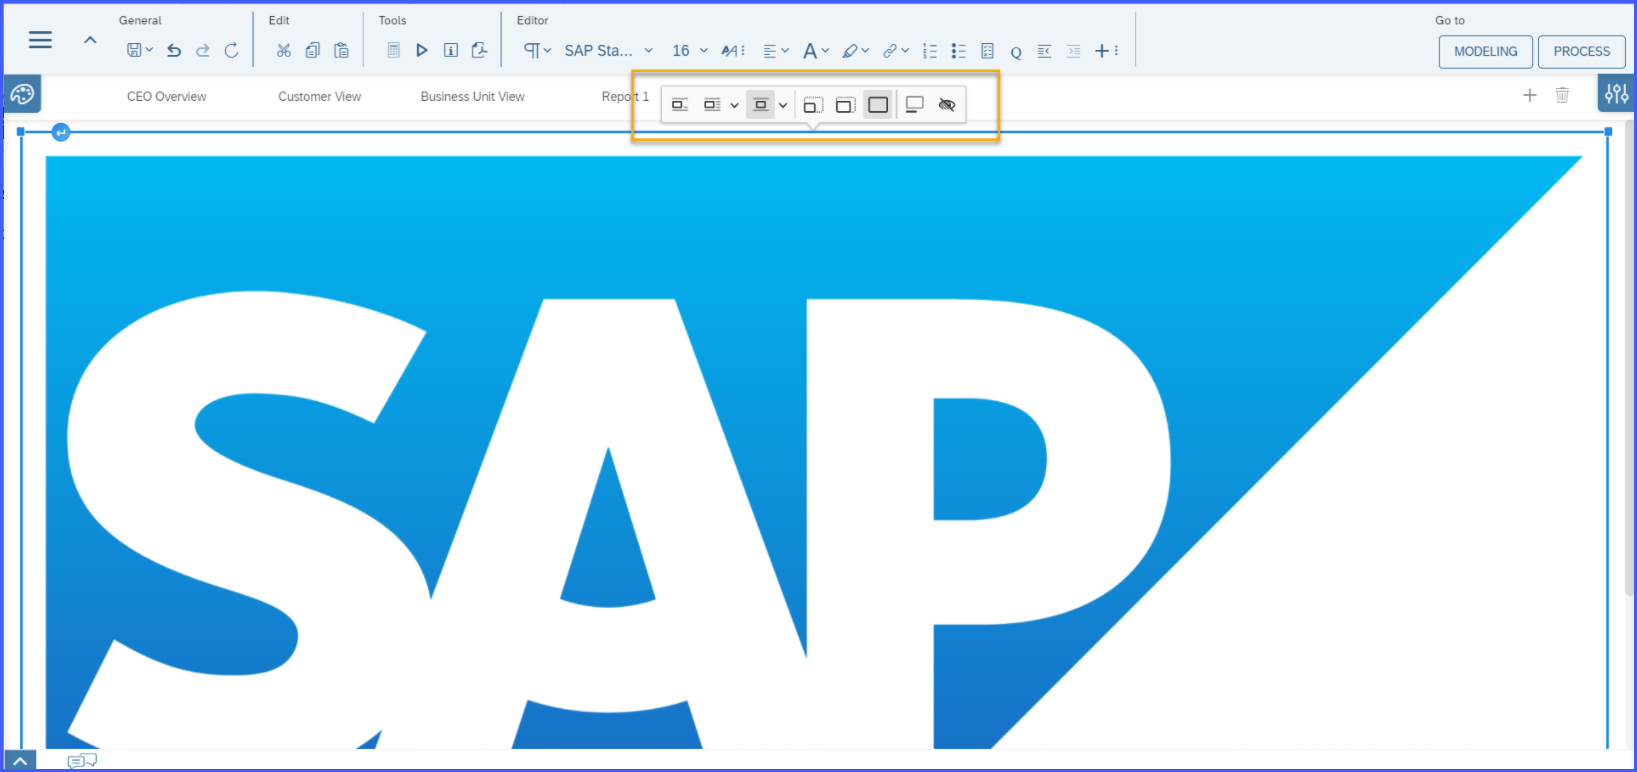
- Wrap text option is now grouped with options Left aligned image and Right Aligned Image

- Break text option is added with options Left aligned image, Center image and Right Aligned Image.

This concludes the recent from the latest Visual Modeler SAP Note 3115700.
Thank you for reading this blog post and we will keep you posted for the next Visual Modeler SAP Note which will contain one of the most awaited feature to date for Visual Modeler!
Until the next blog! Happy holidays!
