
- SAP Community
- Products and Technology
- Technology
- Technology Blogs by SAP
- Webinar Recap: Best Practices for SAP Analytics Cl...
Technology Blogs by SAP
Learn how to extend and personalize SAP applications. Follow the SAP technology blog for insights into SAP BTP, ABAP, SAP Analytics Cloud, SAP HANA, and more.
Turn on suggestions
Auto-suggest helps you quickly narrow down your search results by suggesting possible matches as you type.
Showing results for
stephane_perdig
Member
Options
- Subscribe to RSS Feed
- Mark as New
- Mark as Read
- Bookmark
- Subscribe
- Printer Friendly Page
- Report Inappropriate Content
11-29-2021
3:06 PM
SAP Analytics Cloud is a powerful tool for data visualization, financial planning, and augmented analytics. With the sheer volume of data that many organizations are harnessing insights from today, there can strain on even the most powerful hardware. As with all tools, preventative care and regular maintenance can help keep your SAP Analytics Cloud tenant running smoothly at all times.
The SAP Analytics Cloud Performance Webinar Series was created to help users plan ahead and ensure everything continues to operate smoothly for the lifetime of the story. You can access the on-demand recording of this session here: Best Practices for SAP Analytics Cloud General Troubleshooting webinar
Side note: the above reference to the video (and below timing inside the video) are fully accessible after a quick registration process
As an overall best practice, creating SAP Analytics Cloud stories require some planning to ensure they are best optimized for your workflow. Considerations should be made around analysis, design, development, implementation and evaluation of your data. Often, the trade off for the best performance is usability, content and data volume.
From an administration standpoint for SAP Analytics Cloud, there are a couple key components to keep in mind are:
As the end-user, there are also some practices which may impact your performance, including (but not limited to):
For that it is important to understand the overall SAP Analytics Cloud architecture in order to be able to identify where the bottleneck or performance issues could come from
Starting at 10:49, First I wanted to overview some of the best practices for maintaining optimal performance on the end-user’s perspective. As previously mentioned, your device’s hardware and settings may impact the performance of SAP Analytics Cloud, so ensure you are plugged in (if you are using a laptop), close other system intensive programs, and be mindful of VPN usage.
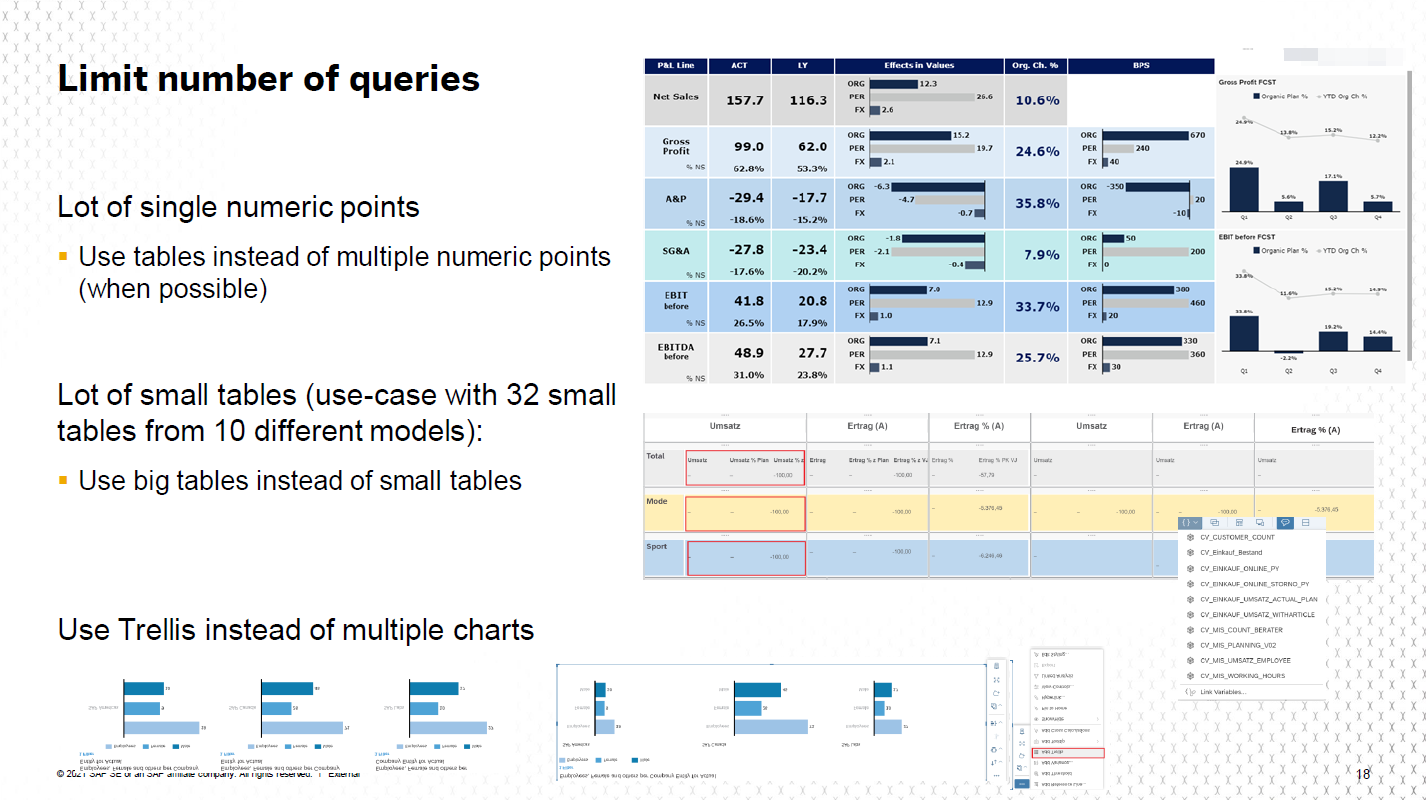
There are many areas covered in the webinar covering the many areas where users can be proactive about performance. One of the key items which may impact many users is limiting the number of queries being processed. An example of limiting queries can be using tables rather than single numeric points or using fewer large tables instead of multiple smaller ones.
Throughout webinar, you can learn more about some of the specific best practices for story design, tables, advanced calculations, calculated dimensions, and restricted measures. However, one quick performance improvement which you can start implementing now in your local SAP Analytics Cloud tenant involves changing some system settings such as
As we continue into the webinar, it is crucial to explain the importance of isolating the root cause of performance issues. There are many factors which can impact performance, including local PC performance, corporate network performance, back-end sizing, model/story design, and heavy calculations.
So, how can we start troubleshooting where the issues are coming from? Some of the common practices recommended by our product experts include:
For SAP Analytics Cloud, using Google Chrome is typically recommended because of its performance and compatibility benefits. Advanced users may also take advantage of the developer tools by pressing F12 to identify long running actions which may impact the speed of your tenant.
From 25:20 through 44:52 in the webinar, you will find an in-depth explanation of some of the best practices for performance diagnostics. This includes the use of the SAP Analytics Cloud Performance Analysis Tool, which you can find further information on in this blog post.
The commitment to usability and performance is a key area which development efforts for SAP Analytics Cloud will be focused on in the upcoming quarters. Though there are many improvements that can be made by the end-user and administrator, we have heard your feedback loud and clear on where the application itself can be improved.
In upcoming releases, expect significant improvements to viewing your visualizations Optimized Story Viewer and Optimized Story Designer. This will drastically lower loading times by improving how dashboard characteristics and workflows are executed, as well increase stability when designing large stories with complex data sets.
More information on the Optimized Story Viewer and Designer on the SAP Analytics Cloud roadmap explorer, in addition to other expected updates for the product.
Though this blog covers some key touchpoints where you can improve performance within your tenant, there is still plenty to expand upon. For a full replay of Best Practices for SAP Analytics Cloud General Troubleshooting, be sure to visit the ON24 webinar page. Here, you will be able to watch the session on demand, as well as download additional resources – including the presentation slides.
For those seeking additional resources, we invite you to look at some of the following:
The SAP Analytics Cloud Performance Webinar Series was created to help users plan ahead and ensure everything continues to operate smoothly for the lifetime of the story. You can access the on-demand recording of this session here: Best Practices for SAP Analytics Cloud General Troubleshooting webinar
Side note: the above reference to the video (and below timing inside the video) are fully accessible after a quick registration process
General Performance Notes
As an overall best practice, creating SAP Analytics Cloud stories require some planning to ensure they are best optimized for your workflow. Considerations should be made around analysis, design, development, implementation and evaluation of your data. Often, the trade off for the best performance is usability, content and data volume.
From an administration standpoint for SAP Analytics Cloud, there are a couple key components to keep in mind are:
- The design of the story – request only what you need and minimize the displayed information to make it easily readable.
- The design of the model – how this has been created and the data sources you are pulling from.
- The number of simultaneous users – ensuring that the correct users have access to as much information as they need.
As the end-user, there are also some practices which may impact your performance, including (but not limited to):
- Software impacting browser performance, such as VPNs
- Number of charts being loaded per page
- Complex calculations being done with a large data set directly in a story
- Number of calculations being done in real-time at the model level
For that it is important to understand the overall SAP Analytics Cloud architecture in order to be able to identify where the bottleneck or performance issues could come from

Front-end Best Practices
Starting at 10:49, First I wanted to overview some of the best practices for maintaining optimal performance on the end-user’s perspective. As previously mentioned, your device’s hardware and settings may impact the performance of SAP Analytics Cloud, so ensure you are plugged in (if you are using a laptop), close other system intensive programs, and be mindful of VPN usage.
There are many areas covered in the webinar covering the many areas where users can be proactive about performance. One of the key items which may impact many users is limiting the number of queries being processed. An example of limiting queries can be using tables rather than single numeric points or using fewer large tables instead of multiple smaller ones.
Throughout webinar, you can learn more about some of the specific best practices for story design, tables, advanced calculations, calculated dimensions, and restricted measures. However, one quick performance improvement which you can start implementing now in your local SAP Analytics Cloud tenant involves changing some system settings such as

Methodology to Analyze Performance Issues
As we continue into the webinar, it is crucial to explain the importance of isolating the root cause of performance issues. There are many factors which can impact performance, including local PC performance, corporate network performance, back-end sizing, model/story design, and heavy calculations.
So, how can we start troubleshooting where the issues are coming from? Some of the common practices recommended by our product experts include:
- Testing with a clean browser to check local memory and CPU usage
- Trying from a different PC to check if the issue persists
- Using a different network
- Opening your tenant under a different user account
- Isolating the problem using Google Developer Tools
- Simplifying the story/workflow as much as possible to analyze less information
For SAP Analytics Cloud, using Google Chrome is typically recommended because of its performance and compatibility benefits. Advanced users may also take advantage of the developer tools by pressing F12 to identify long running actions which may impact the speed of your tenant.

From 25:20 through 44:52 in the webinar, you will find an in-depth explanation of some of the best practices for performance diagnostics. This includes the use of the SAP Analytics Cloud Performance Analysis Tool, which you can find further information on in this blog post.

Upcoming Usability and Performance Improvements
The commitment to usability and performance is a key area which development efforts for SAP Analytics Cloud will be focused on in the upcoming quarters. Though there are many improvements that can be made by the end-user and administrator, we have heard your feedback loud and clear on where the application itself can be improved.
In upcoming releases, expect significant improvements to viewing your visualizations Optimized Story Viewer and Optimized Story Designer. This will drastically lower loading times by improving how dashboard characteristics and workflows are executed, as well increase stability when designing large stories with complex data sets.
More information on the Optimized Story Viewer and Designer on the SAP Analytics Cloud roadmap explorer, in addition to other expected updates for the product.
Learn More About SAP Analytics Cloud Performance Best Practices
Though this blog covers some key touchpoints where you can improve performance within your tenant, there is still plenty to expand upon. For a full replay of Best Practices for SAP Analytics Cloud General Troubleshooting, be sure to visit the ON24 webinar page. Here, you will be able to watch the session on demand, as well as download additional resources – including the presentation slides.
For those seeking additional resources, we invite you to look at some of the following:
- Blog: SAP Analytics Cloud Best Practices for Performance
- KBA: General SAP Performance Troubleshooting Knowledge Base Article
- Help Portal: How to enable http/2 to support multiprocessing in SAC
- Blog: SAP Analytics Cloud Performance Analysis Tool
- Blog: SAP Analytics Cloud Optimized View Mode
- Chrome Developer Tools
- SAP Managed Tags:
- SAP Analytics Cloud,
- SAP Analytics Cloud for planning,
- SAP Analytics Cloud, data modeling
Labels:
You must be a registered user to add a comment. If you've already registered, sign in. Otherwise, register and sign in.
Labels in this area
-
ABAP CDS Views - CDC (Change Data Capture)
2 -
AI
1 -
Analyze Workload Data
1 -
BTP
1 -
Business and IT Integration
2 -
Business application stu
1 -
Business Technology Platform
1 -
Business Trends
1,661 -
Business Trends
88 -
CAP
1 -
cf
1 -
Cloud Foundry
1 -
Confluent
1 -
Customer COE Basics and Fundamentals
1 -
Customer COE Latest and Greatest
3 -
Customer Data Browser app
1 -
Data Analysis Tool
1 -
data migration
1 -
data transfer
1 -
Datasphere
2 -
Event Information
1,400 -
Event Information
65 -
Expert
1 -
Expert Insights
178 -
Expert Insights
280 -
General
1 -
Google cloud
1 -
Google Next'24
1 -
Kafka
1 -
Life at SAP
784 -
Life at SAP
11 -
Migrate your Data App
1 -
MTA
1 -
Network Performance Analysis
1 -
NodeJS
1 -
PDF
1 -
POC
1 -
Product Updates
4,577 -
Product Updates
330 -
Replication Flow
1 -
RisewithSAP
1 -
SAP BTP
1 -
SAP BTP Cloud Foundry
1 -
SAP Cloud ALM
1 -
SAP Cloud Application Programming Model
1 -
SAP Datasphere
2 -
SAP S4HANA Cloud
1 -
SAP S4HANA Migration Cockpit
1 -
Technology Updates
6,886 -
Technology Updates
408 -
Workload Fluctuations
1
Related Content
- Kyma Integration with SAP Cloud Logging. Part 2: Let's ship some traces in Technology Blogs by SAP
- Top Picks: Innovations Highlights from SAP Business Technology Platform (Q1/2024) in Technology Blogs by SAP
- What’s New in SAP Analytics Cloud Release 2024.08 in Technology Blogs by SAP
- explore the business continuity recovery sap solutions on AWS DRS in Technology Blogs by Members
- Deep dive into Q4 2023, What’s New in SAP Cloud ALM for Implementation Blog Series in Technology Blogs by SAP
Top kudoed authors
| User | Count |
|---|---|
| 13 | |
| 11 | |
| 10 | |
| 9 | |
| 9 | |
| 7 | |
| 6 | |
| 5 | |
| 5 | |
| 5 |