
- SAP Community
- Products and Technology
- Enterprise Resource Planning
- ERP Blogs by SAP
- What’s new in business content "Integrated Financi...
Enterprise Resource Planning Blogs by SAP
Get insights and updates about cloud ERP and RISE with SAP, SAP S/4HANA and SAP S/4HANA Cloud, and more enterprise management capabilities with SAP blog posts.
Turn on suggestions
Auto-suggest helps you quickly narrow down your search results by suggesting possible matches as you type.
Showing results for
Product and Topic Expert
Options
- Subscribe to RSS Feed
- Mark as New
- Mark as Read
- Bookmark
- Subscribe
- Printer Friendly Page
- Report Inappropriate Content
11-24-2021
10:31 AM
Introduction
In this blog post I want to share details on our latest updates for the SAP Analytics Cloud business content on Integrated Financial Planning with SAP S/4HANA. The content innovation cycle 22 has been released with wave 2021.20 and is available in your SAP Analytics Cloud tenant. Learn how to import business content from Analytics Content Network (ACN).
When it comes to financial planning with SAP S/4HANA the strategic direction is SAP Analytics Cloud Planning. Take a look at this blog post on how to address fpa challenges with SAP S/4HANA. Integrated Financial Planning with SAP S/4HANA (IFP) serves this strategic direction and provides pre-built business content powered by SAP Analytics Cloud.
The following enhancements have been made to financial planning, which serve the overarching and steady growing concept of xP&A (extended Planning and Analysis).
- Landing page – data flow
- Cross-model add-on for SAP Integrated Business Planning (SAP IBP) Integration
- One-click simulation
- Prepare demo data
- Iterative activity price calculation
Enhancements
Landing page – data flow
We enhanced our SAC landing page story by the data flow graphic representing the overall business content. It is added directly on the entry page “General” and enables you to have the holistic view on our process integration at hand with one click.

Figure 1: IFP landing page – General
Here you see the highlighted area where to find the data flow information link.
The “Data Flow” link will navigate to the data flow tab within the story. See below figure 2.

Figure 2: IFP landing page – data flow information
See immediately how the different planning areas are inter-connected. Click the home icon in the top-right corner to return to the landing page entry screen.
Cross-model add-on for SAP IBP Integration (consensus demand plan)
We often get the question how and especially where to integrate SAP IBP (SAP Integrated Business Planning) in the overall financial planning process. With the cross-model add-on for SAP IBP you can now incorporate the result of the consensus demand plan into your financial plan out-of-the-box.
In detail the supply chain planner calculates the quantities for the consensus demand plan. This result can now be transferred to the sales quantity plan in Integrated Financial Planning. During the transfer additional information on profit center (based on plant and product) and company code (based on plant property) for further processing in finance is derived.
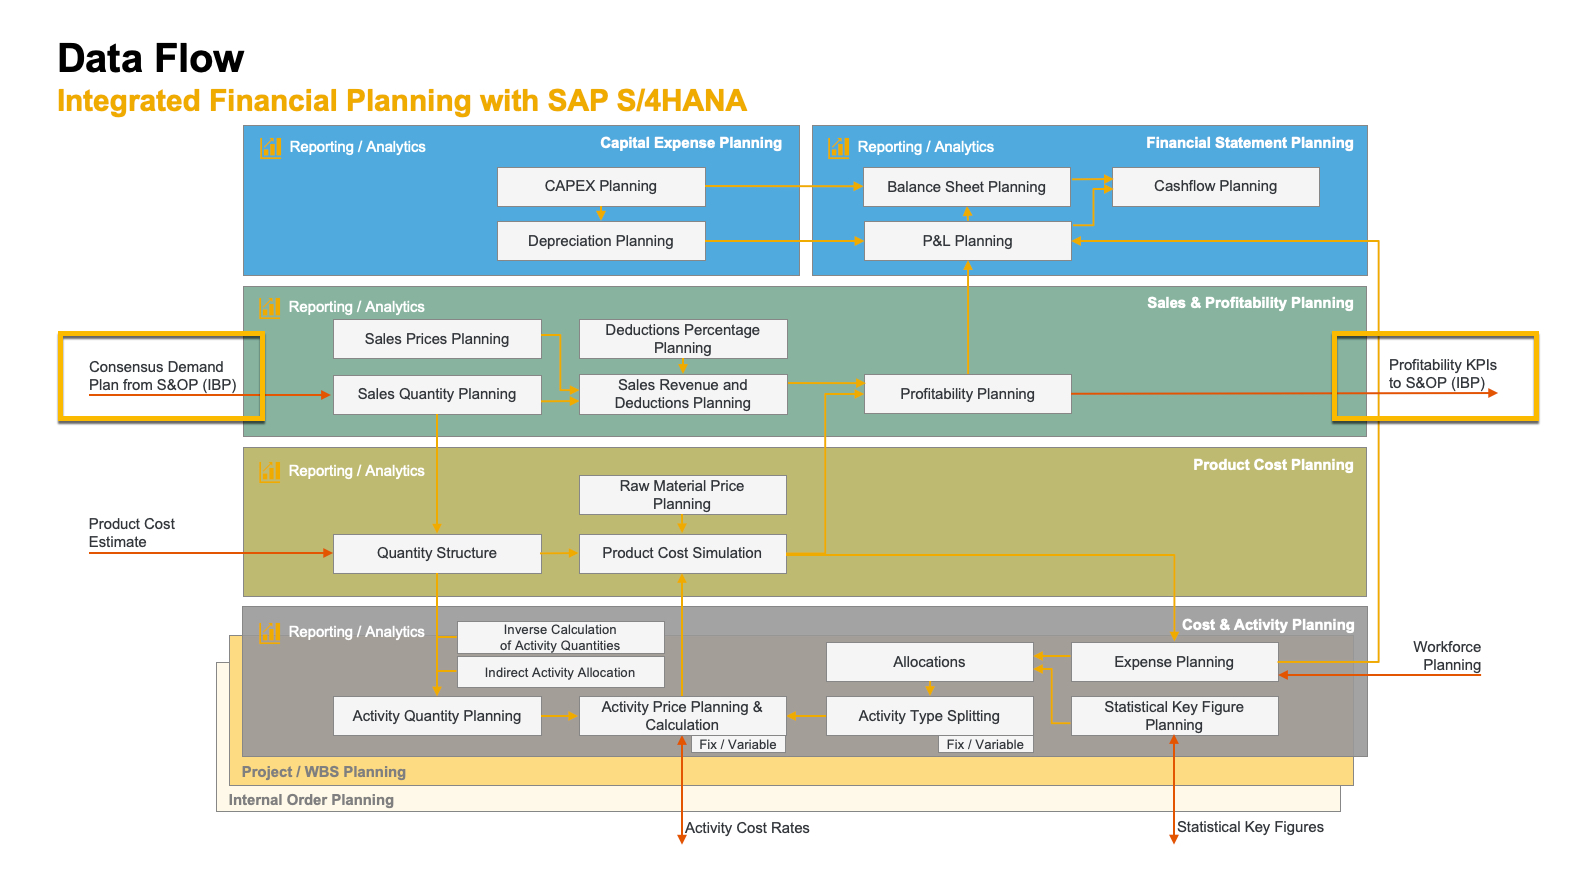
Figure 3: IFP data flow – SAP IBP integration
Finally, you can also retract the updated profitability plan to your SAP IBP system and continue your S&OP specific analysis.
First you need to import the add-on package from ACN to your SAC tenant. Look for package “Add-on for Integrated Financial Planning for SAP S/4HANA”.

Figure 4: Add-on for Integrated Financial Planning
The SAP IBP connection, import job and SAP IBP demand plan version is delivered with the main IFP package already. The add-on package includes a story to copy the imported demand plan figures from SAP IBP to IFP sales & profitability model. In this step also the company code and profit center is derived (and can be reviewed in the story as well). The mapping rules can be imported from SAP S/4HANA using the pre-configured import job – also coming with the add-on content package. Check more details in the documentation on how to import.

Figure 5: Copy demand quantities from SAP IBP
To retract data to SAP IBP you need to create an export job, which is described in full detail in our documentation.
One-click simulation
The simulation cockpit for financial planning in SAP Analytics Cloud allows stakeholders in management or a central controlling department to perform what-if simulations for sample processes based on changing drivers, such as sales quantity or personnel expenses.
Below figure 6 shows 1 of 3 pre-defined simulation scenarios for sales simulation. The orange icons indicate input for drivers, and the blue marked boxes highlight the related processes affected of the changed drivers.

Figure 6: Simulation cockpit – data flow information
With the latest release you can now execute a simulation process with just one click once you have done the changes to your input planning drivers. The result is reflected instantly in all related processes (see data flow information). Click the “Trigger all Data Actions for this Simulation” as shown below (figure 7).

Figure 7: Simulation cockpit – One-click simulation trigger
If you still want to perform a controlled simulation path you can of course follow all steps (tabs), execute isolated data actions, check the intermediate result, and move on.
The feature of the one click approach enhances efficiency and trust in the simulation process. Still the flexibility during a simulation process will remain where required for the planner.
Prepare demo data
The business content comes with sample data already, but in order to create a consistent data set across all processes we now offer the feature called “Prepare Demo Data”. It is included in the simulation cockpit menu and has 2 options.
Option 1: Create sample reference data
This will create sample reference data such as actuals, budget, cost estimate and plan driver value. Keep in mind that existing data will be cleared upfront to ensure a consistent state!
Option 2: Create consistent sample plan version
This will generate a consistent plan version end-to-end. Keep in mind that this will clear existing plan data!! Hence, use this feature very carefully! J
Have a look at figure 8 where to access the feature in the simulation cockpit.

Figure 8: Simulation cockpit – Prepare demo data
Iterative activity price calculation
If cost centers exchange activities to each other the calculation of an activity price becomes tricky. The problem can be reflected as a linear equation system and solved iteratively with the so-called Jacobi method. Go to your preferred search engine and you’ll find plenty of information around it J.
Within the business content we enhanced the data action and advanced formula to calculate the activity price iteratively. Have a look at the cost center story SAP__FI_BPL_COSTCENTER_ACTIVITYPRICE_CALCULATION and open the designer panel for the data action “Calculate Activity Cost Rates”.

Figure 9: Calculate activity cost rates with iteration
As highlighted in figure 9 there is an additional parameter to steer if the activity price calculation should be calculated iteratively. By default this value is set to ‘0’, hence inactive. You can adapt the data action trigger to your needs of the business process to leverage this functionality.
See here a little example with two cost centers that delivery activities to each other to make this more tangible.
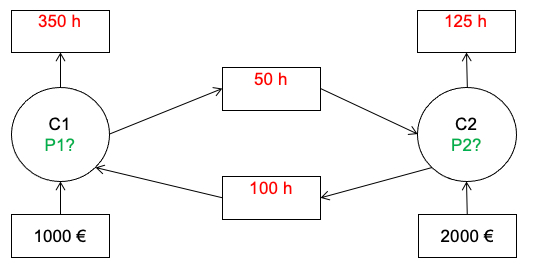
Figure 10: Activity cost rates with iteration – P1 and P2?
The red numbers are the activity quantities from the cost centers (C1, C2) to other cost centers (50, 100) or to the outside (350, 125; cost center = unassigned). Prices P1 and P2 need to be calculated.
Linear equation system:
Total Input = Total Output
1000€ + P2 * 100h = P1 * (350h + 50 h)
2000€ + P1 * 50h = P2 * (125h + 100 h)
The solution is for P1 = 5€/h and P2 = 10€/h.

Figure 11: Activity cost rates with iteration – result for P1 and P2
Figure 11: Activity cost rates with iteration – result for P1 and P2
Solved linear equation system:
1000€ + 10€/h * 100h = 5€/h * (350h + 50 h)
2000€ + 5€/h * 50h = 10€/h * (125h + 100 h)
See below how the figures approach the activity price and the delta between each iteration towards 0.

Figure 12: Activity cost rates with iteration – approximation example
We start with iteration 1 and ignore the internal relation of C1 and C2, but only calculate the price as if it would be delivered “externally” only. With iteration 2 we can now consider the activities between C1 and C2 as there is a price calculated from iteration 1. This process is being repeated until the delta between iteration n and iteration n-1 is below 0.001. The threshold is defined in the advanced formula and can be adjusted if needed as well.
Outlook
These are the enhancements with our latest content package for Integrated Financial Planning.
In 2022 we plan to ship our content fully based on the New Model Type (Get Started with the New Model Type)!
Many thanks for your interest in the topic and I hope you like it. Please share your feedback in the comments and let me know if you have any questions.
Stay tuned and stay healthy,
Christoph
- SAP Managed Tags:
- SAP Analytics Cloud,
- SAP Analytics Cloud for planning,
- SAP S/4HANA Cloud for Finance,
- SAP S/4HANA
Labels:
9 Comments
You must be a registered user to add a comment. If you've already registered, sign in. Otherwise, register and sign in.
Labels in this area
-
Artificial Intelligence (AI)
1 -
Business Trends
363 -
Business Trends
21 -
Customer COE Basics and Fundamentals
1 -
Digital Transformation with Cloud ERP (DT)
1 -
Event Information
461 -
Event Information
24 -
Expert Insights
114 -
Expert Insights
152 -
General
1 -
Governance and Organization
1 -
Introduction
1 -
Life at SAP
415 -
Life at SAP
2 -
Product Updates
4,685 -
Product Updates
208 -
Roadmap and Strategy
1 -
Technology Updates
1,502 -
Technology Updates
88
Related Content
- Manage Supply Shortage and Excess Supply with MRP Material Coverage Apps in Enterprise Resource Planning Blogs by SAP
- The Role of SAP Business AI in the Chemical Industry. Overview in Enterprise Resource Planning Blogs by SAP
- SAP S/4HANA Cloud Extensions with SAP Build Best Practices: An Expert Roundtable in Enterprise Resource Planning Blogs by SAP
- Deep Dive into SAP Build Process Automation with SAP S/4HANA Cloud Public Edition - Retail in Enterprise Resource Planning Blogs by SAP
- SAP Enterprise Support Highlights Resources to Achieve a Clean Core in Enterprise Resource Planning Blogs by SAP
Top kudoed authors
| User | Count |
|---|---|
| 8 | |
| 6 | |
| 5 | |
| 4 | |
| 4 | |
| 3 | |
| 3 | |
| 2 | |
| 2 | |
| 2 |