

- SAP Community
- Products and Technology
- Technology
- Technology Blogs by SAP
- SAP Analytics Cloud - Administration Cockpit
Technology Blogs by SAP
Learn how to extend and personalize SAP applications. Follow the SAP technology blog for insights into SAP BTP, ABAP, SAP Analytics Cloud, SAP HANA, and more.
Turn on suggestions
Auto-suggest helps you quickly narrow down your search results by suggesting possible matches as you type.
Showing results for
Advisor
Options
- Subscribe to RSS Feed
- Mark as New
- Mark as Read
- Bookmark
- Subscribe
- Printer Friendly Page
- Report Inappropriate Content
11-19-2021
9:50 AM
Today I am excited and happy to announce the
SAP Analytics Cloud - Administration Cockpit.
Updates:
QRC Q2 2023 and 2023.07 Release
Admin Cockpit will be renamed to System Overview and join the SAC Menue
SAP Analytics Cloud – System Overview
April 4 2022 - Demo Video
Why an Administration Cockpit?
Authorization assignments regarding user, team, roles, sharing settings of folder, analytic applications, stories, etc., where-used of models, data actions, etc., and questions related to housekeeping can now be identified and reported even more easily.
The Administration Cockpit aims to help the administrators to answer those questions and look behind the curtains. It consists of one main application, the Administration Cockpit itself, which offers the possibility to open the other applications, so-called Fact Sheets. The Administration Cockpit helps to get an overview whereas the Fact Sheet provide detailed information.
When do I get it?
With Wave 2022.01 and 2022.Q1 Quarterly Release the analytic application called SAP Analytics Cloud - Administration Cockpit and 11 corresponding analytic applications called Administration Cockpit | Fact Sheet | * will be released.
Where can I get it?
It will be deployed as default into your system folder into the SAP Analytics Cloud content folder. So there is no need to import it from the Analytics Content Network. Everything will be available out of the box for your convenience. The system folder location was described in 2021.Q1 quarterly release. (Please check SAP Analytics Cloud Performance Analysis Tool for details.)
What's in it?
The content consists of a main application and a folder containing several supporting analytic models and analytic applications.
- SAP Analytics Cloud - Administration Cockpit analytic application
- Administration Cockpit Resources folder:
- RESOURCE
- LIVE_USER
- LICENSE
- RESOURCE_RECENT_ACCESS
- SESSION
- MEMORY_CONSUMPTION
- ERROR_LOG
- ACTIVITY_LOG
- USER_ADOPTION
- Supporting analytic applications
Important Note:
- Please always use the main analytic application SAC_ADMIN_COCKPIT as a starting point to avoid errors.
- Please do not rename the analytic applications to avoid errors.
Administration Cockpit Framework
The main application of the Administration Framework is divided into 11 sections, a section per topic areas. Three of them are already available: SAP Performance Analysis Tool, SAP Performance Statistics and Analysis and the Data Action Statistics and Analysis. These have all been embedded in the last three sections for convenience and remain in their folder unchanged, so no further explanation is needed. Please visit the existing blog post for a refresher.
The new content will now be discussed now one by one:
Home
The “Home” screen and starting point of the Administration Cockpit will be delivered with prebuilt tiles that can adjusted to the administrator’s preferences. The bin at the top right can be used to delete tiles whereas the “plus” opens a popup selection list to add tiles. All the tiles have details charts which open on click and reveal more information.

All predefined tiles open a pop up with detailed information on click.

There is a help sections that gives more details for the tiles contents. It can be opened via the information "i" icon at the top right.

The predefined tiles are:
SAC Sessions – overview of live and active SAP Analytics Cloud Sessions that have been established by the logged-on users.
Passive Sessions – overview of current SAC Sessions that have been established by the logged-on users but are not actively used anymore.
Active Users – List of users that are currently logged on to SAP Analytics Cloud with information about their assigned license.
Users Yet To Logon – List of users that have never logged on to SAP Analytics Cloud.
Session Trend – Historic view on user logons, SAP Analytics Cloud sessions and browser sessions that have been opened during user logons.
License Usage Trend – Historic view on all used licenses. On click pops-up a chart with license usage history per license type.
Concurrent Licenses – Real time number of concurrent licenses and the maximum limit. On click pops-up a chart with logon history for users assigned with this license type.
BI Licenses – Assigned Business Intelligence licenses and their maximum limit. On click pops-up a chart with logon history for users assigned with this license type.
Planning Licenses – Assigned Planning Licenses and their maximum limit. On click pops-up a chart with logon history for users assigned with this license type.
Professional Licenses – Assigned Planning Professional Licenses and their maximum limit. On click menu pops-up a chart with logon history for users assigned with this license type.
Top 10 User by Storage – Users by size of their total stored content.
Top 10 Models by Storage – Models by their size.
Search for – free search in the repository for objects such as folder, connection, model, dataset, data action, analytic application, story, and insight. Free search for teams, roles and users. The icon opens a specific search pop-up from where you can jump to the respective fact sheet for detailed information about the object, user, role, or team. Fact Sheets will be discussed later.
Search
Content
The structure of the ‘content’ section for all other topics are similar. We start each page at the top with a content summary or key KPIs. This is followed by more granular information that is structured in sections. Each section is, by default, expanded but can also be collapsed. Subsequent sections give access to fact sheets, editor, and overview. After selecting a table entry, each of the three buttons open a new browser tab.

Depending on the object type, fact sheets will have different flavors, which we will discuss later.

For all object types, except user, team, and connection, the editor jumps directly into the maintenance of the selected object.
The overview button directs you to the SAP Analytics Cloud menu entry for the selected object type.
Another common functionality for all tables in the Administration Cockpit is the possibility to export to .csv, .xlsx, and .pdf.
The content summary allows you to gain rapid overview of all objects that have been created within the SAP Analytics Cloud Service.
General and Planning related content sections have the full list of the information per object type.
Authorization
Purpose of the authorization topic is to get the complete picture of role and team assignments, as easily as possible.
Key KPIs show users, teams, roles that are in-use, teams without any user assignment, users that have not logged-on in the past 6 month or more and user accounts that have never been used at all.

The user section displays user IDs by variable filters selectable via the KPI tiles above.
The team section helps to find unused teams and teams that have no role assignment. It also shows the teams’ size.
The role section gives the full list of roles that have been directly assigned to users or teams and their frequency of use.
Note: If you follow best practice, then no users will have a directly assigned role, they will all be assigned via a team. For more details please visit SAP Analytics Cloud - Security Concepts and Best Practice
Note: The Defined Users KPI may differ from the number of users that you see in SAC > Security > User because we show here also technical users to be complete.
The authorization overview will help you to identify roles that are assigned to users directly. The role's fact sheet helps you then to identify the users that have this direct role assignment whereas the user's fact sheet then helps you to identify which roles the user inherits via a team assignment in contrast to the directly assigned roles.
If you are looking for a specific user, team or role to check remember the search functionality on the home tab and enter fact sheets directly.
Security
Security, or the question what has been shared to whom and how?
Key KPIs show the number of shared objects and how often something has been shared with either the delete or share rights.
The shared objects table provides a full list of object names, their description, ID, and full id (concatenating “object type + ID” and is needed for navigational purposes) of the above.

A very common question is: “I have a list of shared objects, but to whom and how have they been shared?”
This question can be answered by the fact sheet’s security section where you’ll find a full access matrix of users and teams that have access. If you are only interested in a specific folder, Story, Analytic Application, etc. you can also use the search functionality from the home tab to navigate to its Fact Sheet directly.
Dependencies
In past, it might have been a tedious task to identify dependencies between objects.
Dependencies in the Administration Cockpit makes this task much easier than before. Key KPIs show how many models, connections, data actions, and all other object types that might have dependents. Additional it shows the number of models and data actions that aren’t in use anymore.

A dependent object is an object that describes the dependency between two other objects. The dependent object ID corresponds to the full object ID. These dependent objects are necessary to determine what objects are dependent upon others.
To answer the business question: “What are the applications and stories that are dependent upon a given analytic model?” The answer is available in a “fact sheet”. The full list of dependent objects is shown, by type.
Usage
What’s used? What’s unused? What’s used most? What are my top contributors? We try to answer many of those questions in the usage section.
There are currently other usage type questions that cannot yet be answered, but we hope to provide this information soon. The types of usage questions currently not possible are: “How many widgets do I have per story or application? What pages do the users navigate to in my stories or applications? What widget types are most used?”

Housekeeping
Housekeeping aims to help you identify application, stories, folder, etc. that are not actively used anymore.

The Key KPIs and the unused resources section is filtered for the timeframe of “current month - 24 months” to “current month - 6 months”.
the oldest accessed objects sections show all objects last access date per object type ascending.
Trace
The trace section shows the know information of SAP Analytics Cloud Menu > System > Monitor > Trace.
We added the error history chart as well as the Top 10 User by errors history chart.

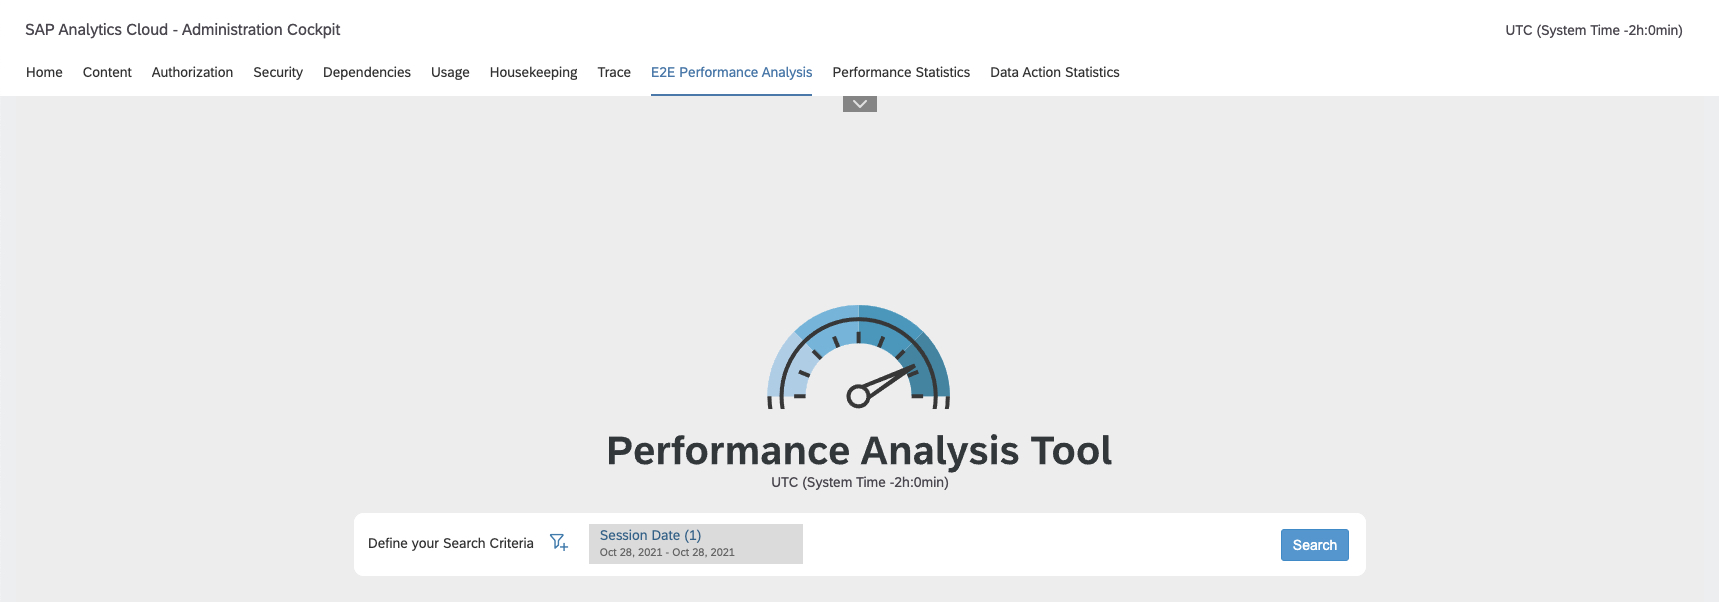
E2E Performance Analysis
This is the embedded view of the SAP Analytics Cloud Performance Analysis Tool. For further details please visit the blog post SAP Analytics Cloud Performance Analysis Tool
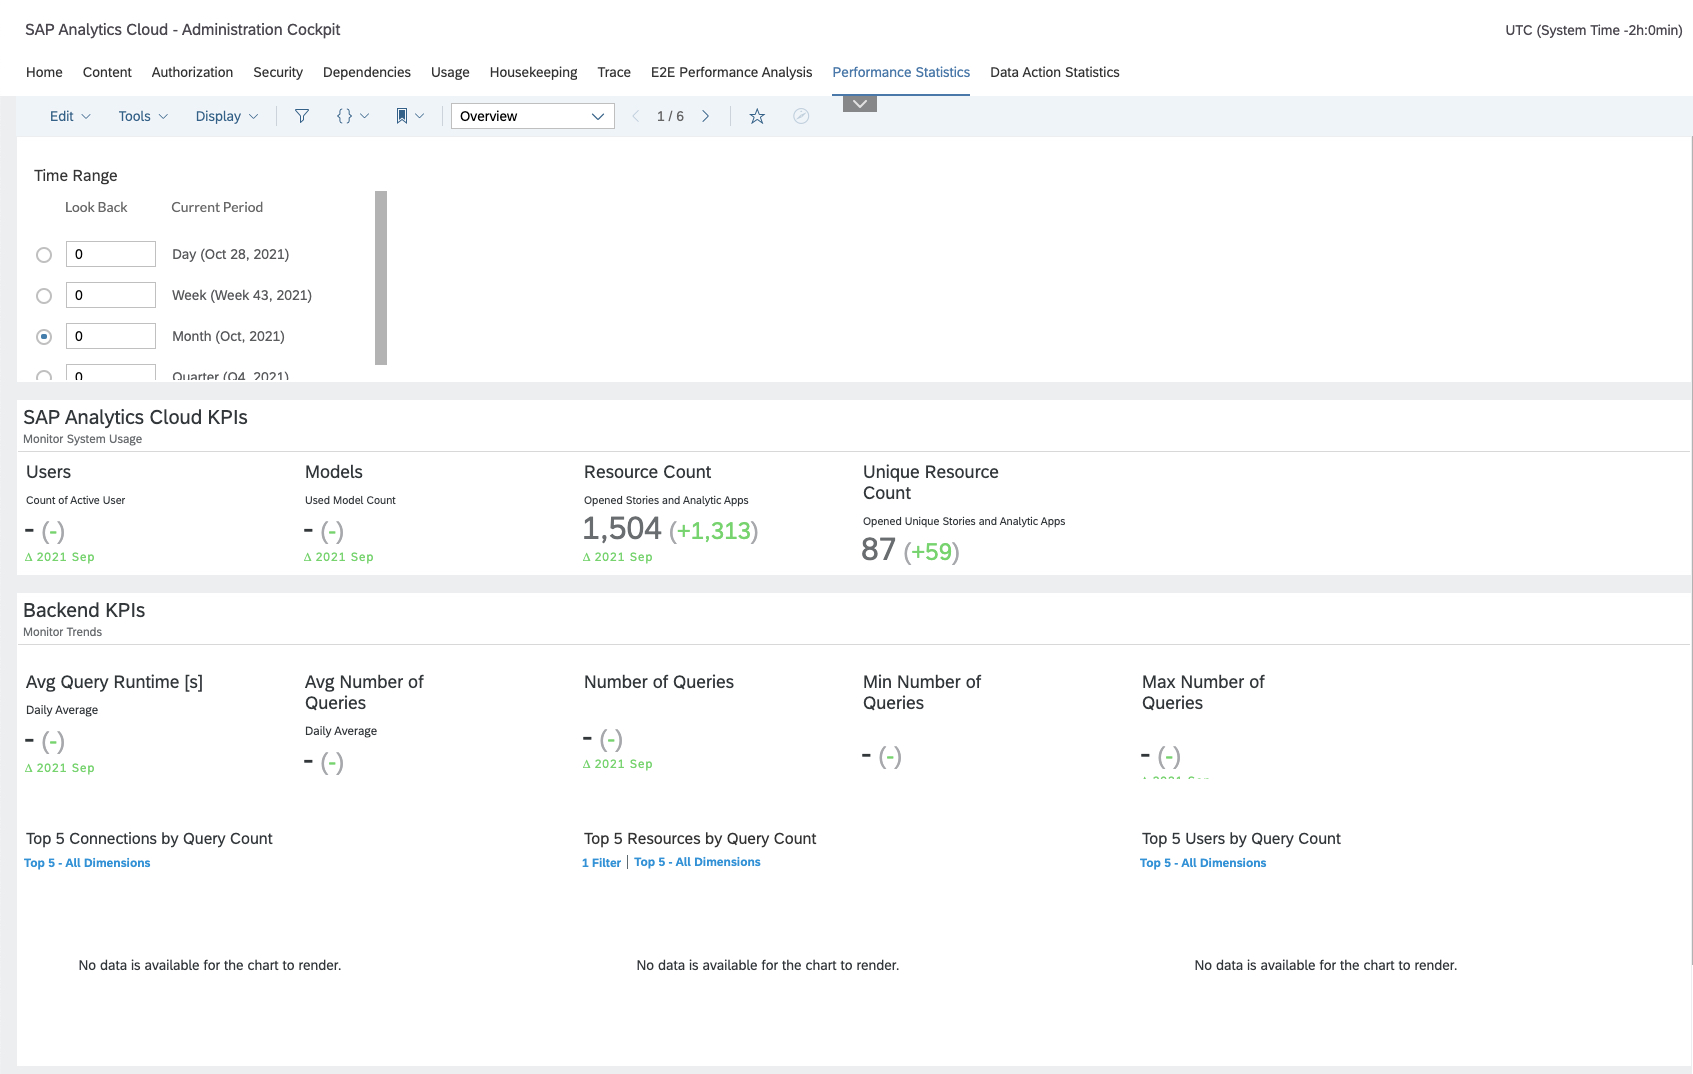
Performance Statistics
This is the embedded view of the SAP Analytics Cloud Performance Statistics and Analysis. For further details please visit the blog post SAP Analytics Cloud Performance Statistics and Analysis
Data Action Statistics
This is the embedded view of the SAP Analytics Cloud Data Action Performance Statistics and Analysis. For further details please visit the blog post SAP Analytics Cloud Data Action Performance Statistics and Analysis
Fact Sheets
All fact sheets have a similar structure and is explained in this first example of the model fact sheet.
Administration Cockpit | Fact Sheet | Model

The top of the page, the header area contains information of the model ID, name, description, creation date, and owner.
It also offers the possibility to jump to the model editor and the model overview in the SAP Analytics Cloud menu.
Below the header we have (up to) four sections: Overview, security, dependencies and content.
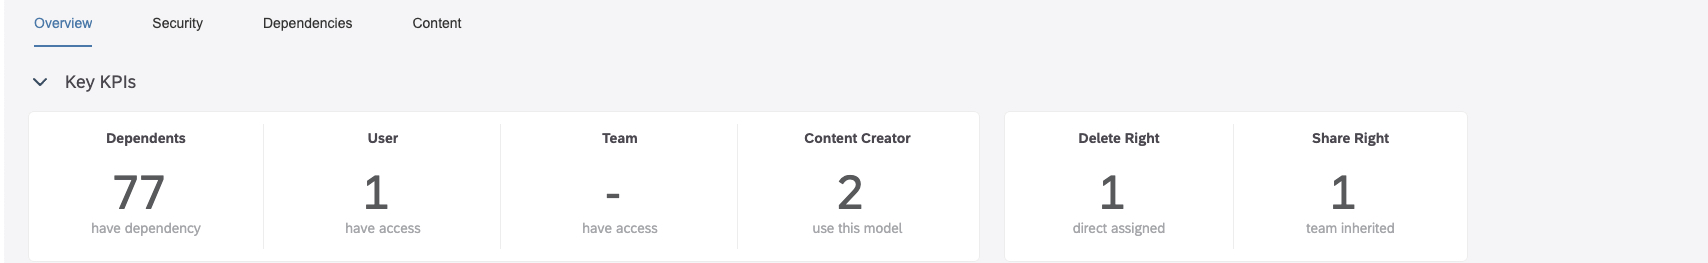
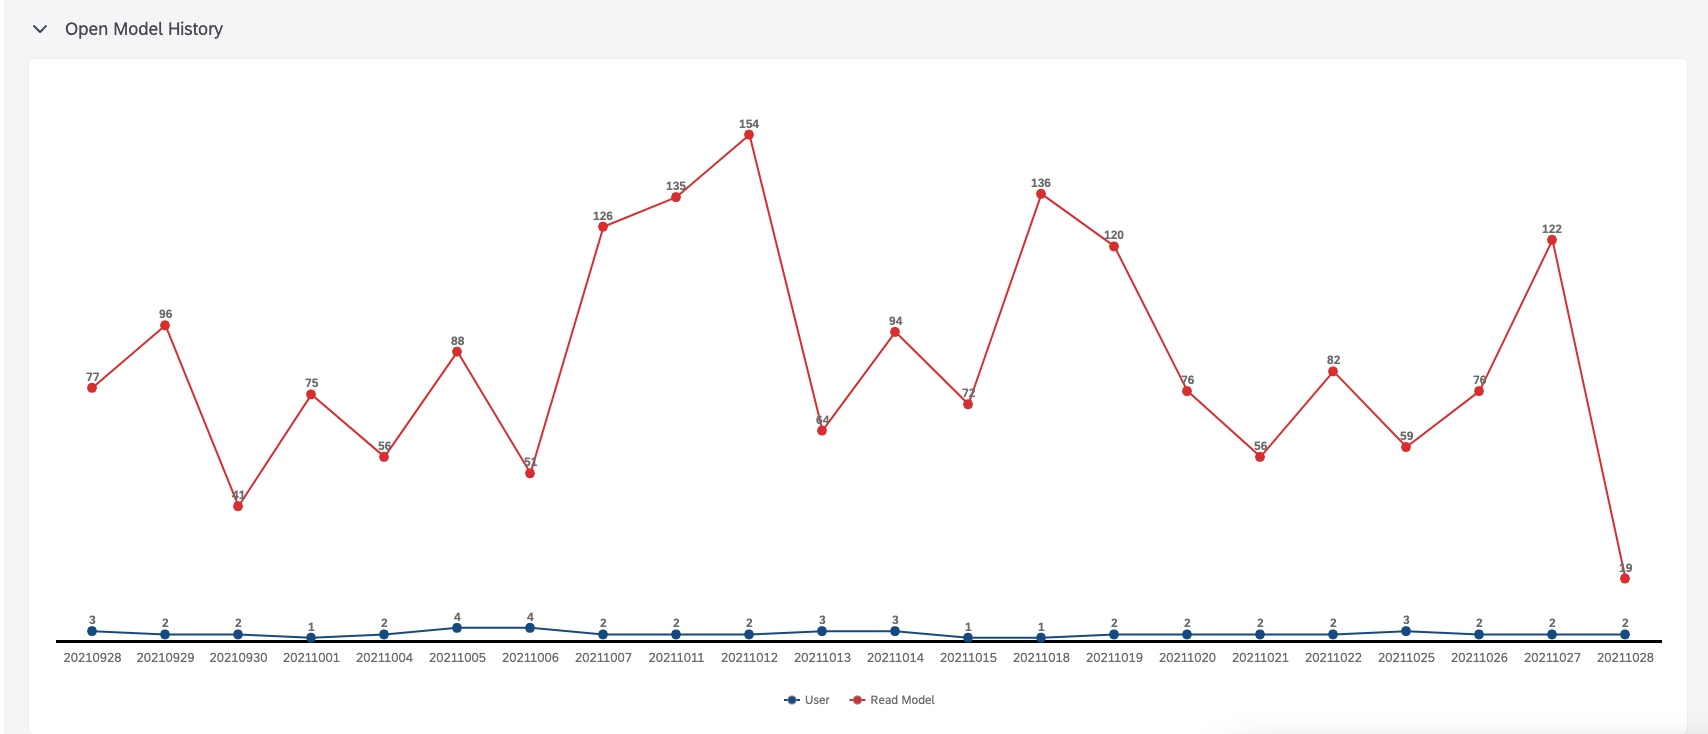
The overview section contains key KPIs, dependents, security and open model history lanes.

The key KPIs Lane
For the Model, this lane shows the number of dependent objects, users and teams that have access to the model, the users that use the models in their stories, applications, data actions, etc., as well as the number of granted delete and share rights on that model.
The dependents Lane
shows a tabular view of name, description, ID, full ID of the dependent objects, its type and subtype, and how many users and/or teams have access.

Note: Subtype of Story itself = (No Value). Analytic Application and Insight will show the respective value 'APPLICATION' or 'INSIGHT'.
The security lane adds, in a tabular view, user ID and team ID to the delete right and share right KPI data.

The open model history lane shows the read access history of the model.
The security section contains a tabular view the access matrix of all users and teams that have access to the model.

The dependencies section contains a tabular view of the name, description, ID, full ID, object type and subtype of the dependent object, as well as how many users and teams have access to it.


The content section contains a list of the content creators for this model. These are the creators of the dependents.
.

Wherever it makes sense, we allow you to jump from the tables to fact sheet, editor, and overview.
Administration Cockpit | Fact Sheet | User
Another complex fact sheet is the user fact sheet. It slightly differs from the model fact sheet but follows the same approach.

The header provides information on user ID, first and last name, email contact, license type, display name, current activity status, and last successful connect. There is also the possibility to jump to the user administration page in SAP Analytics Cloud Menu.
Below the Header we have four sections: Overview, authorization, security and content.
The overview section contains Key KPIs, Session Trend and Most Read Resources.
The key KPIs lane
for the user shows the numbers for the different object types that have been shared with the user, how many roles are direct assigned to the user, how many roles are inherited and how many teams the user is a member of.
The session trend lane
Shows the history of the users SAP Analytics Cloud sessions and browser sessions by day.

The most read resources lane
shows the models, analytic applications, stories, and insights that are used most by the user.

The authorization section contains a tabular view the role assignments, which can be separated in direct assigned and team inherited, and team assignments.

The security section contains a tabular view of the name, description, ID, full ID with access rights that are shared to the user.

The content section contains a list of the content that has been created by the user and how many users and teams have access to it.

Wherever it makes sense, we allow you to jump from the tables to fact sheet, editor and overview.
Administration Cockpit | Fact Sheet | Role
The role fact sheet shows user and team assignments and opens the possibility to jump to the role maintenance directly.

Administration Cockpit | Fact Sheet | Team
The team fact sheet shows user and role assignments and opens the possibility to jump to the team overview directly.

The following fact sheets contain the same information and functionality as the Fact Sheet | Model but only overview and security are relevant. Thus, the following fact sheets are less complex. Please see them as a list of reference and for completeness. They should be self-explanatory after the introduction of the model and the user fact sheet. If questions remain, please feel free to post them to this blog post.
Administration Cockpit | Fact Sheet | Analytic Application

Administration Cockpit | Fact Sheet | Story

Administration Cockpit | Fact Sheet | Insight

Administration Cockpit | Fact Sheet | Folder

Administration Cockpit | Fact Sheet | Connection

Administration Cockpit | Fact Sheet | Data Action

Administration Cockpit | Fact Sheet | Dataset

We hope you like the new content!
Outlook:
- Improvements in Usage Reporting
- How many Widgets per Resource
- Most visited Pages in Resources
- Models per Connection
- Models per Resource
- Widget Types per Resource
- ...
- SAP Managed Tags:
- SAP Analytics Cloud
Labels:
30 Comments
You must be a registered user to add a comment. If you've already registered, sign in. Otherwise, register and sign in.
Labels in this area
-
ABAP CDS Views - CDC (Change Data Capture)
2 -
AI
1 -
Analyze Workload Data
1 -
BTP
1 -
Business and IT Integration
2 -
Business application stu
1 -
Business Technology Platform
1 -
Business Trends
1,661 -
Business Trends
88 -
CAP
1 -
cf
1 -
Cloud Foundry
1 -
Confluent
1 -
Customer COE Basics and Fundamentals
1 -
Customer COE Latest and Greatest
3 -
Customer Data Browser app
1 -
Data Analysis Tool
1 -
data migration
1 -
data transfer
1 -
Datasphere
2 -
Event Information
1,400 -
Event Information
65 -
Expert
1 -
Expert Insights
178 -
Expert Insights
280 -
General
1 -
Google cloud
1 -
Google Next'24
1 -
Kafka
1 -
Life at SAP
784 -
Life at SAP
11 -
Migrate your Data App
1 -
MTA
1 -
Network Performance Analysis
1 -
NodeJS
1 -
PDF
1 -
POC
1 -
Product Updates
4,577 -
Product Updates
330 -
Replication Flow
1 -
RisewithSAP
1 -
SAP BTP
1 -
SAP BTP Cloud Foundry
1 -
SAP Cloud ALM
1 -
SAP Cloud Application Programming Model
1 -
SAP Datasphere
2 -
SAP S4HANA Cloud
1 -
SAP S4HANA Migration Cockpit
1 -
Technology Updates
6,886 -
Technology Updates
408 -
Workload Fluctuations
1
Related Content
- I cannot cancel an import in SAP Analytics Cloud from SAP Hana. in Technology Q&A
- Top Picks: Innovations Highlights from SAP Business Technology Platform (Q1/2024) in Technology Blogs by SAP
- What’s New in SAP Analytics Cloud Release 2024.08 in Technology Blogs by SAP
- Consuming SAP with SAP Build Apps - Connectivity options for low-code development - part 2 in Technology Blogs by SAP
- Connection restrictions and their relation to user groups in SAP HANA Cloud, SAP HANA Database in Technology Blogs by SAP
Top kudoed authors
| User | Count |
|---|---|
| 13 | |
| 10 | |
| 10 | |
| 7 | |
| 6 | |
| 5 | |
| 5 | |
| 5 | |
| 4 | |
| 4 |