
- SAP Community
- Products and Technology
- Technology
- Technology Blogs by SAP
- New Message Monitors for Integration Experts and A...
Technology Blogs by SAP
Learn how to extend and personalize SAP applications. Follow the SAP technology blog for insights into SAP BTP, ABAP, SAP Analytics Cloud, SAP HANA, and more.
Turn on suggestions
Auto-suggest helps you quickly narrow down your search results by suggesting possible matches as you type.
Showing results for
Product and Topic Expert
Options
- Subscribe to RSS Feed
- Mark as New
- Mark as Read
- Bookmark
- Subscribe
- Printer Friendly Page
- Report Inappropriate Content
11-18-2021
2:55 PM
SAP has recently shipped new message monitors in SAP Fiori UX technology, the Message Monitoring for Integration Experts and the Message Monitoring for Administrators. In SAP S/4HANA the monitors have been supported as of release 2021, in SAP S/4HANA Cloud they have been available since release 2108.
The new monitors support the same capabilities like the Message Monitoring which has been shipped in 2020, see SAP Fiori UX monitor with SAP S/4HANA 2020 shipment. However, whereas the Message Monitoring is rather suited for line of business users, the new monitors show more technical information such as the recipient or the complete data structure, etc., and hence, as the names suggest, are addressed to integration experts and administrators.
In the following, I walk you through some of the new monitoring capabilities.
I assume that you have added the two new monitors to your SAP Fiori launchpad. If you like to know how this works, check out the blog How to configure the SAP Fiori Apps for SAP Application Interface Framework.
Let' start with the Message Monitoring for Integration Experts.
In the Fiori launchpad, select the Message Monitoring for Integration Experts tile below the Message Monitoring space.
In the Message Monitoring for Integration Experts overview page, you get all interfaces that you are assigned to and their message status displayed in table format. You can filter the messages on time interval and a particular interface name. Furthermore, you can choose between showing Interfaces with messages only, Interfaces with errors only, and All interfaces.
Enter the message monitoring details, by clicking the number of the entry you are interested in. In our case, we like to see all 8 processed messages of the Create flight customer interface.
In the navigation pane of the details view of the Message Monitoring for Integration Experts, you see all messages that correspond to the chosen filter. For each entry, you get the Key Information if defined for the particular interface, the Log Detail and the Data Content displayed.
Furthermore, as you can see from the top bar, you can carry out the following activities:
You can expand the header to adapt the filter. By default, you can filter based on Time interval and Status. In addition, we have maintained key fields in the interface’s index table that allows you to filter on City, Country, and Region.
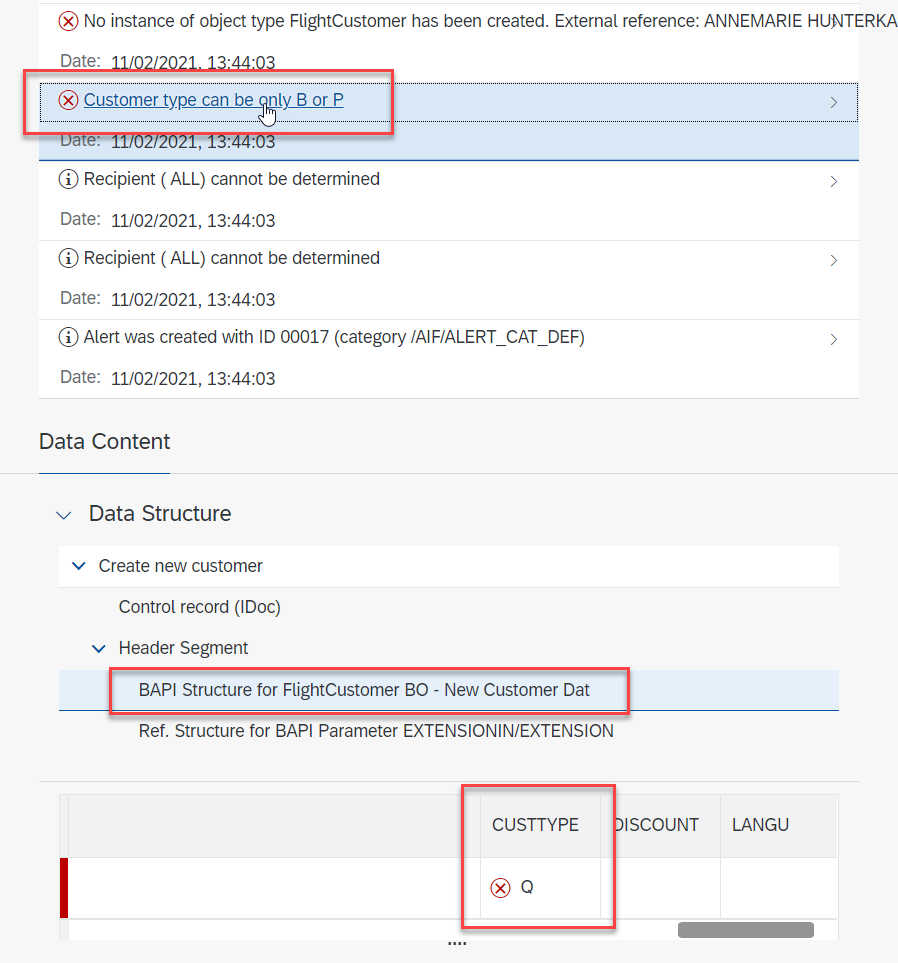
In the Log Detail, click the icon next to the Customer type can be only B or P log message.
This will open a third column on the right showing the Log Message Detail. Besides the log details, Hints and the Data Link are also displayed here. If the space is too narrow, you can expand the column by entering the full screen mode. This is also supported for the column in the middle.
As you have seen on the log details, we have maintained a data link for the specific error code. If we click on the Customer type can be only B or P link, we automatically navigate to the field in the message structure that caused the error.
Now we can edit the customer type, entering a valid value, and save.
As you can see in the navigation pane, the status has changed to Edited. This change is by the way also logged in the change log.
Now we can restart and then refresh the message.
As you can see, the status has changed to Success. A flight customer has been successfully created.
Let's pick another erroneous message to show the Process Status capability. You can set the process status in order to inform your peers which are assigned to the same interface about the error resolution progress. By doing so, you can avoid multiple people working on fixing the same issue.
As you can see, so far no processor has been assigned. So, we click the Set Process information button on top of the message.
In the upcoming dialog, we can set the Process Status, here In Process, and maintain a Comment, then save.
The Process Status has been changed accordingly, the message is assigned to the Admin AIF user, and you can see that one comment exist.
By clicking on the Comments number, we can add further comments without changing the status.
To change the status to Blocked for instance, we can select the Set Process information button again.
Now, let's take a look at the Message Monitoring for Administrators. We navigate back to the Fiori launchpad home page, and select the Message Monitoring for Administrators tile.
Like in the Message Monitoring for Integration Experts, the Message Monitoring for Administrators displays the status overview in table format. Other than in the Message Monitoring for Integration Experts, the Message Monitoring for Administrators shows all AIF interfaces defined in the SAP S/4HANA system regardless whether the user is assigned to a recipient or not.
In addition to the Message Monitoring for Integration Experts, here the Recipient information is displayed, and can be used for filtering as well. You can switch between ordering the message status overview entries by Interface first or by Recipient first.
If you enter the message details, the same capabilities are supported like in the Message Monitoring for Integration Experts, see above.
For more details about the monitors, check out the documentation at the SAP Help Portal:
The new monitors support the same capabilities like the Message Monitoring which has been shipped in 2020, see SAP Fiori UX monitor with SAP S/4HANA 2020 shipment. However, whereas the Message Monitoring is rather suited for line of business users, the new monitors show more technical information such as the recipient or the complete data structure, etc., and hence, as the names suggest, are addressed to integration experts and administrators.
In the following, I walk you through some of the new monitoring capabilities.
I assume that you have added the two new monitors to your SAP Fiori launchpad. If you like to know how this works, check out the blog How to configure the SAP Fiori Apps for SAP Application Interface Framework.
Let' start with the Message Monitoring for Integration Experts.
Message Monitoring for Integration Experts
In the Fiori launchpad, select the Message Monitoring for Integration Experts tile below the Message Monitoring space.

In the Message Monitoring for Integration Experts overview page, you get all interfaces that you are assigned to and their message status displayed in table format. You can filter the messages on time interval and a particular interface name. Furthermore, you can choose between showing Interfaces with messages only, Interfaces with errors only, and All interfaces.

Enter the message monitoring details, by clicking the number of the entry you are interested in. In our case, we like to see all 8 processed messages of the Create flight customer interface.

In the navigation pane of the details view of the Message Monitoring for Integration Experts, you see all messages that correspond to the chosen filter. For each entry, you get the Key Information if defined for the particular interface, the Log Detail and the Data Content displayed.
Furthermore, as you can see from the top bar, you can carry out the following activities:
- Edit the message payload
- Restart the message
- Cancel the message
- Set the Process Information and the Process Status
- Refresh the message status
- Download the message payload

You can expand the header to adapt the filter. By default, you can filter based on Time interval and Status. In addition, we have maintained key fields in the interface’s index table that allows you to filter on City, Country, and Region.

In the Log Detail, click the icon next to the Customer type can be only B or P log message.

This will open a third column on the right showing the Log Message Detail. Besides the log details, Hints and the Data Link are also displayed here. If the space is too narrow, you can expand the column by entering the full screen mode. This is also supported for the column in the middle.

As you have seen on the log details, we have maintained a data link for the specific error code. If we click on the Customer type can be only B or P link, we automatically navigate to the field in the message structure that caused the error.
Now we can edit the customer type, entering a valid value, and save.

As you can see in the navigation pane, the status has changed to Edited. This change is by the way also logged in the change log.

Now we can restart and then refresh the message.

As you can see, the status has changed to Success. A flight customer has been successfully created.

Let's pick another erroneous message to show the Process Status capability. You can set the process status in order to inform your peers which are assigned to the same interface about the error resolution progress. By doing so, you can avoid multiple people working on fixing the same issue.
As you can see, so far no processor has been assigned. So, we click the Set Process information button on top of the message.

In the upcoming dialog, we can set the Process Status, here In Process, and maintain a Comment, then save.

The Process Status has been changed accordingly, the message is assigned to the Admin AIF user, and you can see that one comment exist.

By clicking on the Comments number, we can add further comments without changing the status.

To change the status to Blocked for instance, we can select the Set Process information button again.

Message Monitoring for Administrators
Now, let's take a look at the Message Monitoring for Administrators. We navigate back to the Fiori launchpad home page, and select the Message Monitoring for Administrators tile.

Like in the Message Monitoring for Integration Experts, the Message Monitoring for Administrators displays the status overview in table format. Other than in the Message Monitoring for Integration Experts, the Message Monitoring for Administrators shows all AIF interfaces defined in the SAP S/4HANA system regardless whether the user is assigned to a recipient or not.

In addition to the Message Monitoring for Integration Experts, here the Recipient information is displayed, and can be used for filtering as well. You can switch between ordering the message status overview entries by Interface first or by Recipient first.

If you enter the message details, the same capabilities are supported like in the Message Monitoring for Integration Experts, see above.
For more details about the monitors, check out the documentation at the SAP Help Portal:
- SAP Managed Tags:
- SAP Fiori,
- SAP Application Interface Framework,
- SAP S/4HANA,
- SAP S/4HANA Public Cloud
Labels:
2 Comments
You must be a registered user to add a comment. If you've already registered, sign in. Otherwise, register and sign in.
Labels in this area
-
ABAP CDS Views - CDC (Change Data Capture)
2 -
AI
1 -
Analyze Workload Data
1 -
BTP
1 -
Business and IT Integration
2 -
Business application stu
1 -
Business Technology Platform
1 -
Business Trends
1,661 -
Business Trends
91 -
CAP
1 -
cf
1 -
Cloud Foundry
1 -
Confluent
1 -
Customer COE Basics and Fundamentals
1 -
Customer COE Latest and Greatest
3 -
Customer Data Browser app
1 -
Data Analysis Tool
1 -
data migration
1 -
data transfer
1 -
Datasphere
2 -
Event Information
1,400 -
Event Information
66 -
Expert
1 -
Expert Insights
178 -
Expert Insights
293 -
General
1 -
Google cloud
1 -
Google Next'24
1 -
Kafka
1 -
Life at SAP
784 -
Life at SAP
12 -
Migrate your Data App
1 -
MTA
1 -
Network Performance Analysis
1 -
NodeJS
1 -
PDF
1 -
POC
1 -
Product Updates
4,577 -
Product Updates
337 -
Replication Flow
1 -
RisewithSAP
1 -
SAP BTP
1 -
SAP BTP Cloud Foundry
1 -
SAP Cloud ALM
1 -
SAP Cloud Application Programming Model
1 -
SAP Datasphere
2 -
SAP S4HANA Cloud
1 -
SAP S4HANA Migration Cockpit
1 -
Technology Updates
6,886 -
Technology Updates
415 -
Workload Fluctuations
1
Related Content
- How to monitor SAP Cloud Integration jobs on solman? in Technology Q&A
- CAP LLM Plugin – Empowering Developers for rapid Gen AI-CAP App Development in Technology Blogs by SAP
- Notification event for total number of messages in SAP Cloud ALM integration & exception monitoring in Technology Q&A
- What’s New in SAP Analytics Cloud Release 2024.07 in Technology Blogs by SAP
- SAP Datasphere - Space, Data Integration, and Data Modeling Best Practices in Technology Blogs by SAP
Top kudoed authors
| User | Count |
|---|---|
| 29 | |
| 21 | |
| 10 | |
| 7 | |
| 7 | |
| 6 | |
| 6 | |
| 5 | |
| 5 | |
| 5 |